Downloaded 323 times
![References
Carter, C. O., 1980.
4,242,531.
Lummus Technology, 2010.
US, Patent No.
s.l.:Provided by Lummus
on August, 24th 2010.
Carter, C. O., 1985.
Lummus Technology, 2010.
s.l.:Provided by Lummus on August, 24th, 2010.
Chodorge, J. A., Cosyns, J., Commereuc, B. & Torck, B., 1997.
Propylene Production from Butenes and Ethylene.
, Spring.
Delaude, L. & Noels, A. F., 2007. Metathesis Section. In:
s.l.:WileyInterscience.
Drake, C. A. & Reusser, R. E., 1986.
US, Patent No. 4,575,575.
Mol, J. C., 2004. Industrial Applications of Olefin Metathesis.
213(1), pp. 39-45.
Network China Industrial Information, n.d.
[Online]
Available at: www.chyxx.com
[Accessed 10 March 2012].
Senetar, J. J. & Glover, B. K., 2010.
Dwyer, C. L., 2006. Metathesis of Olefins. In: G. P. Chiusoli & P.
M. Maitlis, eds.
s.l.:Royal Society of Chemistry, pp. 201-217.
Stanley, S., 2009. Cover Story – Ethylene Enhancement.
, February.
Eisele, P. & Killpack, R., 2002. Propene Section. In:
s.l.:Wiley-Interscience.
Sumner, C., 2009.
Gartside, R. J. & Greene, M. I., 2007.
No. 7,525,007 B2.
US, Patent
US,
Patent No. 7,214,841 B2.
Takai, T. & Kubota, T., 2010.
Patent No. 2010/0145126 A1.
US,
Gartside, R. J., Greene, M. I. & Jones, Q. J., 2004.
US, Patent No. 6,777,582 B2.
Gartside, R. J. & Ramachandran, B., 2010.
Weidert, D. J., 2000.
s.l., AIChE 2000 Spring Meeting.
Zinger, S., 2005. One-purpose propylene production.
, Q3.
Hildreth, J. M., Dukandar, K. N. & Venner, R. M., 2009.
Hydrocarbon Processing, 2005.
s.l.:Gulf Publishing.
Intratec | References
Lummus Technology, 2009.
[Online]
Available at:
www.cbi.com/images/uploads/tech_sheets/Olefins.pdf
[Accessed 20 March 2012].
FREE SAMPLE
37](https://image.slidesharecdn.com/tec001a-preview-120402190638-phpapp01/75/Technology-Economics-Propylene-via-Metathesis-41-2048.jpg)
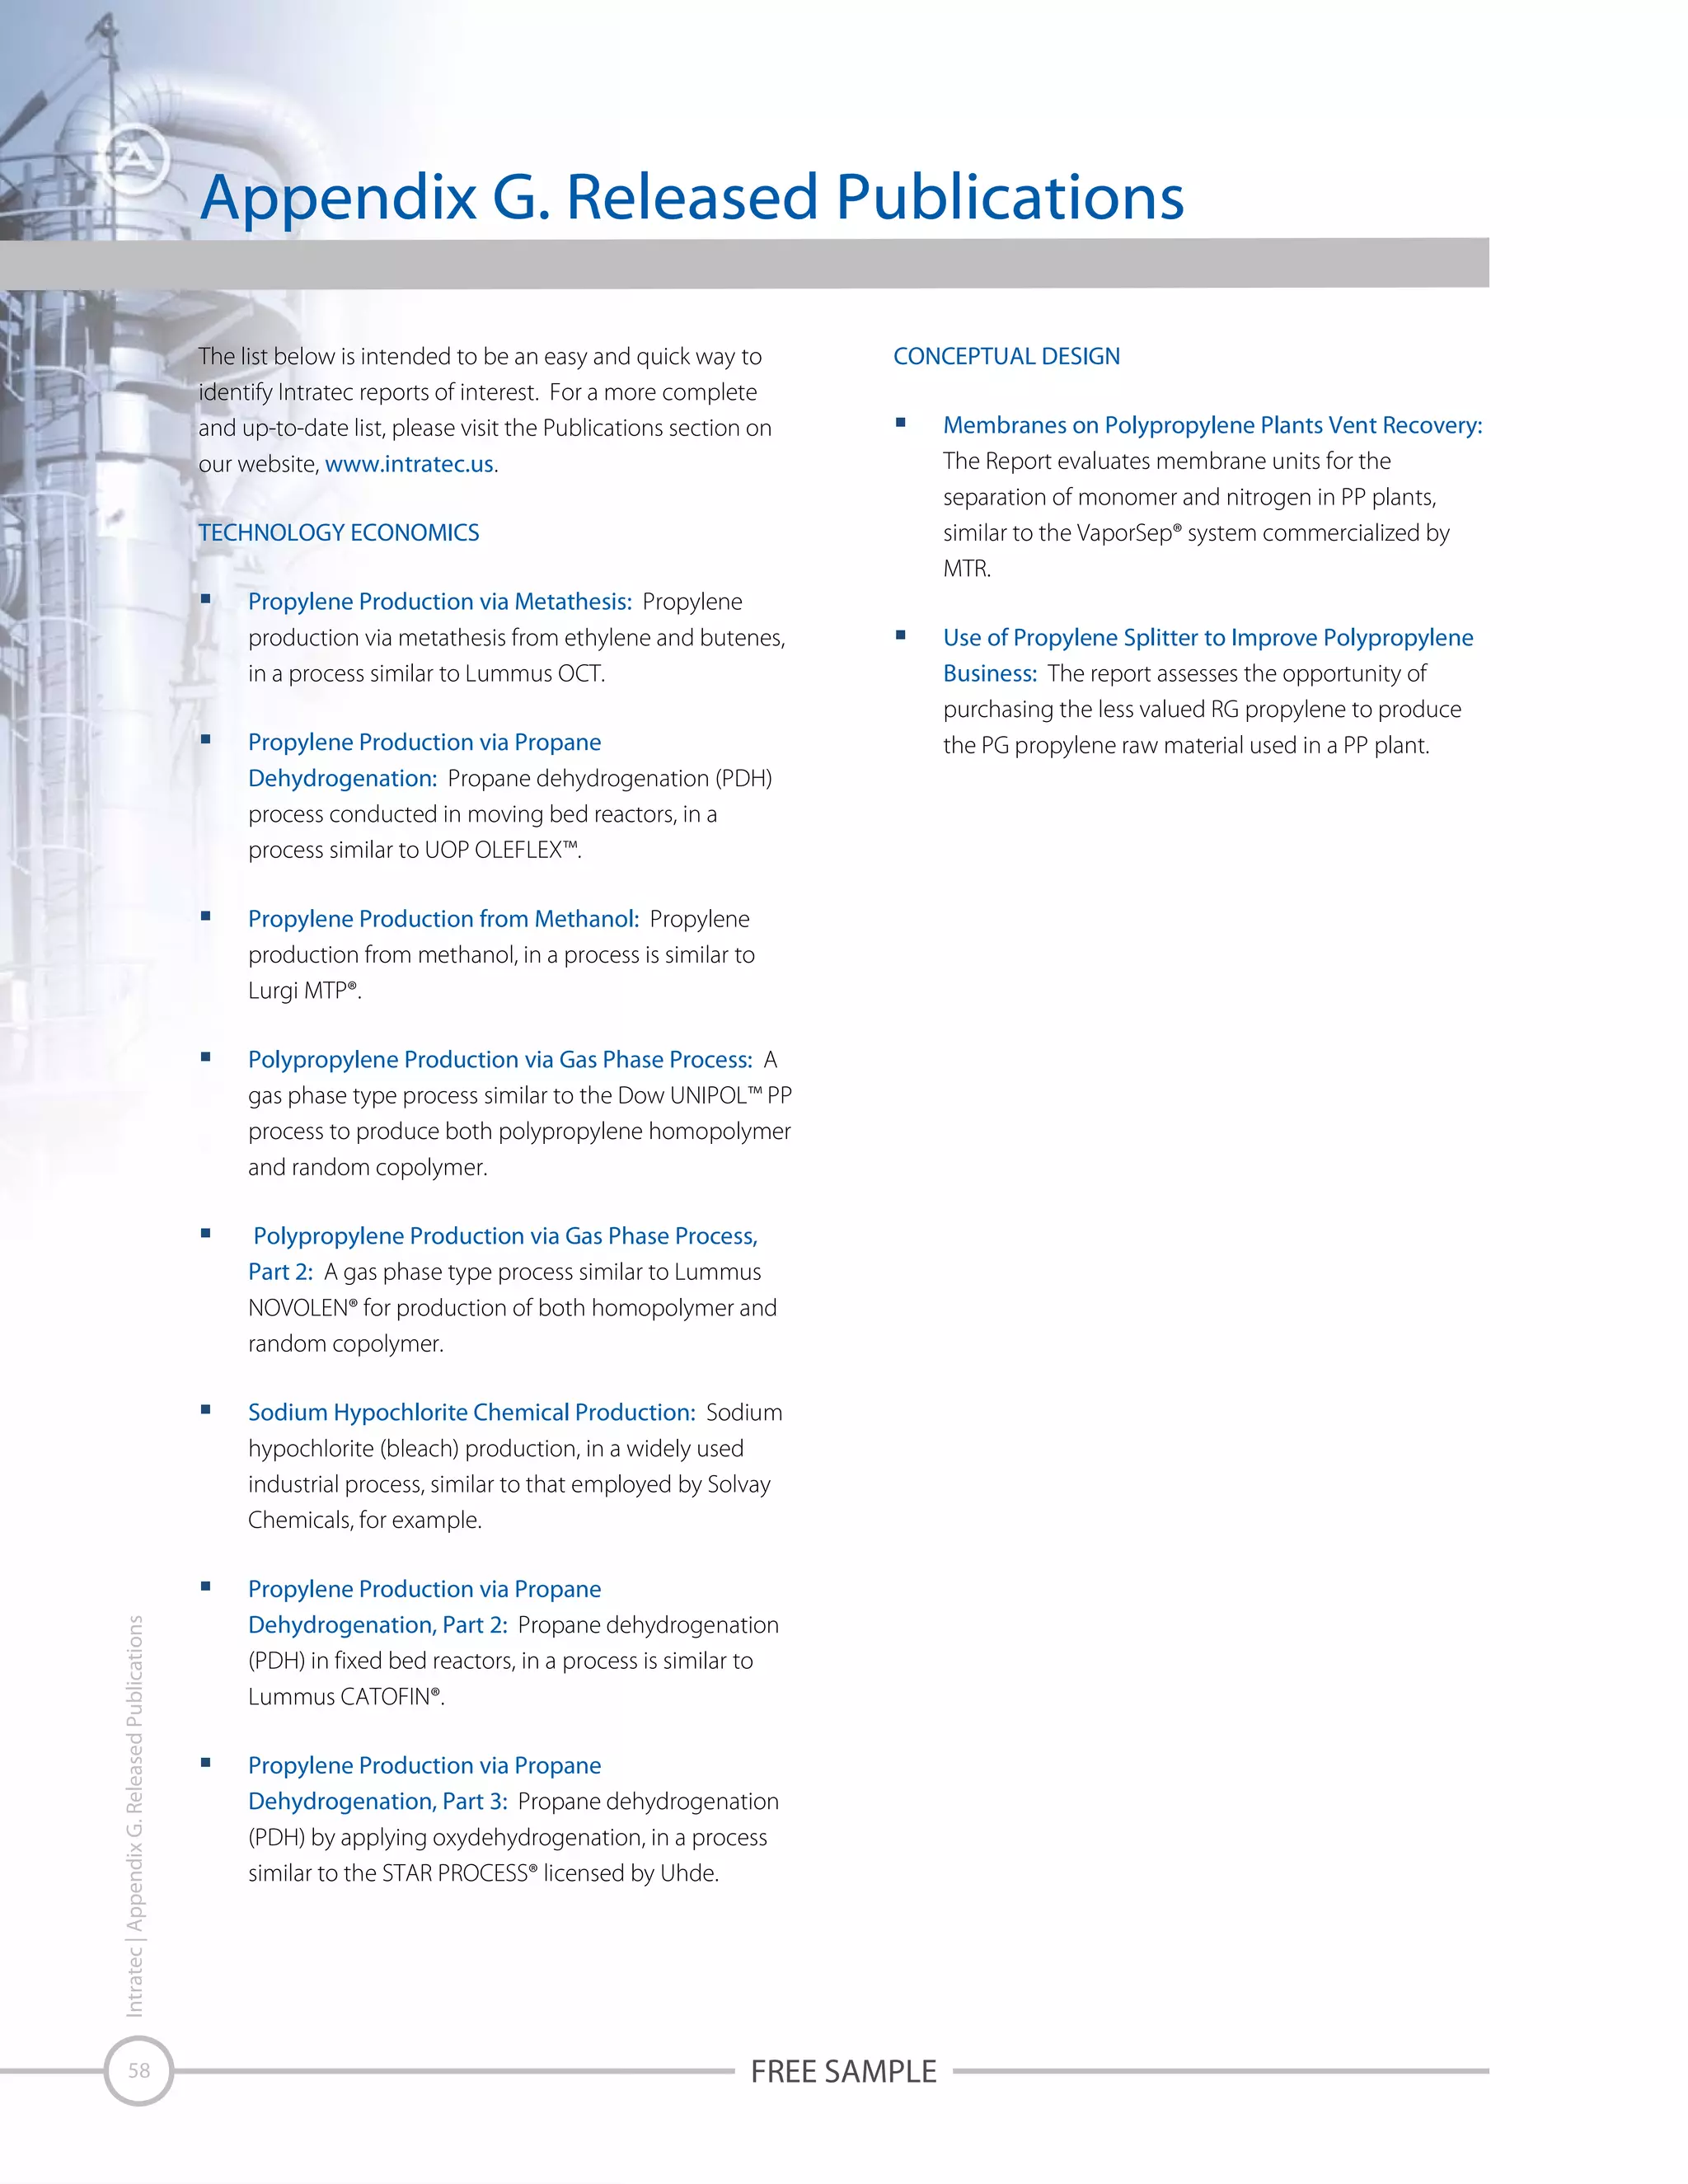
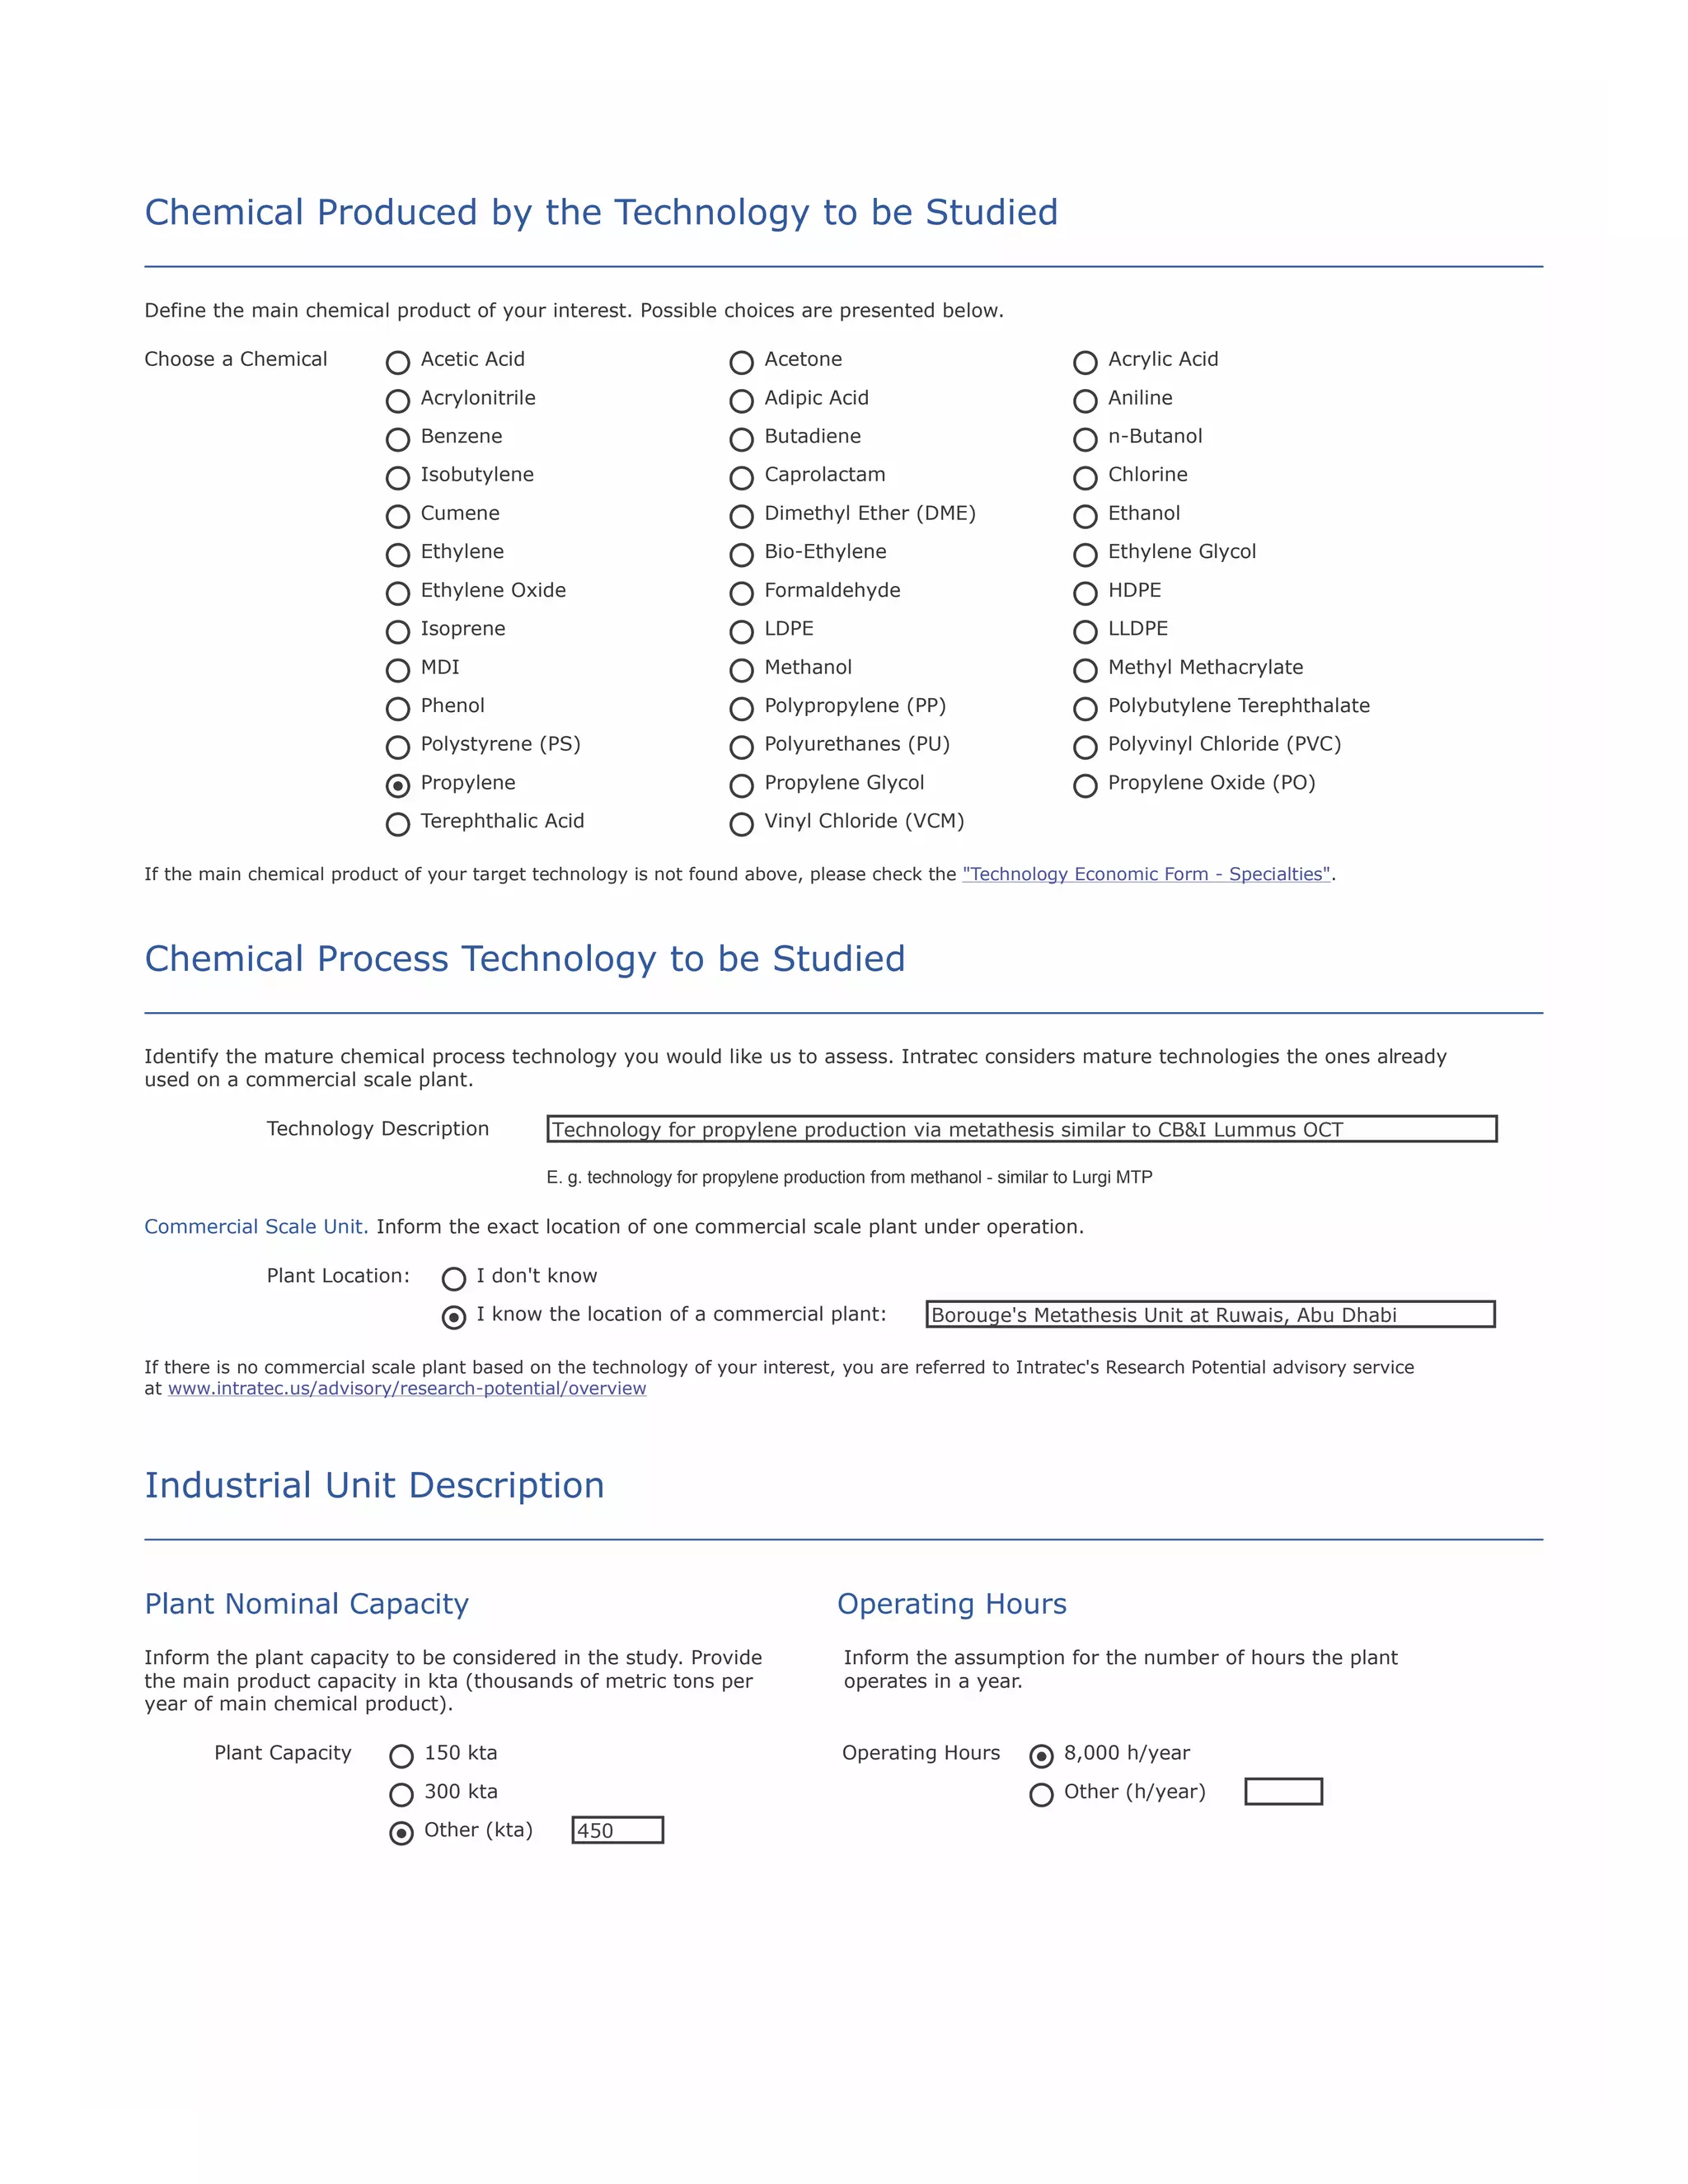
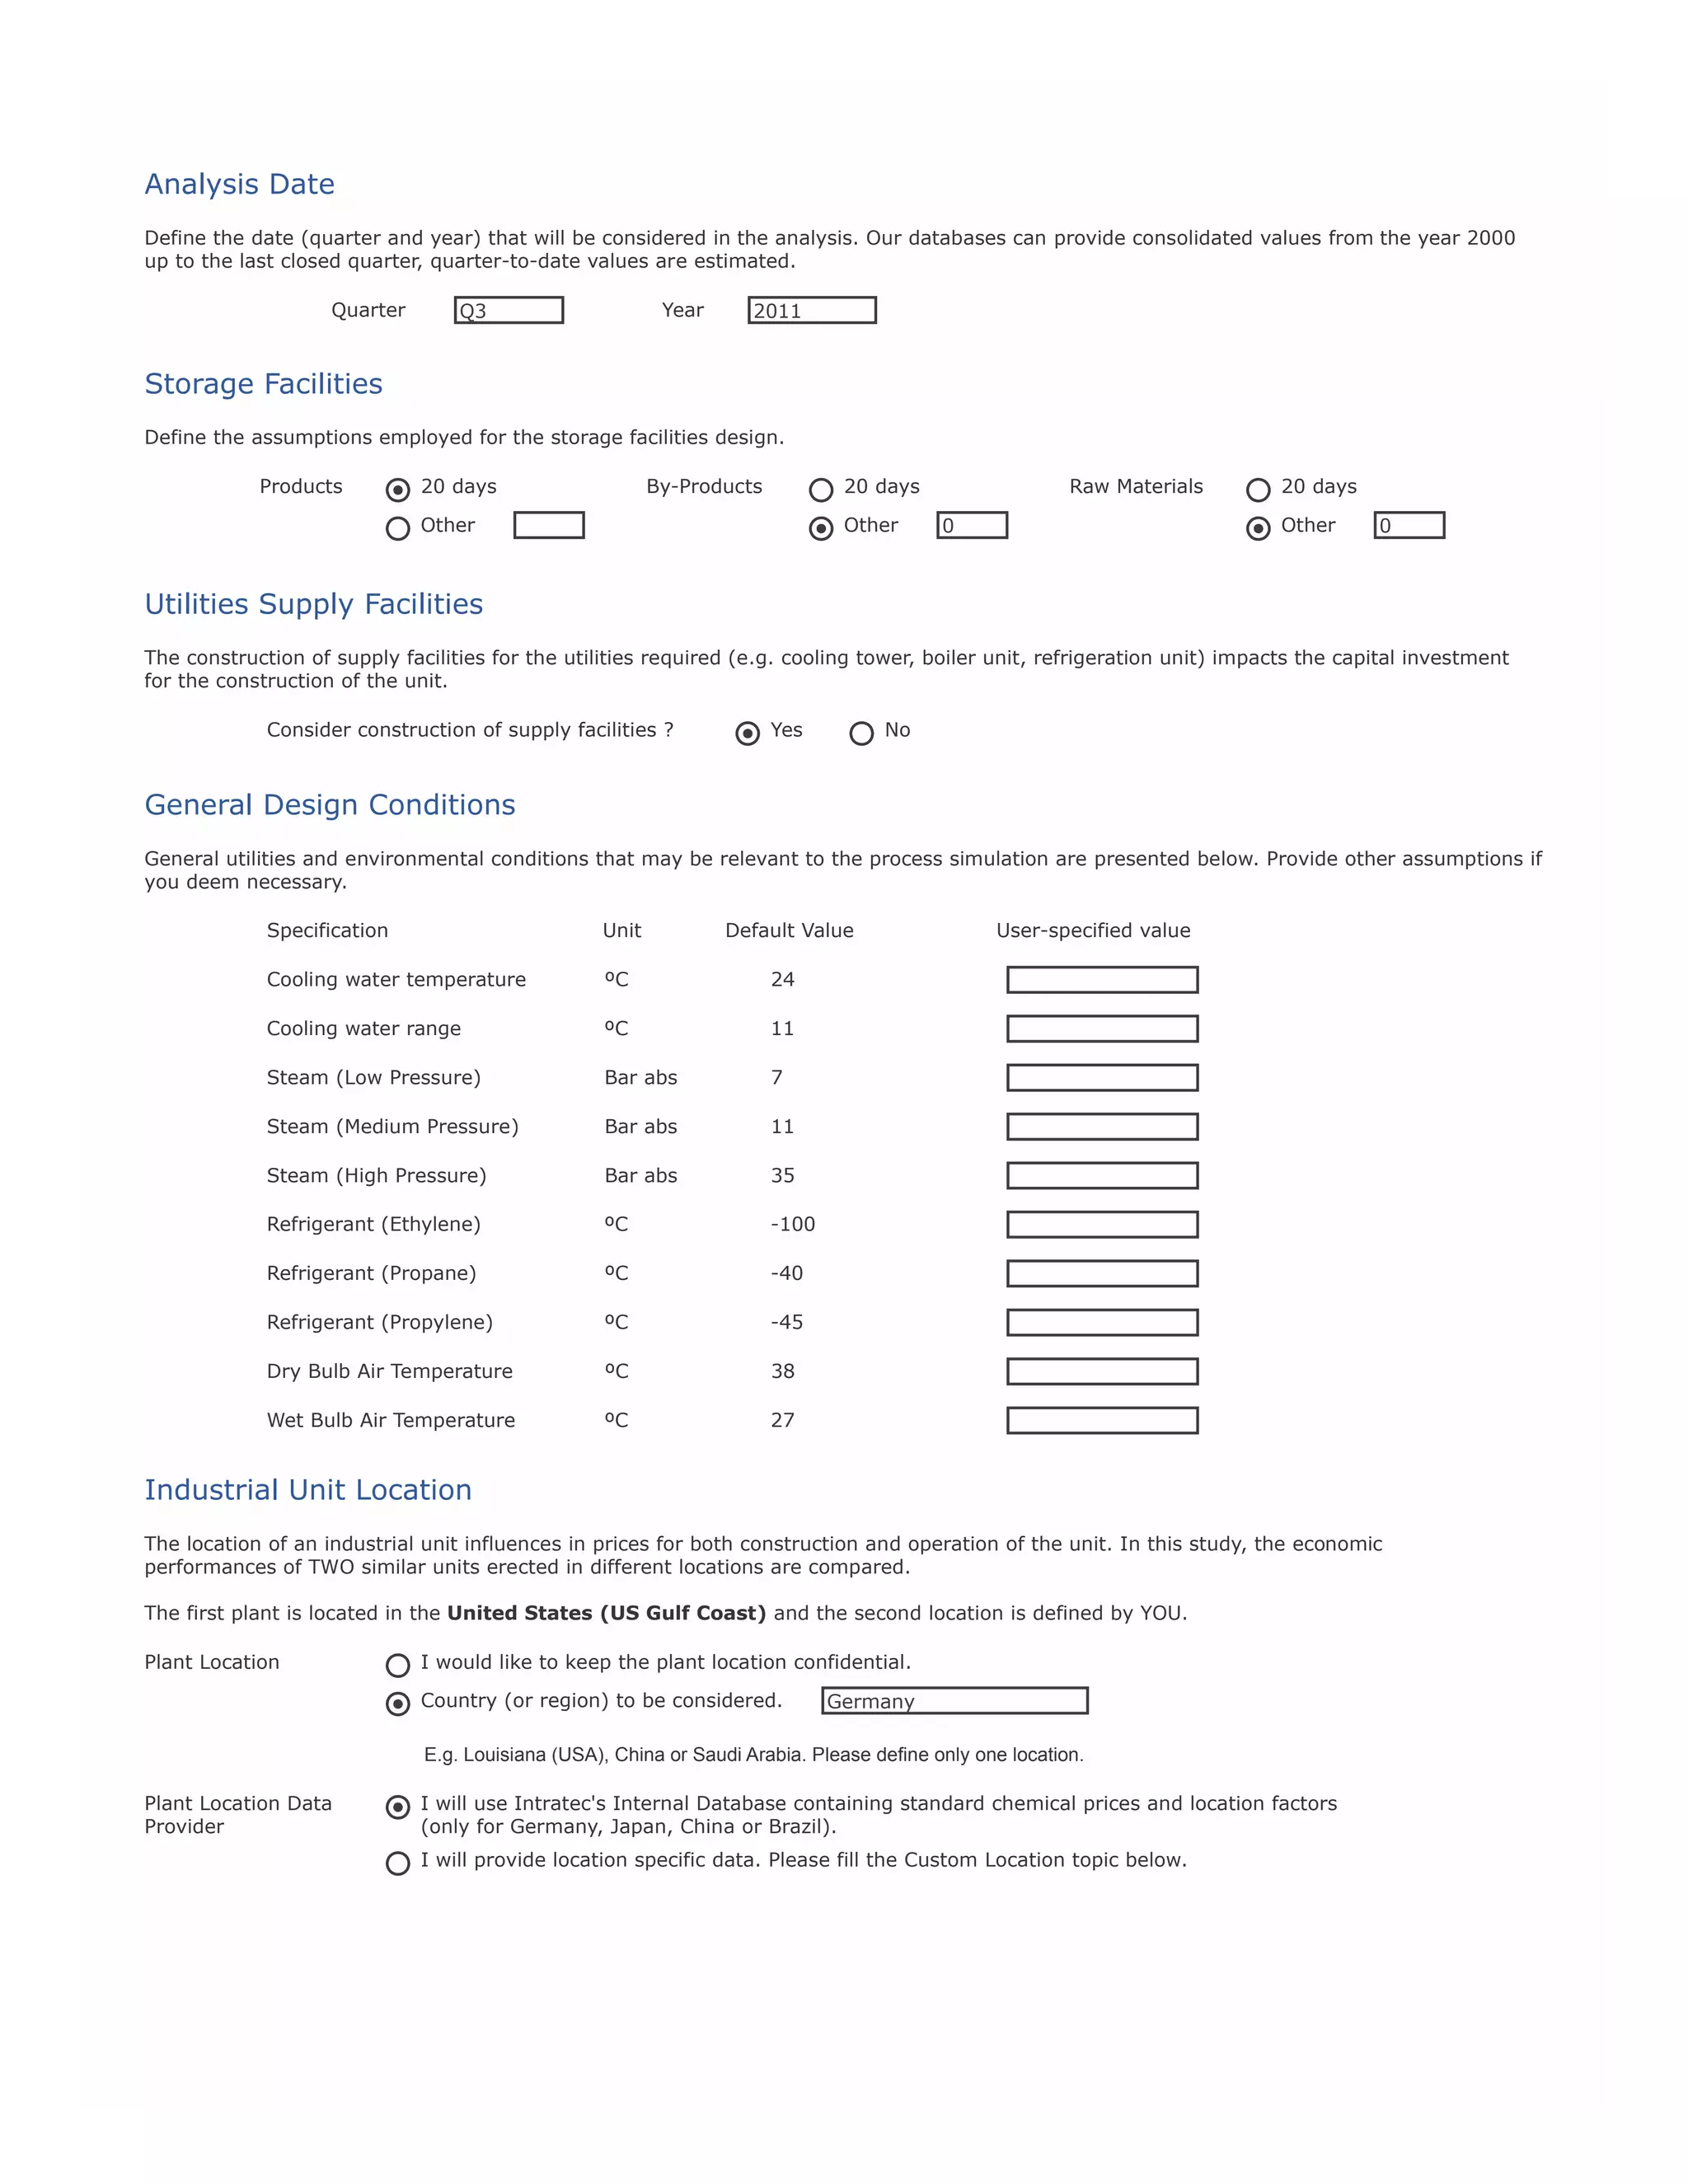


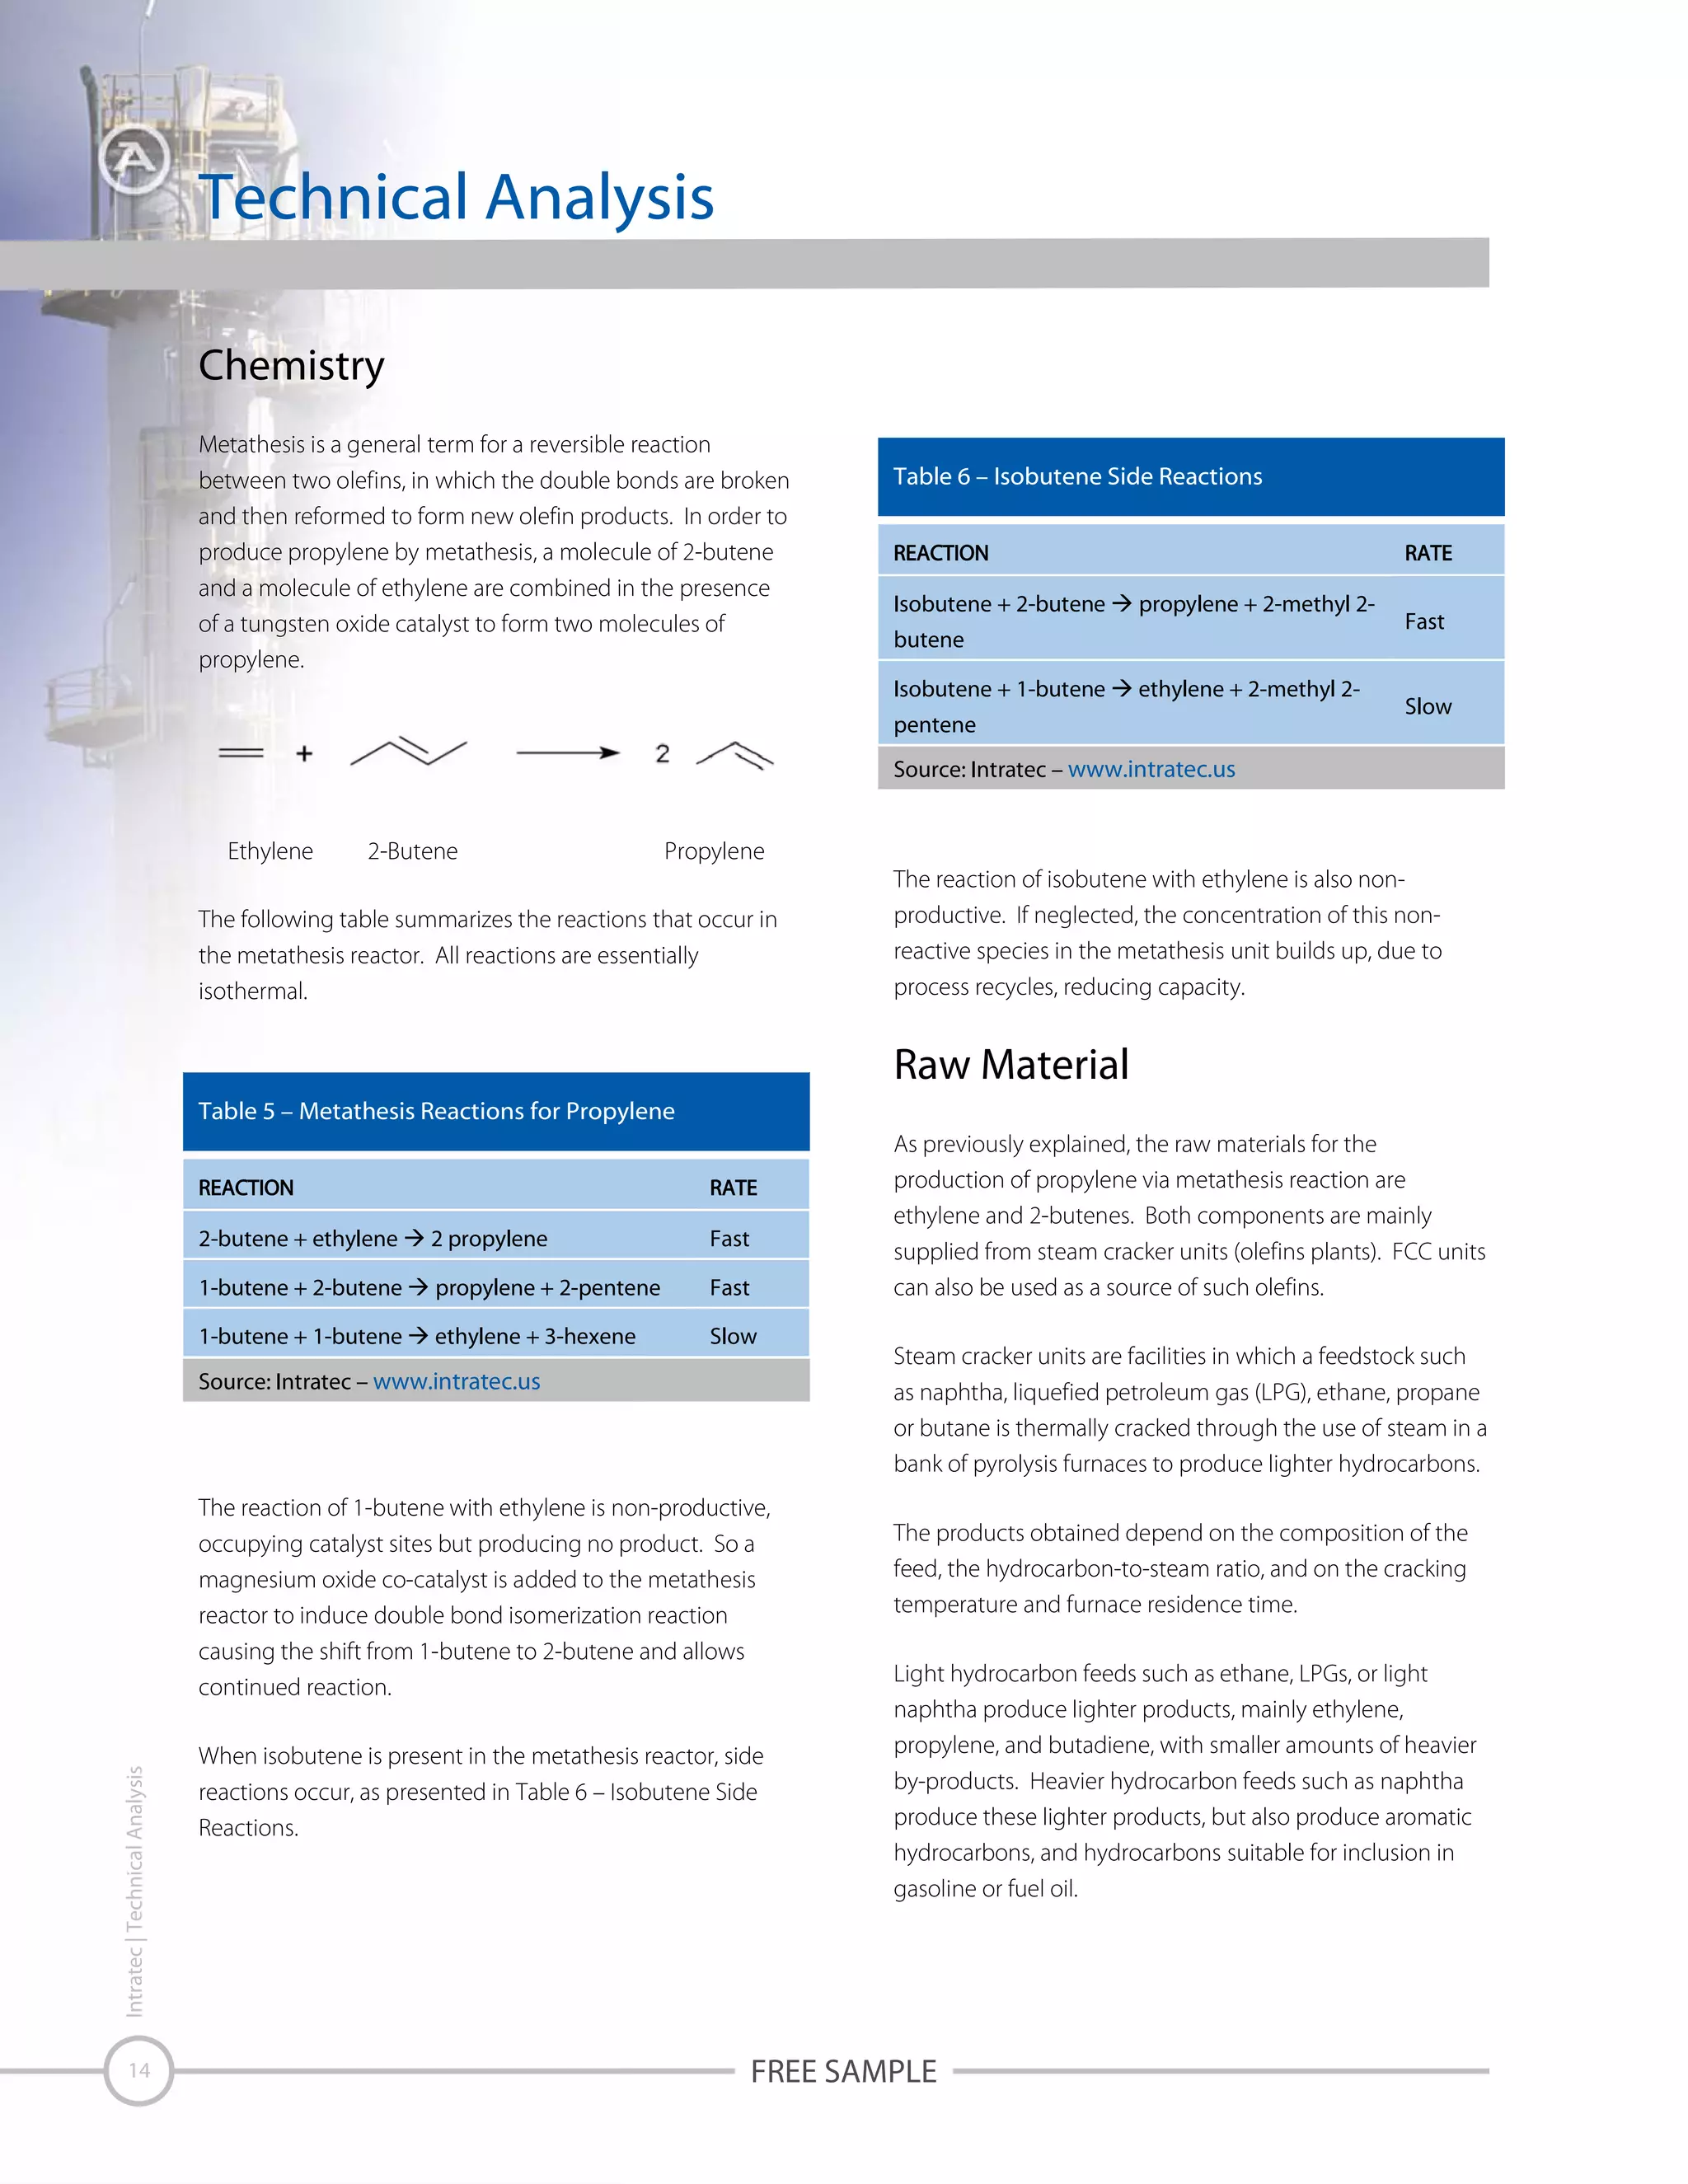
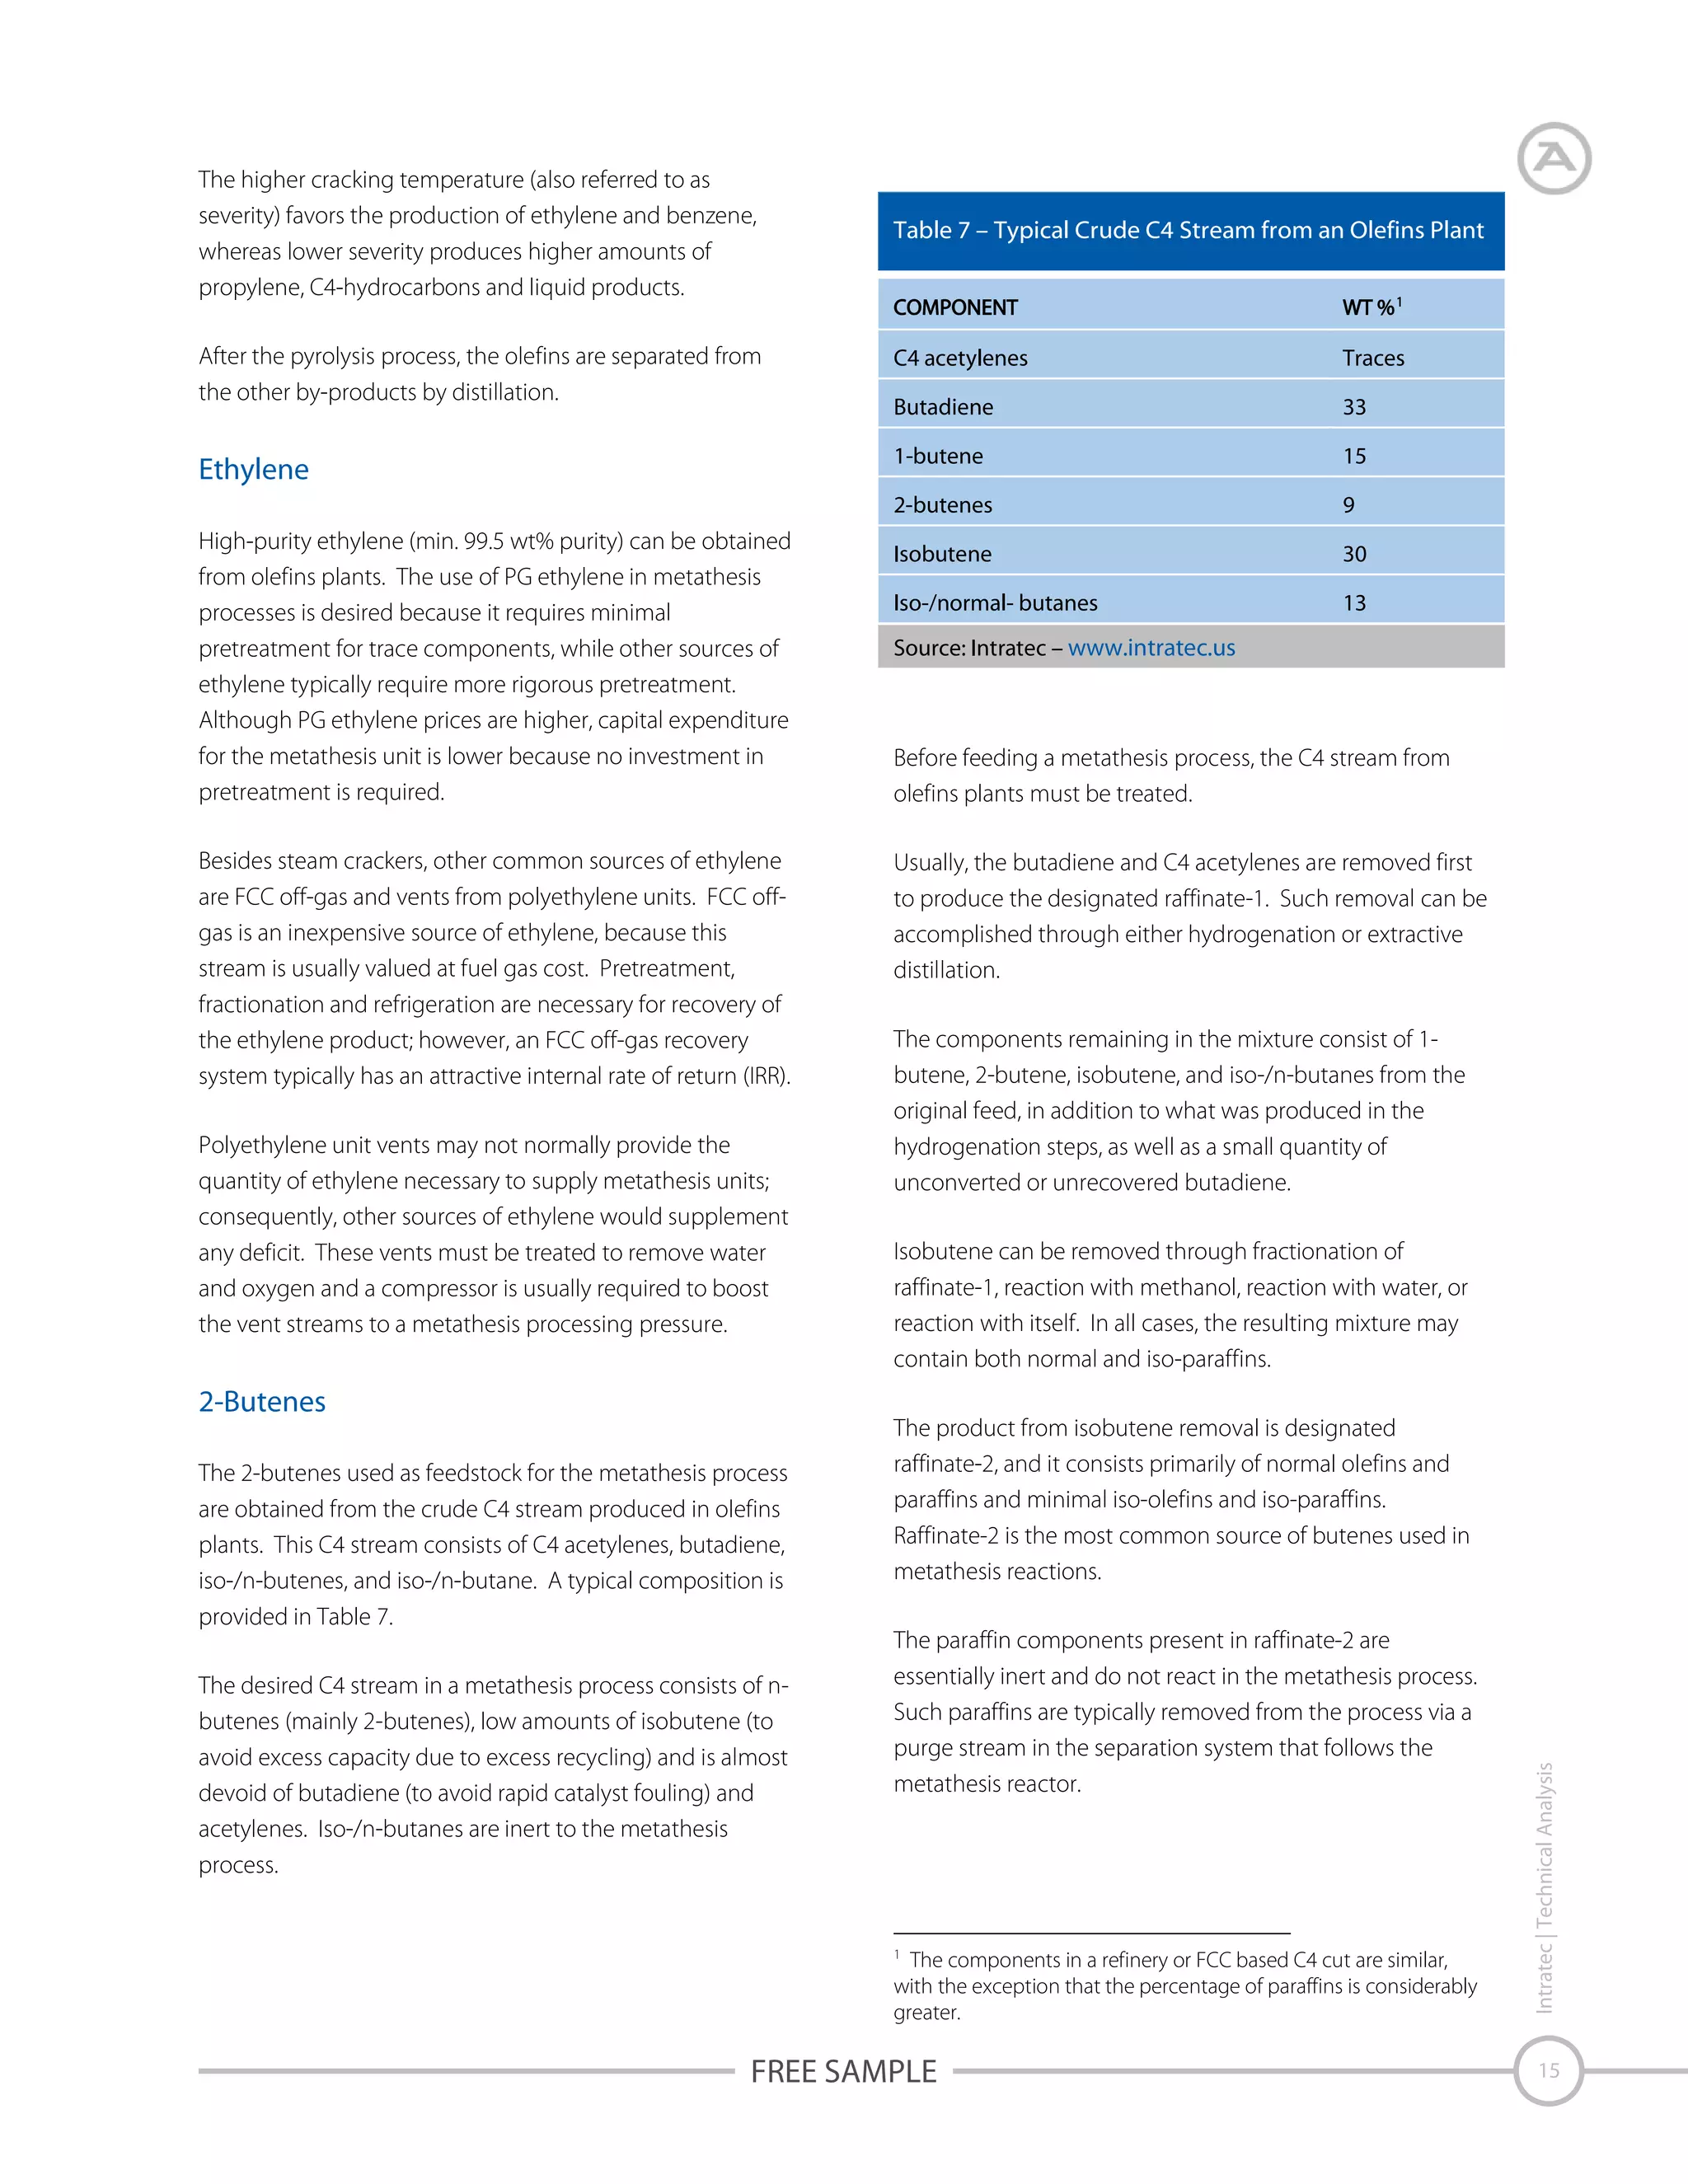
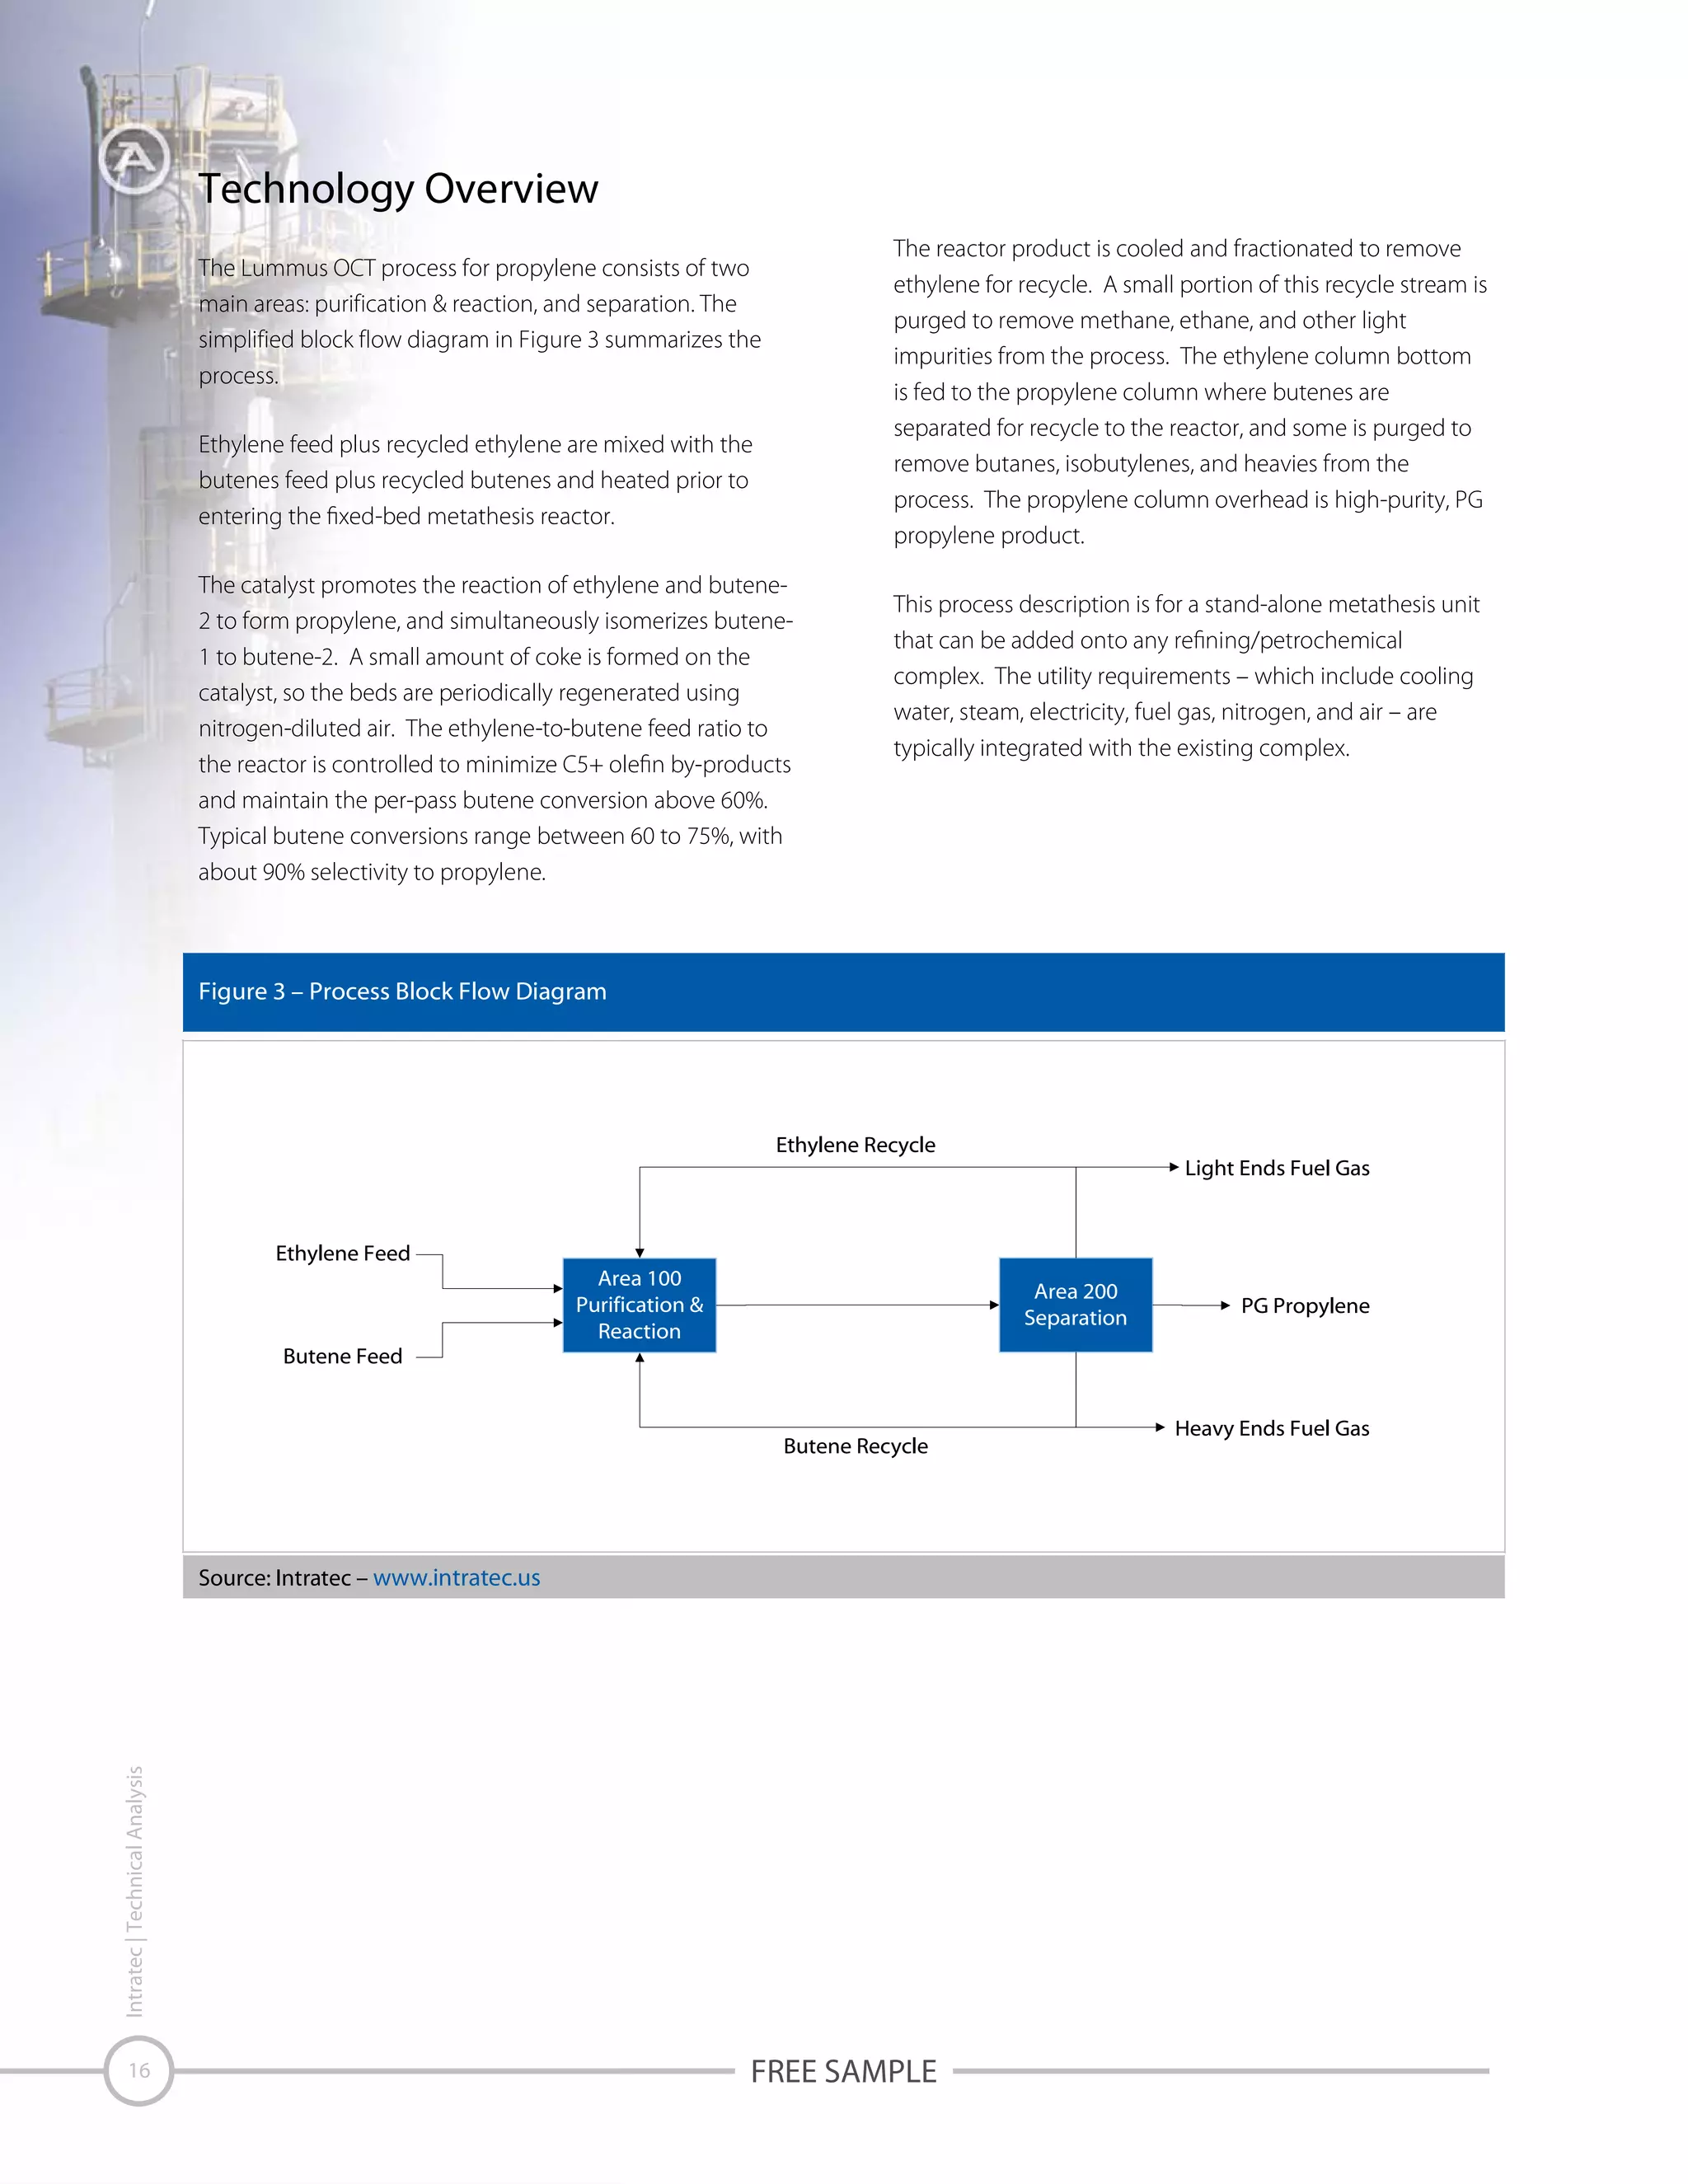
This study analyzes the production of propylene via metathesis from ethylene and butenes. It provides an overview of the metathesis technology and economics of a process similar to the CB&I Lummus OCT process. Capital and operating costs are presented for a plant constructed in the US Gulf and Germany. Alternative ways to produce propylene via butenes-only or ethylene-only metathesis are also discussed.