
Abstract
Jets provide an important channel for kinetic feedback from accreting black holes into their environment, without which models of the formation of large-scale structure in the Universe fail to reproduce the observed properties of galaxies. Hence, an accurate measurement of jet power is critical for understanding black hole growth through accretion and also for quantifying the impact of kinetic feedback. However, the absence of instantaneous jet power measurements has precluded direct comparisons with the accretion luminosity, forcing kinetic feedback models to rely on ad hoc assumptions about how much jet power is released per accreted amount of mass. Here using 18 years of high-resolution radio imaging, we report the detection of stellar wind-induced bending of the jets in the black hole X-ray binary Cygnus X-1. By modelling jet–wind interactions, we determine the current kinetic instantaneous power of the jet to be \({\log }_{10}[{L}_{{\rm{j}}{\rm{e}}{\rm{t}}}\,({{\rm{erg}}\,{\rm{s}}}^{-1})]=37.{3}_{-0.2}^{+0.1}\), comparable with the bolometric X-ray luminosity. This result critically places prevailing assumptions about the energetics of black hole-powered jets in both galaxy formation simulations and in scaling models of black hole accretion on a firm empirical footing.
Main
Understanding the impact of accreting supermassive black holes on the evolution of galaxies and cosmic structures is one of the key motivators for studying relativistic jets (for example, refs. 1,2,3). Jets are observed to drive large-scale shocks, pollute interstellar gas with magnetic fields4 and cosmic rays, generate large-scale turbulence, and evacuate large-scale cavities of gas on scales of galaxy groups and clusters5,6. A fundamental difficulty in modelling the kinetic feedback comes from the lack of an instantaneous jet power measurement, which would inform us of the fraction of the accreted energy that is converted into the kinetic energy of the jet. Hence, we have had to rely on time-averaged jet power estimates from the calorimetry of jet-inflated bubbles to constrain this feedback, which involves averaging the total kinetic power output by a jet over its lifetime, which far exceeds the variability timescale of the accretion flow. Owing to this mismatch in timescales, calorimetric measurements cannot be used to accurately calibrate the instantaneous kinetic feedback efficiency of accreting black holes, which is a key input for models of large-scale structure formation (Methods). These reasons underscore the need to develop a method that measures the instantaneous jet power of an accreting black hole.
High-mass black hole X-ray binaries provide a unique opportunity to measure the instantaneous jet power in an individual system via the theoretically predicted interactions between the stellar wind and the jets7,8,9, although these have not to date been observationally confirmed. In these systems, the black hole accretes from the strong stellar wind of its massive companion star. The jets launched by the black hole must then propagate outwards through that wind. The impact of the wind can bend the jet away from the companion star7,9, which, when combined with the orbital motion of the black hole, results in a helical jet outflow8. The overall jet trajectory is set by the relative strengths of the wind momentum flux and the momentum flux of the jet. Hence, if the wind parameters are known, instantaneous measurements of the jet power, speed, geometry and any misalignment between the jet and the binary can be made.
At a distance of 2.22 kpc (ref. 10), the high-mass black hole X-ray binary Cygnus X-1 contains a 21.2 ± 2.2 M⊙ black hole10 in a 5.6-day binary orbit11 with a supergiant companion of spectral type O and mass \(40.{6}_{-7.1}^{+7.7}\,{M}_{\odot }\) (ref. 10). The black hole accretes from the stellar wind of the donor star, whose mass-loss rate is (2.57 ± 0.05) × 10−6 M⊙ yr−1 (ref. 12). In the hard X-ray spectral state, a steady jet is launched from close to the black hole, which can be resolved by high-angular-resolution radio observations with very long baseline interferometry (VLBI)13. Early VLBI observations of Cygnus X-1 performed in the late 1990s detected only the Doppler-boosted approaching jet extending 10–15 mas away from the bright core at a position angle of approximately −26° east of north13,14. A more sensitive VLBI campaign performed in 2016 detected the corresponding Doppler-deboosted receding jet10 for the first time. The receding jet was found to share a similar position angle to the approaching jet on the plane of the sky. The small, measured eccentricity of the binary (e = 0.019 ± 0.003; ref. 10) and low space velocity with respect to its suggested birthplace in the Cygnus OB3 association15 imply a relatively small natal kick at black hole formation, such that the jet axis should be relatively well aligned with the binary orbit. However, recent works have suggested a substantial misalignment between the jet axis and the orbital angular momentum vector16,17. Moreover, the calorimetry of Cygnus X-1 (ref. 18,19,20) has been used to anchor many observationally derived black hole scaling relations (such as jet power versus radio luminosity21) across the entire mass range of black holes (using the scale-invariant nature of black holes22,23,24), thus further highlighting the need to measure the instantaneous jet power of Cygnus X-1.
The 2016 VLBI campaign undertook six 8.4-GHz observations with the Very Long Baseline Array (VLBA) and three 5-GHz observations with the European VLBI Network (EVN) to monitor the hard-state jet of Cygnus X-1 around an entire 5.6-day binary orbit. We reanalysed these data, detecting both the approaching and receding jets in each observation. Using a stack of the VLBA images, we found a brightness ratio in the range 1.5–5.5 (Methods and Extended Data Fig. 1). Stacking archival VLBA observations made in 1998 and 2009 also recovered the receding jet, at similar brightness ratios, thus showing that the jets are intrinsically two sided.
Our analysis of individual VLBA and EVN images from the 2016 campaign showed that the observed position angles of the approaching and receding jets varied with orbital phase (Fig. 1). We verified with archival data (Extended Data Table 1 and Supplementary Tables 1 and 2) that the variation in the position angle of the approaching jet was reproducible, with orbital-phase-dependent deviations from a median position angle that was constant over an 18-year period (Extended Data Figs. 2, 3 and 4). Moreover, a model-independent analysis of the jet (Methods) showed that the approaching and receding jets bend in different directions, being deflected away from the position of the donor star (Fig. 2).

a–i, Individual VLBI images (with the six 8.4-GHz VLBA observations in blue and the three 5-GHz EVN observations in purple), rotated anticlockwise by 25°, and with an asymmetric axis ratio to help visualize the jet bending. The orbit of the donor star (scaled up by a factor of 30 for the VLBA and 50 for the EVN) is shown in each image in red. The intensity of the radio jet images is shown in a logarithmic scale to visualize a wide dynamic range of emissions. The solid red circle indicates the star’s position at the midpoint of the observation. Each panel is for a different orbital phase ϕ of the observation: ϕ = 0.09 (a); ϕ = 0.27 (b); ϕ = 0.45 (c); ϕ = 0.56 (d); ϕ = 0.63 (e); ϕ = 0.75 (f); ϕ = 0.80 (g); ϕ = 0.92 (h); ϕ = 0.98 (i). j,k, The median position angle of the approaching jet (j) and receding jet (k) as measured from the core along with their 1σ errors. The bending seems to lag by quarter of an orbit, due to the finite time taken by the bent jet to travel downstream. l, The black hole orbit projected onto the plane of the sky, along with the phase coverage of each observation as shaded arcs in blue (VLBA) and purple (EVN). Their radii have been increased with time for clarity. All errors are shown at the 1σ level. PA, position angle.

a,b, VLBA images of Cygnus X-1 close to superior conjunction (a) and inferior conjunction (b), when the jets showed significant deviations from the median position angle. The grey ellipse in each image indicates the synthesized beam size. The jet brightness profile was measured along lines of constant declination spaced by 1 mas at the locations indicated by the horizontal lines for the core (dotted), approaching jet (solid) and receding jet (dashed). A linear fit to the jet ridge lines is shown in white, demonstrating that the approaching (solid) and receding (dashed) jets are not collinear. c,d, Normalized cross-correlations of the downstream jet brightness profiles indicated in a (c) and b (d), with the brightness profile at the declination of the core. The negative of the lags is shown for the receding jets (dashed curves) to aid comparison with their approaching counterparts (solid curves). As the jets are not oriented north–south, the peak cross-correlation lag increases on moving downstream. Dec., declination; RA, right ascension.
The observed difference in the position angles of the approaching and the receding jets cannot be explained by simple precession of the jet axis, which would predict that the corresponding approaching and receding jet segments are aligned. However, it naturally arises in a scenario in which the jets are bent away from the donor star by the impact of the stellar wind. As the wind density decreases with distance from the star, most of the bending should occur within about an orbital separation of the jet nozzle (~0.1 mas on the plane of the sky), so that we see only the asymptotic bending angle at VLBI scales7. This explains the relatively linear nature of the observed approaching and receding jets and indicates that the central binary system is close to where the radio emitting jets meet, at the bright core. This is in agreement with theoretical predictions of the photospheric distance of Cygnus X-125.
We, therefore, consider an analytical model of the wind-induced jet bending. The model balances the wind momentum flux with the lateral momentum flux of the jet8,26,27 and accounts for orbital motion to predict the overall helical structure of the jet (Extended Data Figs. 5 and 6). This physically motivated model also accounts for non-ballistic effects as the helical jet pushes against the wind. To infer the jet properties at launch, we fitted this analytical, numerically evaluated model8,27 to our measured jet structure (Extended Data Fig. 7). Simultaneously fitting all six VLBA epochs from 2016 gave a jet power \({\log }_{10}[{L}_{{\rm{j}}{\rm{e}}{\rm{t}}}\,\)\(({\mathrm{erg}}\,{\mathrm{s}}^{-1})]=36.{9}_{-0.5}^{+0.2}\), a jet speed at launch \(\beta =0.4{7}_{-0.05}^{+0.06}\) and a jet half-opening angle 0.8 ± 0.5° (Extended Data Table 2). The fitted trajectories for each epoch of the 2016 VLBA observations are shown in Fig. 3. Our fit provides a measurement of the instantaneous jet power in an accreting black hole together with a speed measurement for the compact jet, quantities that have previously been difficult to constrain reliably (for example, refs. 13,28,29). We note that our fit provides the same jet power for the different wind loss rates of the Cygnus X-1 donor star as those in the literature12,30,31 (Methods and Extended Data Fig. 8).

Contour plots of each image are shown. Blue and red markers denote the locations of the point source components required to model the approaching and receding jets, respectively, as determined from fitting the visibility data in the u–v plane. The errors associated with these point source components are smaller than the size of the markers. The purple dashed line shows the median trajectory from the results of fitting the physical model to the point source locations. The cyan shaded area shows a set of 200 random draws from the posterior distribution. All images have been rotated anticlockwise by 25° to align the median jet axis vertically on the figure. An asymmetric axis ratio has been used to better visualize the jet bending. The date and orbital phase of each epoch are indicated in the bottom left corner. Dist., distance.
The black hole in Cygnus X-1 was originally proposed to have formed by direct collapse15. In the absence of a supernova kick, the black hole spin axis would, therefore, be expected to be well aligned with the orbital angular momentum. However, the recent detection of high fractional X-ray polarization from the system indicates a substantial misalignment of >18° along the line of sight16. By contrast, a study of the frequency-dependent phase lags observed in orbital-phase-folded radio light curves indicated a misalignment of 20–30° in the plane of the sky17. Given these contrasting claims, we explored the impact of misalignment on the calculated jet trajectories.
In the presence of a misaligned jet, we would expect highly asymmetric non-ballistic wind–jet interactions to occur near the base of the jet. Regardless of the geometry of the misalignment, this would cause the approaching jet to propagate towards the star (where the wind is denser) at a particular orbital phase and the receding jet to do so half an orbit later. Substantial misalignment (≳10°) would then lead to strong, highly asymmetric jet bending between the approaching and receding jets due to the different non-ballistic forces imparted on them by the wind, which we do not observe (Supplementary Videos 1 and 2).
We refitted our jet trajectories with more parameters to allow for a misalignment between the jet and orbital axes and found a jet power \({\log }_{10}[{L}_{{\rm{j}}{\rm{e}}{\rm{t}}}\,({{\rm{erg}}\,{\rm{s}}}^{-1})]=37.{3}_{-0.2}^{+0.1}\), a somewhat higher jet speed \(\beta =0.6{8}_{-0.13}^{+0.08}\) and a best-fitting misalignment \(5.{2}_{-1.1}^{+1.0}\)°. However, to account for possible systematics due to averaging of the jet trajectories over a 12-h observation (Methods), we adopted a conservative 3σ upper limit of 8.2° on the misalignment between the jet and the binary.
Relaxing the requirement for the jet to be conical (that is, allowing the jet radius to scale with distance downstream as r ∝ zϵ) did not change this conclusion, as it gave consistent values for the jet power, jet speed and misalignment angle and favoured a conical jet with \(\epsilon =1.0{2}_{-0.08}^{+0.08}\). Our fitted conical jet geometry for Cygnus X-1 is in agreement with the lack of a strong re-collimation shock expected for our estimated jet power32 (Methods). The absence of substantial jet–orbit misalignment is in agreement with a lack of any observed Lense–Thirring precession of the jet, as indicated by the stable mean position angle of the jet on the plane of the sky over the 18 years of VLBI observations used here (Extended Data Fig. 4).
Such a small jet–orbit misalignment implies that alternative explanations are required for the high fractional X-ray polarization observed by the Imaging X-ray Polarimetry Explorer, such as the presence of a relativistic outflow in the corona33. The radio phase lags found by ref. 17 could be explained by the helical jet structure created by the bent jet and the orbital motion of the black hole. The low misalignment is also in agreement with the low eccentricity and peculiar velocity of the system10,15 and with theoretical expectations for the formation of such massive black holes34.
Although our jet power estimate from the three physical models (without misalignment, with misalignment, and with misalignment and a non-conical jet) are in agreement with each other at the 1σ level and are relatively insensitive to uncertainties in the mass-loss rate of the donor star wind (Methods), we favour the jet power estimate from the model that allows for both misalignment and a non-conical jet geometry, that is, \({\log }_{10}[{L}_{{\rm{j}}{\rm{e}}{\rm{t}}}\,({{\rm{e}}{\rm{r}}{\rm{g}}\,{\rm{s}}}^{-1})]=37.{3}_{-0.2}^{+0.1}\), as it makes the smallest number of assumptions. This implies that over the few million years lifetime of the black hole X-ray binary, the total kinetic feedback from the jets in Cygnus X-1 would be several times ~1050 erg, comparable with the kinetic feedback from a supernova. Our measured instantaneous jet power is in excellent agreement with the time-averaged jet power of 4–14 × 1036 ergs s−1 derived for Cygnus X-1 through calorimetry (see Methods for an extended discussion of the calorimetry) and is shown in Fig. 4. The striking similarity between the bolometric X-ray luminosity of Cygnus X-1 in the hard state35 (rescaled to an updated distance of 2.22 kpc; ref. 10) and our jet power measurement validates the commonly assumed accretion to jet energy conversion fractions assumed in typical galaxy formation simulations2,3,36,37 (Methods).
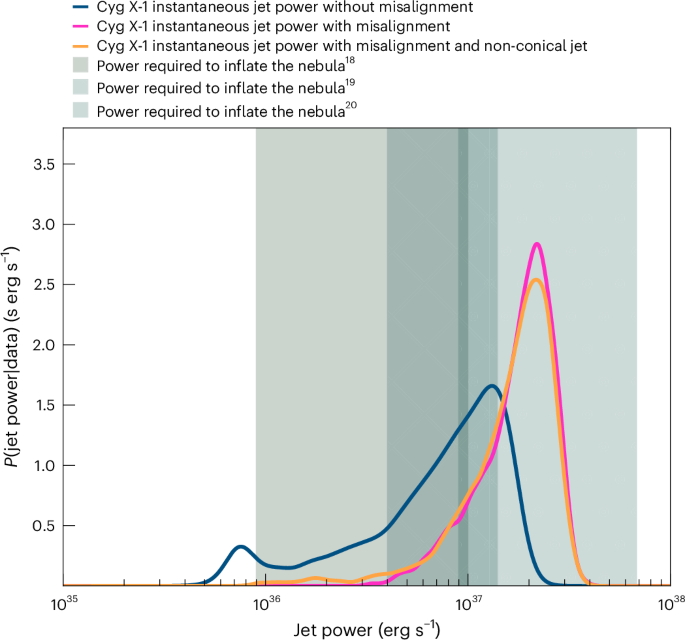
Probability density functions estimated from posterior samples for the instantaneous jet power for our three different models: model 1, with no jet–orbit misalignment and a conical jet geometry (blue); model 2, which allows for misalignment with a conical jet geometry (magenta); and model 3, which allows for both misalignment and a non-conical geometry (orange). The probability density function of the derived jet power is relatively similar across all three models, and it shows that the instantaneous jet power is consistent with the time-averaged power required to inflate the arcminute-scale radio nebula surrounding the source (shown by the grey shaded regions18,19,20).
With a robust, instantaneous measurement of the jet power in Cygnus X-1, we validated the use of calorimetry to calibrate the fraction of accretion energy converted into the kinetic energy of the jet. The close agreement between the instantaneous and time-averaged jet powers implies the long-term stability of the jets produced by radiatively inefficient accretion flows (in the hard X-ray spectral state). Although Cygnus X-1 is such a radiatively inefficient system, this validation strengthens confidence in the broader applicability of calorimetric techniques for estimating jet power in other black hole systems, including active galactic nuclei, irrespective of their specific accretion regime. On larger scales, our measurement of the instantaneous accretion to jet energy conversion fraction lends strong support for the assumed energy budget of accreting black holes in large-scale cosmological simulations.
Methods
Data reduction
The primary observations considered in this work were obtained using the VLBA and the EVN and covered a single binary orbit of Cygnus X-1 in May–June 201610. To probe the long-term evolution of the jets, we also analysed all existing archival data obtained at frequencies between 5 GHz and 8.4 GHz (in the hard state)13,14,38, which are tabulated in Extended Data Table 1.
All VLBA observations were processed using the Astronomical Image Processing System, version 31DEC2239, following the standard procedures for phase-referenced experiments (http://www.AIPS.nrao.edu/cook.html). Having performed the recommended initial calibration steps, we then exported the Cygnus X-1 data to difmap40 for further calibration (phase only followed by joint amplitude and phase self-calibration) and imaging. For the EVN observations, we followed the EVN guide (https://www.evlbi.org/evn-data-reduction-guide). We used the flagging and the delay, band-pass and a priori amplitude calibration solutions generated by the EVN pipeline, followed by global fringe fitting performed with the Astronomical Image Processing System. The Cygnus X-1 data were then exported to difmap for self-calibration and imaging as done for the VLBA data. A montage of all naturally weighted VLBA (EVN) images is shown in Extended Data Fig. 2 (3).
We then used difmap to model the jet as a series of individual components in the visibility domain (as opposed to an image-based fit), as that method is less susceptible to artefacts introduced by the incomplete sampling in the u–v plane. As we expected the core to be compact but resolved parallel to the jet (due to possible ejection of new components), we modelled it using an elliptical Gaussian. The downstream emission was unresolved in the transverse direction, and hence, we modelled it as a series of delta functions. The number of delta components was determined by the extent of the resolved jet, and we iteratively increased the number of delta components until the residual maps (an image of the difference between the modelled visibilities and the observed visibilities) showed no significant emission. The results were not highly sensitive to the precise number of components used, provided the convergence criteria for the fitting were satisfied. Having generated a preliminary model in difmap, we conducted our final model fitting using the UVMULTIFIT package41 within the Common Astronomy Software Application42 to determine the uncertainties associated with each of the fitted parameters.
Model-independent illustration of bent jets in Cygnus X-1
We selected two of our 2016 VLBA epochs taken at different points in the orbit that showed significant jet bending (Fig. 1a,c, respectively). We extracted intensity profiles at constant declination, along the core and every ±1 mas downstream (see top panels of Fig. 2). The downstream intensity profiles were cross-correlated with the intensity profile of the core, such that the lag represents the shift in right ascension of the peak intensity at the relevant declination, relative to the right ascension of the core. We show the lag measurements in the bottom panels of Fig. 2, with the lags measured along the receding jet inverted for ease of comparison. For a collinear jet (with no bending), the lags measured at equal angular separations from the core along the approaching and receding jets would be expected to be equal in magnitude, contrary to what is shown in Fig. 2. For a jet aligned purely north–south, the cross-correlation in every declination slice would peak at zero lag. For any other orientation, the cross-correlation lag would increase linearly on moving downstream. On one side of the orbit (right panels), the lags along the approaching jet are larger in amplitude compared with those measured at the same distance downstream along the receding jet. This implies that the approaching jet is rotated further clockwise on the plane of the sky than the receding jet, confirming that the jets are not collinear. On the other side of the orbit (left panels), the opposite lag behaviour is seen, demonstrating that this bending of the jets varies with orbital phase.
Physical model of the jet bending
The combination of orbital motion, stellar winds and magnetic field strengths can produce very complex jet outflow morphologies in high-mass X-ray binaries27,43. However, given that our VLBI images lack the resolution to resolve these fine-scale features, we employed a simplified analytical model that captures the average jet flow under the assumption of momentum conservation in the wind–jet interaction8,26. In the absence of observational evidence to the contrary, we did not assume a dynamically important magnetic field in our model.
Having confirmed the existence of jet bending via the model-independent cross-correlation, we modelled the observed bending by considering the momentum transferred from the wind to the jet8,26,27. In a non-rotating system, the wind would bend the jet away from the donor star, eventually reaching an asymptotic bending angle7. However, in a rotating binary system, the combination of orbital motion and radial bending would result in a helical jet outflow8,26,27.
We used a framework adapted from ref. 26 to calculate the jet bending, using a co-rotating frame, as shown in Extended Data Fig. 5. The x axis points towards the black hole, the z axis is parallel to the orbital angular momentum vector of the binary and the y axis is orthogonal to both, thus forming a Cartesian coordinate system. We define the initial momentum of the jet along the x, y and z directions as
where Ljet is the jet power, β is the jet speed at launch, Γ is the corresponding Lorentz factor and c is the speed of light. We assume an isotropic wind. The trajectory of the jet downstream is numerically calculated using the equation \({{\bf{p}}}_{i+1}={{\bf{p}}}_{i}+{{\bf{F}}}_{i}\,dt\), where the thrust imparted by the wind (\({{\bf{F}}}_{i}\)) on the jet that is transferred to the (i + 1)th jet segment is calculated using the wind density and wind velocity calculated upstream. Very close to the base of the jet, non-ballistic jet–wind interactions determine the jet structure, and further downstream, due to reduced wind density, a ballistic propagation of the jet is assumed by our model. An example jet trajectory calculated at different orbital phases is shown in Extended Data Fig. 6.
We used dynamical nested sampling44 implemented using the dynesty Python package45 to fit our model to the individual delta components from modelling the 2016 VLBA observations of Cygnus X-1. As an initial fit, denoted as model 1, we used a minimal subset of free parameters, comprising the jet speed at launch β, the jet power Ljet, the jet half-opening angle near the base ϕ1/2, the inclination angle of the jet at launch i, the donor star wind velocity vwind and the jet position angle at launch projected onto the plane of the sky. The terminal velocity of the donor star wind was expected to be within the range 1,600–2,400 km s−1 (refs. 46,47), and hence, it was left as a free parameter in our fit, with 1,600 km s−1 and 2,400 km s−1 set as the bounds. The priors and posterior distributions of the model fit are tabulated in Extended Data Table 2. We found a jet power \({\log }_{10}[{L}_{{\rm{j}}{\rm{e}}{\rm{t}}}\,({{\rm{e}}{\rm{r}}{\rm{g}}\,{\rm{s}}}^{-1})]=36.9{4}_{-0.49}^{+0.22}\), a jet launch speed \(\beta =0.4{7}_{-0.05}^{+0.06}\), a half-opening angle of the jet 0.8 ± 0.5°, a jet launch position angle of −25.0 ± 0.1° and a wind velocity of ≤1,870 km s−1.
Recent studies have raised the possibility of a misalignment between the jet and the binary orbit in Cygnus X-1, whether along the line of sight16 or in the plane of the sky17,48. A misaligned jet would result in orbital-phase-dependent asymmetric bending of the approaching and receding jet, as one of the jets would be launched towards the star and undergo significantly greater bending due to a strong non-ballistic interaction with the denser wind. Hence, we modified our physical model to evaluate the possibility of a misalignment by using two more parameters to describe the initial orientation of the jet at launch, namely the misalignment angle θ and the binary orbital phase az when the misaligned jet points along the line joining the star and the black hole. For an az value of 0 (or 0.5), the jets would be pointed towards (away from) the star at both superior and inferior conjunction (a misalignment along the line of sight direction), and for a value of az = 0.25 (or 0.75), the jets would be pointed towards (away from) the star at quadrature phases (a misalignment in the plane of the sky).
Furthermore, as the jet is evaluated in a co-rotating frame, in the presence of a misalignment, each downstream segment would have been launched at a different orbital phase, resulting in different initial jet momenta along the x and y directions (in the case of no misalignment, the initial momenta of all downstream jet segments are zero along the x and the y directions). Hence, in our numerical model, each downstream jet segment was mapped to the orbital phase at which it was launched, which in turn determined the initial momentum of the jet segment along the (x, y, z) directions. For an assumed jet segment length dl, an orbital period T0 and a jet speed β, then each downstream jet segment (indexed as n = 0, 1, 2, 3, …, where n is the segment number with n = 0 being the segment right next to the black hole) would have been launched at an earlier orbital phase n × Δϕ, where Δϕ = dl/(βT0). This offset in phase was then used to determine the initial momentum of the jet segment at launch. If the black hole is, at present, at an orbital phase ϕ0, then the initial jet momentum for the nth downstream segment in the co-rotating frame is given by
where ϕ = 2π(ϕ0 − nΔϕ + az), and ϕ0 is the binary phase of the epoch being considered. Animations of jet trajectories for a misaligned jet are provided in Supplementary Information. Fitting this misaligned jet model (denoted as model 2) to the data points from the 2016 VLBA observations, we found a comparable jet power \({\log }_{10}[{L}_{{\rm{j}}{\rm{e}}{\rm{t}}}\,{(\mathrm{erg}}\,{\mathrm{s}}^{-1})]\)\(=37.{28}_{-0.23}^{+0.13}\), a jet speed at launch \(\beta =0.6{8}_{-0.11}^{+0.07}\), a half-opening angle of 1.8° ± 0.7°, a misalignment of \(5.{2}_{-1.1}^{+1.0}\)° with a phase of \(az=0.3{4}_{-0.02}^{+0.03}\) (approximately halfway between an orientation along the line of sight and in the plane of the sky) and a wind velocity of ≤1,980 km s−1. The adopted priors and resulting posteriors are tabulated as model 2 in Extended Data Table 2. We also note that model 2 finds a mean jet position angle of \(-27.{8}_{-0.4}^{+0.5}\)°. We expect this to be the position angle of the jet at launch, and when combined with the asymmetric jet bending from the 5.2° jet–orbit misalignment, results in the apparent large-scale VLBA jet appearing to precess about a mean position angle of −25°, in agreement with the value from the scenario with no misalignment considered in model 1.
Our final model (model 3) incorporated non-conical jet geometries into model 2. We allowed the jet cross section to scale with distance downstream as r ∝ zϵ and fitted for the parameter ϵ (where ϵ = 1 for a conical jet). The fitting found the jet power to be consistent with values from the previous models, and ϵ = 1.0 ± 0.1, which is consistent with a conical geometry within uncertainties. The fitting parameters are tabulated as model 3 in Extended Data Table 2. The median and 200 random draws from the posterior distributions from models 1, 2 and 3 are shown overlaid on top of the six VLBA images from 2016 in the top, middle and bottom rows of Extended Data Fig. 7.
Misalignment
The presence of a small but non-zero misalignment of \(5.{2}_{-1.1}^{+1.0}\)° is consistent with the maximum plausible misalignment of ~10° inferred from the ratio of the kick velocity of the system and its pre-supernova orbital velocity10. The small but non-zero binary eccentricity and space velocity would also be consistent with a small but non-zero misalignment. However, we note the 12-h duration of the individual VLBA epochs, which would have averaged the jet trace over a non-negligible fraction of the 5.6-day binary orbit, could have affected the observed trajectories of our VLBI images. We, therefore, retain a degree of caution in interpreting the misalignment fit and prefer to draw a more conservative conclusion, ruling out misalignments >8°. This is far smaller than the 20–30° misalignments inferred by refs. 16,17, and in agreement with the stable mean position angle of the jet observed during the 18 years of archival data (Extended Data Fig. 4).
Re-collimation shocks
For sufficiently low jet power (below a critical value) in high-mass X-ray binaries, a lateral re-collimation shock is expected to be driven into the jet by the wind32, resulting in non-conical jet geometry. For a given mass-loss rate \({\dot{M}}_{{\rm{w}}}\), wind velocity vw and jet velocity vj of the donor star, the critical power is given by \({P}_{{\rm{c}}{\rm{r}}}={\dot{M}}_{w}{v}_{{\rm{w}}}{v}_{{\rm{j}}}/16\) (ref. 32). Using the binary parameters adopted in this paper, we found the critical jet power to be (2.5–5.9) × 1037 erg s−1, comparable with our estimate of instantaneous jet power. Thus, our determined conical jet (lack of a strong re-collimation shock) from model 3 is in perfect agreement with theoretical expectations.
Brightness and spectral index of the jet
The brightness ratio of the approaching and receding jets, combined with the spectral index, constrains the intrinsic jet speed49,50. From the VLBA and EVN montage (Extended Data Figs. 2 and 3), we note that the receding jet was detected only in epochs with noise levels below 0.3 mJy per beam. To accurately measure the brightness ratio and confirm that the non-detection of the receding jet is due solely to noise, we created stacked images using temporally close observations with similar set-ups (for example, bandwidth). After correcting for parallax and orbital and proper motion shifts (to align the centroid of the individual images), we produced three stacks: one from 1998 (BS060AX, BS060BX and BS060CX), one from 2009 (BR141A, BR141B, BR141C and BR141D), and one from 2016 (BM429B–BM429G), shown in Extended Data Fig. 1 (left panels). Stacking revealed the receding jet in epochs where it was previously undetected.
With the receding jet confirmed as a persistent feature over ~2 decades, we measured the brightness ratio in the three stacked images (1998, 2009 and 2016). We extracted spatially resolved intensity profiles every 0.5 mas along both jets—approximately half the restoring beam size—and fitted one-dimensional Gaussians to these profiles. The measured intensities and brightness ratio are presented in the right and bottom panels of Extended Data Fig. 1. Although stacking substantially improved the signal-to-noise ratio, which allowed the previously undetectable counter-jet to be recovered in several epochs, the flux densities of the downstream emission may still be slightly affected by the differences in orbital-phase-dependent bending across the individual epochs. To mitigate this, we adopted a conservative range 1.5–5.5 for the brightness ratio, which we used to constrain the jet speed in section ‘Hard-state jet speed of Cygnus X-1’. We note, however, that the jet speed derived from our physically motivated model is our primary jet speed measurement, and we used the brightness-ratio-based estimate only as a consistency check.
During the 2016 VLBI observations, which monitored a full binary orbit (May–June 2016), the Karl G. Jansky Very Large Array (VLA) simultaneously observed Cygnus X-1 under programme VLA/15B-236. We reduced the data following the VLA guide published by the National Radio Astronomy Observatory (https://casaguides.nrao.edu/index.php/VLA_Continuum_Tutorial_3C391-CASA5.4.0). The spectral index (defined as Sν ∝ να, where Sν is the flux density measured at a given frequency ν), derived from flux densities at 5.25 GHz and 7.45 GHz for each epoch, is listed in Supplementary Table 1. As the spectral index varies with orbital phase due to changes in path length through the stellar wind, we used the measurement closest to inferior conjunction (1 June 2016) as indicative of the intrinsic spectral index of the jet.
Hard-state jet speed of Cygnus X-1
The brightness ratio of intrinsically symmetric jets at equal angular separations from the core constrains the product \(\beta \,\cos \,i\), where β is the jet speed and i is the inclination of the system49,50. For a continuous jet, as seen in Cygnus X-1, the jet speed depends on the measured brightness ratio (Sratio):
where α is the spectral index (Sν ∝ να). Given the binary inclination of 27.5° ± 5° (ref. 10) and accounting for a possible misalignment <8°, we used a brightness ratio of 1.5–5.5 and a spectral index of 0.055 ± 0.016 to constrain the hard-state jet speed from the brightness ratio to be β = 0.27–0.46 (68% high-density interval).
Irrespective of the model used, we found the hard-state jet speed of Cygnus X-1 to be only mildly relativistic, with β < 0.76 within the 68% credible intervals. The physically motivated model found a jet speed of \(\beta =0.4{7}_{-0.05}^{+0.06}\) for a jet aligned with the binary (model 1), and \(\beta =0.6{8}_{-0.13}^{+0.08}\) in the presence of a misalignment (model 2). A rerun of the radio timing study presented in ref. 29, incorporating updated constraints on the photosphere distance17, found β = 0.42–0.64 (68% high-density interval), providing further confidence in the speeds obtained from our physical model.
The jet speed determined from the brightness ratios is in marginally better agreement with the fitting results from physical model 1 than from models 2 and 3. This could be taken to favour an aligned jet in Cygnus X-1, but uncertainties associated with the brightness-ratio measurement (such as image-based convolution effects in the VLBI images, physical effects such as mass loading or a radio emission contribution from a slower jet sheath where much of the wind–jet interaction occurs) limits its discriminative power. However, such topics remain beyond the scope of the current paper and are impossible to probe observationally with the current data.
Regardless of the presence or absence of a misalignment in Cygnus X-1, based on our physical modelling, we found the jet speed to lie in the range β = 0.42–0.76. A more precise determination of the jet speed in Cygnus X-1 would require higher-precision measurements of the jet trajectory, on both smaller and larger angular scales.
Measurements and applications of jet power
Measurements of jet power are key input for theories of accretion as well as models of galaxy formation and evolution, as both require knowledge of the partitioning of accretion energy between advection, radiation, and jet and kinetic power. However, due to the featureless non-thermal synchrotron spectra, direct measurements of jet power from observations of jets are difficult. Neither the jet velocity nor composition can be determined directly from observations of the synchrotron emission alone, and jet power estimates therefore rely on ad hoc assumptions about the composition and the equipartition fraction of the plasma, as well as the bulk Lorentz factor. These assumptions introduce uncertainties of at least an order of magnitude.
Observational constraints on the time-averaged jet power can be derived by modelling the interactions between the jets and the surrounding interstellar medium51,52.
The gold standard for measuring jet power to date relies on calorimetric methods, whereby the interaction of jets with some known target material is used to determine the average jet power (for example, refs. 51,52). The most common method uses observations of jet-inflated cavities in galaxies, groups and clusters of galaxies6 (this method was also used when deriving the jet power required to inflate the nebula observed around Cygnus X-118). These estimates have been used to derive scaling relations between the radiative and the kinetic power of large samples of jets53,54.
Because these relations rely on measurements of the kinetic power averaged over the dynamical timescale of the cavity, they introduce large uncertainties when used to estimate instantaneous jet powers, given the generally rapid variability in accretion and, therefore, jet power inferred by observations of X-ray binaries, blazars and nearby jets.
Because of these large uncertainties, numerical models of structure formation generally leave the jet power as a free parameter \({\eta }_{{\rm{j}}{\rm{e}}{\rm{t}}}={P}_{{\rm{j}}{\rm{e}}{\rm{t}}}/\dot{M}{c}^{2}\approx 0.1\) (refs. 3,36,37,55,56,57) that is then tuned so that the simulations reproduce the observed properties of galaxies. Although this assumption appears reasonable (given its order-of-magnitude agreement with the maximum radiative luminosity achievable for radiatively efficient accretion58), it could be substantially strengthened by direct observational verification of the value of ηjet, which underscores the importance of the measurement of the instantaneous jet power of Cygnus X-1 presented here, which is broadly consistent with the findings of the aggregate jet power needed in cosmological simulations.
Calorimetry of Cygnus X-1
Of the four calorimetric studies of Cygnus X-1 in the literature18,19,20,59, the average jet power measurement in the most recent study using MeerKAT data59 differs by over an order of magnitude. We attribute this discrepancy to the difference in shock velocities considered in the different studies. The MeerKAT study considers a wide range of shock velocities between 21 km s−1 and 364 km s−1 using constraints from the observed radio emission and upper limits from a lack of observed X-ray emission. Reference 19 further rules out shock velocities <100 km s−1 using the ratios of the observed O [iii] and Hα emission lines. Using constraints from radio, upper limits from X-ray and a series of optical emission lines, ref. 20 places a very tight constraint on the shock velocity to \(22{0}_{-30}^{+50}\) km s−1. As the jet power in calorimetric models scales as the third power of the shock velocity, we attribute the large discrepancy between ref. 59 and the other studies to be due to their consideration of very small shock velocities. Owing to this reason, the average jet power estimates from ref. 59 are not discussed in the main text.
Donor star mass-loss rate
Recent results30,31 have suggested a higher uncertainty in the donor star mass-loss rate than inferred from the originally accepted value12. We, therefore, tested the sensitivity of our results to the assumed wind mass-loss rate of the donor star by rerunning our model 1 fit for mass-loss rates in the range 0.5–7 × 10⁻⁶ M⊙ yr−1 (refs. 30,31). As shown in Extended Data Fig. 8, we found that only the jet half-opening angle varies significantly to match the momentum rate of the wind, with the fitted opening angle increasing at lower mass-loss rates and decreasing at higher rates. This demonstrates that our inferred jet power is relatively insensitive to the assumed wind mass-loss rate from the donor star.
Jet composition of Cygnus X-1
Our physical model of the jet bending makes no assumptions about the jet composition but rather infers the jet power from the jet momentum, which is set by the relative balance between the jet momentum and the wind momentum required to produce the observed jet bending. However, we found a leptonic jet to be highly unlikely in Cygnus X-1 due to the large number of pairs required to match the mass flux of the hadronic jet. Moreover, for a high-mass X-ray binary, a leptonic jet at the base becomes mass-loaded by the wind and becomes baryon-dominated on the observed VLBI scales.
Wind clumping
Although the degree of wind clumping in Cygnus X-1 has not been quantitatively constrained in the literature, we discuss its potential implications for our jet power estimate. A clumpy wind could lead to an overestimation of the average wind density, which implies that the true wind momentum flux may be lower than assumed in this study. Consequently, a smaller jet momentum would be required to reproduce the observed bending angles. Such a reduction in jet momentum could be achieved either by a lower jet power or by a higher jet velocity (equation (3)). Conversely, ref. 60 suggests that wind clumping can enhance jet instabilities and potentially disrupt the flow near its base, although the jet may subsequently re-collimate further downstream, a scenario that cannot be ruled out for Cygnus X-1. Nevertheless, given the small observed bending angle, such effects from dense wind clumping are unlikely to play a dominant role in this system.
Data availability
All data used in this paper are publicly available in the VLBA and EVN archives. The observation epochs and project IDs are provided in Extended Data Table 1. The final reduced data products are available upon request.
Code availability
The code used to fit the jet model in the paper is available via GitHub at https://github.com/BHXRBs/Cygnus-X-1-Jet-bending and via Zenodo at https://doi.org/10.5281/zenodo.18390870 (ref. 61).
References
Krause, M. G. H. Jet feedback in star-forming galaxies. Galaxies 11, 29 (2023).
Croton, D. J. et al. The many lives of active galactic nuclei: cooling flows, black holes and the luminosities and colours of galaxies. Mon. Not. R. Astron. Soc. 365, 11–28 (2006).
Weinberger, R. et al. Simulating galaxy formation with black hole driven thermal and kinetic feedback. Mon. Not. R. Astron. Soc. 465, 3291–3308 (2017).
Heinz, S., Grimm, H. J., Sunyaev, R. A. & Fender, R. P. Blazing trails: microquasars as head-tail sources and the seeding of magnetized plasma into the ISM. Astrophys. J. 686, 1145–1154 (2008).
Fabian, A. C. et al. Chandra imaging of the complex X-ray core of the Perseus cluster. Mon. Not. R. Astron. Soc. 318, L65–L68 (2000).
McNamara, B. R. & Nulsen, P. E. J. Heating hot atmospheres with active galactic nuclei. Annu. Rev. Astron. Astrophys. 45, 117–175 (2007).
Yoon, D. & Heinz, S. Global simulations of the interaction of microquasar jets with a stellar wind in high-mass X-ray binaries. Astrophys. J. 801, 55 (2015).
Bosch-Ramon, V. & Barkov, M. The effects of the stellar wind and orbital motion on the jets of high-mass microquasars. Astron. Astrophys. 590, A119 (2016).
Perucho, M. & Bosch-Ramon, V. On the interaction of microquasar jets with stellar winds. Astron. Astrophys. 482, 917–927 (2008).
Miller-Jones, J. C. A. et al. Cygnus X-1 contains a 21-solar mass black hole—implications for massive star winds. Science 371, 1046–1049 (2021).
Brocksopp, C., Tarasov, A. E., Lyuty, V. M. & Roche, P. An improved orbital ephemeris for Cygnus X-1. Astron. Astrophys. 343, 861–864 (1999).
Gies, D. R. et al. Wind accretion and state transitions in Cygnus X-1. Astrophys. J. 583, 424–436 (2003).
Stirling, A. M. et al. A relativistic jet from Cygnus X-1 in the low/hard X-ray state. Mon. Not. R. Astron. Soc. 327, 1273–1278 (2001).
Reid, M. J. et al. The trigonometric parallax of Cygnus X-1. Astrophys. J. 742, 83 (2011).
Mirabel, I. F. & Rodrigues, I. Formation of a black hole in the dark. Science 300, 1119–1121 (2003).
Krawczynski, H. et al. Polarized X-rays constrain the disk-jet geometry in the black hole X-ray binary Cygnus X-1. Science 378, 650–654 (2022).
Zdziarski, A. A. et al. Evidence for a black hole spin-orbit misalignment in the X-ray binary Cyg X-1. Astrophys. J. 951, L45 (2023).
Gallo, E. et al. A dark jet dominates the power output of the stellar black hole Cygnus X-1. Nature 436, 819–821 (2005).
Russell, D., Fender, R., Gallo, E. & Kaiser, C. The jet-powered optical nebula of Cygnus X-1. Mon. Not. R. Astron. Soc. 376, 1341–1349 (2007).
Sell, P. H. et al. Shell-shocked: the interstellar medium near Cygnus X-1. Mon. Not. R. Astron. Soc. 446, 3579–3592 (2015).
Heinz, S. & Grimm, H. J. Estimating the kinetic luminosity function of jets from galactic X-ray binaries. Astrophys. J. 633, 384–391 (2005).
Heinz, S. & Sunyaev, R. A. The non-linear dependence of flux on black hole mass and accretion rate in core-dominated jets. Mon. Not. R. Astron. Soc. 343, L59–L64 (2003).
Merloni, A., Heinz, S. & di Matteo, T. A fundamental plane of black hole activity. Mon. Not. R. Astron. Soc. 345, 1057–1076 (2003).
Falcke, H., Körding, E. & Markoff, S. A scheme to unify low-power accreting black holes. Jet-dominated accretion flows and the radio/X-ray correlation. Astron. Astrophys. 414, 895–903 (2004).
Zdziarski, A. A. The structure of the jet in Cyg X-1 inferred from orbital modulation of the radio emission. Mon. Not. R. Astron. Soc. 422, 1750–1760 (2012).
Molina, E. & Bosch-Ramon, V. Nonthermal emission from high-mass microquasar jets affected by orbital motion. Astron. Astrophys. 618, A146 (2018).
Barkov, M. V. & Bosch-Ramon, V. Relativistic hydrodynamical simulations of the effects of the stellar wind and the orbit on high-mass microquasar jets. Mon. Not. R. Astron. Soc. 510, 3479–3494 (2022).
Casella, P. et al. Fast infrared variability from a relativistic jet in GX 339-4. Mon. Not. R. Astron. Soc. 404, L21–L25 (2010).
Tetarenko, A. J. et al. Radio frequency timing analysis of the compact jet in the black hole X-ray binary Cygnus X-1. Mon. Not. R. Astron. Soc. 484, 2987–3003 (2019).
Lai, E. V. et al. Characterisation of the stellar wind in Cyg X-1 via modelling of colour–colour diagrams. Astron. Astrophys. 691, A78 (2024).
Ramachandran, V. et al. Comprehensive UV and optical spectral analysis of Cygnus X-1: stellar and wind parameters, abundances, and evolutionary implications. Astron. Astrophys. 698, A37 (2025).
Yoon, D., Zdziarski, A. A. & Heinz, S. Formation of recollimation shocks in jets of high-mass X-ray binaries. Mon. Not. R. Astron. Soc. 456, 3638–3644 (2016).
Poutanen, J., Veledina, A. & Beloborodov, A. M. Polarized X-rays from windy accretion in Cygnus X-1. Astrophys. J. 949, L10 (2023).
Fryer, C. L. et al. Compact remnant mass function: dependence on the explosion mechanism and metallicity. Astrophys. J. 749, 91 (2012).
Wilms, J., Nowak, M. A., Pottschmidt, K., Pooley, G. G. & Fritz, S. Long term variability of Cygnus X-1. IV. Spectral evolution 1999–2004. Astron. Astrophys. 447, 245–261 (2006).
Pillepich, A. et al. Simulating galaxy formation with the IllustrisTNG model. Mon. Not. R. Astron. Soc. 473, 4077–4106 (2018).
Davé, R. et al. SIMBA: Cosmological simulations with black hole growth and feedback. Mon. Not. R. Astron. Soc. 486, 2827–2849 (2019).
Rushton, A. et al. A weak compact jet in a soft state of Cygnus X-1. Mon. Not. R. Astron. Soc. 419, 3194–3199 (2012).
Greisen, E. W. in Information Handling in Astronomy—Historical Vistas, 109–125 (Springer Netherlands, 2003).
Shepherd, M. C. in Astronomical Data Analysis Software and Systems VI, Vol. 125 (eds Hunt, G. & Payne, H.) 77 (ASP, 1997).
Martí-Vidal, I., Vlemmings, W. H. T., Muller, S. & Casey, S. UVMULTIFIT: a versatile tool for fitting astronomical radio interferometric data. Astron. Astrophys. 563, A136 (2014).
CASA Team et al. CASA, the common astronomy software applications for radio astronomy. Pub. Astron. Soc. Pac. 134, 114501 (2022).
López-Miralles, J., Perucho, M., Martí, J. M., Migliari, S. & Bosch-Ramon, V. 3D RMHD simulations of jet–wind interactions in high-mass X-ray binaries. Astron. Astrophys. 661, A117 (2022).
Skilling, J. Nested sampling for general Bayesian computation. Bayesian Anal. 1, 833–859 (2006).
Speagle, J. S. DYNESTY: a dynamic nested sampling package for estimating Bayesian posteriors and evidences. Mon. Not. R. Astron. Soc. 493, 3132–3158 (2020).
Gies, D. R. et al. Stellar wind variations during the X-ray high and low states of Cygnus X-1. Astrophys. J. 678, 1237–1247 (2008).
Grinberg, V. et al. Long term variability of Cygnus X-1. VII. Orbital variability of the focussed wind in Cyg X-1/HDE 226868 system. Astron. Astrophys. 576, A117 (2015).
Zdziarski, A. A. et al. Black hole spin measurements in LMC X-1 and Cyg X-1 are highly model dependent. Astrophys. J. 962, 101 (2024).
Ryle, M. & Longair, M. S. A possible method for investigating the evolution of radio galaxies. Mon. Not. R. Astron. Soc. 136, 123 (1967).
Scheuer, P. A. G. & Readhead, A. C. S. Superluminally expanding radio sources and the radio-quiet QSOs. Nature 277, 182–185 (1979).
Tetarenko, A. J., Freeman, P., Rosolowsky, E. W., Miller-Jones, J. C. A. & Sivakoff, G. R. Mapping jet-ISM interactions in X-ray binaries with ALMA: a GRS 1915+105 case study. Mon. Not. R. Astron. Soc. 475, 448–468 (2018).
Tetarenko, A. J., Rosolowsky, E. W., Miller-Jones, J. C. A. & Sivakoff, G. R. Jet-ISM interactions near the microquasars GRS 1758-258 and 1E 1740.7-2942. Mon. Not. R. Astron. Soc. 497, 3504–3524 (2020).
Bîrzan, L., McNamara, B. R., Nulsen, P. E. J., Carilli, C. L. & Wise, M. W. Radiative efficiency and content of extragalactic radio sources: toward a universal scaling relation between jet power and radio power. Astrophys. J. 686, 859 (2008).
Cavagnolo, K. W. et al. A relationship between AGN jet power and radio power. Astrophys. J. 720, 1066–1072 (2010).
Byrne, L. et al. Effects of multichannel active galactic nuclei feedback in FIRE cosmological simulations of massive galaxies. Astrophys. J. 973, 149 (2024).
Ni, Y. et al. The Astrid simulation: evolution of black holes and galaxies to z = 0.5 and different evolution pathways for galaxy quenching. Astrophys. J. 990, 120 (2025).
Huško, F., Lacey, C. G., Schaye, J., Nobels, F. S. J. & Schaller, M. Winds versus jets: a comparison between black hole feedback modes in simulations of idealized galaxy groups and clusters. Mon. Not. R. Astron. Soc. 527, 5988–6020 (2024).
Novikov, I. D. & Thorne, K. S. in Black Holes. Les Astres Occlus (eds DeWitt, C. & Dewitt, B. S.) 343–450 (Gordon and Breach Science Publishers, 1973).
Atri, P. et al. Quantifying jet–interstellar medium interactions in Cyg X-1: insights from dual-frequency bow shock detection with MeerKAT. Astron. Astrophys. 696, A223 (2025).
Perucho, M. & Bosch-Ramon, V. 3D simulations of microquasar jets in clumpy stellar winds. Astron. Astrophys. 539, A57 (2012).
Prabu, S. R., Miller-Jones, J. & Bahramian, A. A jet bent by a stellar wind in the black hole X-ray binary Cygnus X-1: jet model and final data products. Zenodo https://doi.org/10.5281/zenodo.18390870 (2026).
Acknowledgements
We thank D. Russell, A. Ingram and C. Done for discussions. The National Radio Astronomy Observatory is a facility of the National Science Foundation operated under cooperative agreement by Associated Universities, Inc. This work made use of the Swinburne University of Technology software correlator, developed as part of the Australian Major National Research Facilities Programme and operated under licence. The EVN is a joint facility of independent European, African, Asian and North American radio astronomy institutes. Scientific results from data presented in this publication are derived from the following EVN project codes: RT013. This work was supported by resources provided by the Pawsey Supercomputing Research Centre with funding from the Australian Government and the Government of Western Australia. S.P. acknowledges Breakthrough Listen (funded by the Breakthrough Prize foundation) for their Breakthrough Listen fellowship. V.B.-R. acknowledges financial support from the Spanish Ministry of Science and Innovation (Grant No. PID2022-136828NB-C41/AEI/10.13039/501100011033/ERDF/EU) and the María de Maeztu award to the ICCUB CEX2024-001451-M and from the Generalitat de Catalunya (Grant No. 2021SGR00679). V.B.-R. is the correspondent researcher of CONICET, Argentina, at the IAR. C.M.W. and T.N.O.D. acknowledge financial support from the Forrest Research Foundation Scholarship and the Australian Government Research Training Program Scholarship. C.M.W. also acknowledges financial support from the Jean-Pierre Macquart Scholarship. A.J.T. acknowledges that this research was undertaken thanks to funding from the Canada Research Chairs Program and the support of the Natural Sciences and Engineering Research Council of Canada (Funding Reference No. RGPIN-2024-04458). V.T. acknowledges support from the Romanian Ministry of Research, Innovation and Digitalization through the Romanian National Core Program LAPLAS VII (Contract No. 30N/2023). S.H. acknowledges grant support through NSF award AST-0908690.
Author information
Authors and Affiliations
Contributions
S.P. analysed all the archival VLBA and EVN observations of Cygnus X-1. S.P. and J.C.A.M.-J. independently confirmed the observed bending in the 2016 VLBA dataset through independent data reduction of the same observations. J.C.A.M.-J., S.P. and A.B. led the development of the paper. A.B. developed the lag correlation analysis that demonstrated the jet bending using a model-independent technique. S.P. and A.B. developed all the Markov chain Monte Carlo models used in this work. V.B.-R. led the development of the physical model to describe the jet bending, which was further modified by S.P. and J.C.A.M.-J. to incorporate spin–orbit misalignment. S.H. led the discussions on the implications of the instantaneous jet power measurement and the scaling relation between radio luminosity and jet power. S.P., J.C.A.M.-J., S.J.T. and C.M.W. led the model fitting analysis of the VLBI data using difmap and UVMULTIFIT. A.J.T. performed the radio timing analysis described in Methods. T.N.O.D. performed the VLA data processing. V.T. designed the EVN observation campaign. All authors provided input and comments on the paper.
Corresponding authors
Ethics declarations
Competing interests
The authors declare no competing interests.
Peer review
Peer review information
Nature Astronomy thanks the anonymous reviewers for their contribution to the peer review of this work. Peer reviewer reports are available.
Additional information
Publisher’s note Springer Nature remains neutral with regard to jurisdictional claims in published maps and institutional affiliations.
Extended data
Extended Data Fig. 1 Stacked VLBA images of Cygnus X-1 from different epochs.
(a) shows a stack of three observations from 1998 (BS060[A-C]X). (c) shows a stack of four observations from 2009 (BR141[A-D]). (e) shows a stack of six observations from 2016 (BM429[B-G]). The corresponding intensity profiles along the approaching and receding jets for the stacked images are provided in (b), (d), and (f), respectively. (g) shows the corresponding measurements/limits on the brightness ratio at equal angular separation from the core for each stacked image. All error bars are shown in the 1 sigma level. We find the brightness ratio to vary both by epoch and with distance from the core, ranging from 1.5-5.5. Upon verification with RXTE-ASM and MAXI archival data, it was noted that these observations where performed in the hard state, consistent with our detection of extended jets.
Extended Data Fig. 2 A montage of all 8.4-GHz VLBA observations, sorted by orbital phase.
The contours are drawn at \(\sigma \times \sqrt{{2}^{n}}\), where n = 3,4,5,… and σ is the image noise, as tabulated in Supplementary Table 2. The red ellipse shows the orbit of the donor star as seen by the black hole, scaled up by a factor of 30 for visualisation purposes. The solid red circle shows the star’s location at the mid-point of the observation. The grey ellipse in the bottom right of each panel shows the size of the restoring beam. The images have been rotated by 25∘ counter clockwise.
Extended Data Fig. 3 A montage of the three 5-GHz EVN observations used in this work, sorted by orbital phase.
The contours are drawn at \(\sigma \times \sqrt{{2}^{n}}\), where n = 3,4,5,…and σ is the image noise, as tabulated in Supplementary Table 2. The red ellipse shows the orbit of the donor star as seen by the black hole, scaled up by a factor of 50 for visualisation purposes. The solid red circle shows the star’s location at the mid-point of the observation. The grey ellipse in the bottom right of each panel shows the size of the restoring beam. The images have been rotated by 25∘ counter clockwise.
Extended Data Fig. 4 Position angles of jet components along the approaching jet as a function of both orbital phase and time, for all our VLBI observations from 1998–2016.
Panel (a) shows all the archival observations as a function of orbital phase, and Panel (b) shows the data as a function of time. All errors are shown at the 1σ level.
Extended Data Fig. 5 Diagram showing the non-inertial co-rotating frame used in the physical model.
In the above figure, Ψ is the bending angle of the jet. The misalignment angle θ is measured clockwise in the z-x plane (in the same plane as the bending angle), with a positive angle denoting the jet pointed away from the star. For θ = 0 the jet would be launched along the z-axis.
Extended Data Fig. 6 The jet trajectory calculated using momentum transfer between the jet and the wind.
We show here the trajectories for orbital phases (a) 0.00, (b) 0.25, (c) 0.50, and (d) 0.75, and provide an animation of the full orbit as a supplementary video 3. The reference frame is inertial and is centered on the donor star indicated by the red dot. The location of the black hole is indicated by the black circle. For calculating the jet trajectory, we assume a jet power of 5 × 1035 erg s−1, a jet launch speed of β = 0.9, a conical jet with half opening angle of 1∘, and no misalignment between the initial jet launch direction and the binary orbit. Note that we purposefully assume a less powerful jet for better visualisation of the bent helical jet trajectory. The momentum imparted to the jet by the wind is shown parallel and perpendicular to the orbital angular momentum vector (and also the jet axis at launch) using cyan and purple arrows, respectively. An animated version of this figure can be found in Supplementary Video 3.
Extended Data Fig. 7 Fitted model trajectories for each of the VLBA observations in 2016, using the three different physical models considered in this paper.
Panel (a) shows Model 1, with a conical jet and no misalignment. Panel (b) shows Model 2, with a conical jet and misalignment. Panel (c) shows Model 3, with misalignment and a non-conical jet. As in Fig. 3, the image from each epoch is shown with a contour plot, and the blue (red) markers show the location of the fitted point source components along the approaching (receding) jet. The dashed line shows the median fit trajectory and the cyan lines represent 200 random draws from the posterior distribution of the fit. All images have been rotated by 25∘ counterclockwise.
Extended Data Fig. 8 Histogram of model-fit traces for the different mass-loss rates.
Panels (a)-(f) show the histogram of the different fit parameters in Model 1 for different mass-loss rate.
Supplementary information
Supplementary Information (download PDF )
Supplementary Tables 1 and 2 and discussion.
Supplementary Video 1 (download MP4 )
Animation showing the predicted trajectory of the Cygnus X-1 jet as viewed by an observer in the binary plane, for various misalignment angles along the line of sight. The red circle represents the star, and the black circle represents the black hole.
Supplementary Video 2 (download MP4 )
Animation showing the predicted trajectory of the Cygnus X-1 jet as viewed by an observer in the binary plane, for various misalignment angles along the plane of the sky. The red circle represents the star, and the black circle represents the black hole.
Supplementary Video 3 (download MP4 )
Animation shows the jet trajectory calculated using momentum transfer between the jet and the wind at different orbital phases. This is an animation of Extended Data Fig. 6.
Rights and permissions
Open Access This article is licensed under a Creative Commons Attribution 4.0 International License, which permits use, sharing, adaptation, distribution and reproduction in any medium or format, as long as you give appropriate credit to the original author(s) and the source, provide a link to the Creative Commons licence, and indicate if changes were made. The images or other third party material in this article are included in the article’s Creative Commons licence, unless indicated otherwise in a credit line to the material. If material is not included in the article’s Creative Commons licence and your intended use is not permitted by statutory regulation or exceeds the permitted use, you will need to obtain permission directly from the copyright holder. To view a copy of this licence, visit http://creativecommons.org/licenses/by/4.0/.
About this article
Cite this article
Prabu, S., Miller-Jones, J.C.A., Bahramian, A. et al. A jet bent by a stellar wind in the black hole X-ray binary Cygnus X-1. Nat Astron 10, 1039–1048 (2026). https://doi.org/10.1038/s41550-026-02828-3
Received:
Accepted:
Published:
Version of record:
Issue date:
DOI: https://doi.org/10.1038/s41550-026-02828-3
