
Monitoring a Linux system means checking how well your computer’s hardware and software are working. It helps track performance, find resource-heavy processes, and detect issues early.
- Knowing your CPU, memory (RAM), disks, and running processes.
- Watching these resources in real-time.
- Understanding hardware configuration and operating environment.
Checking System Information
System information commands give details about your computer’s setup, including the operating system, kernel version, and hardware components. This information is useful for troubleshooting, system audits, and preparing for software installations.
Example 1. Displays system information in a tidy format, including OS name, kernel version, and virtualization details.
Command:
hostnamectl
Output:
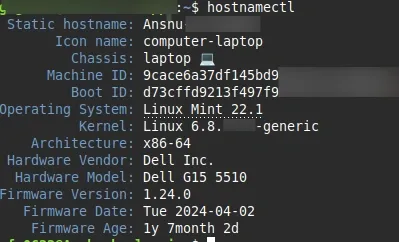
What it does:
- Shows system identity in a tidy block: static/transient hostname, machine ID, chassis, OS, kernel, and virtualization info.
- Helpful to confirm distro name/version and whether you are inside a VM or container.
Example 2. Lists CPU information such as model name, number of cores, and threads.
Command:
lscpu
Output:
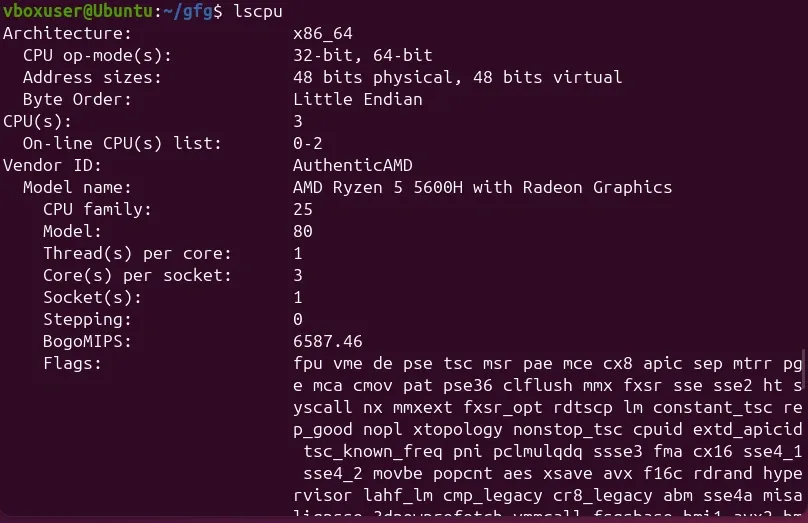
What it does:
- Summarizes CPU topology and features: model name, sockets, cores, threads per core, and flags like SSE/AVX.
- Use it to estimate parallel capacity (cores/threads) and verify virtualization or special instruction support.
Example 3. Displays details about disks, partitions, and mount points in a clear table.
Command:
lsblk
Output:
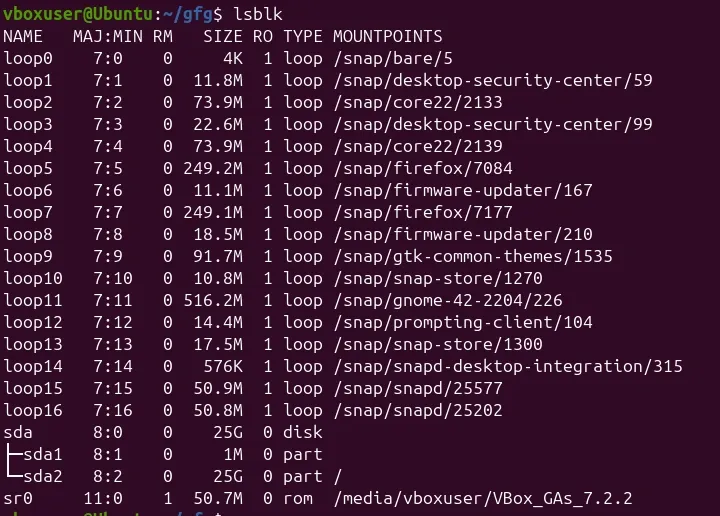
What it does:
- Lists block devices as a clear tree: disks, partitions, LVM layers, sizes, and mountpoints.
- Add options like --fs or -o NAME,SIZE,TYPE,MOUNTPOINT to see filesystem types and where devices are mounted.
Example 4. Shows memory usage (RAM and swap) in human-readable units.
Command:
free -h
Reports RAM and swap usage with human-readable units, including total, used, free, and available memory.
Example 6. Tells you how much disk space is used and available on each mounted filesystem.
Command:
df -h
Output:
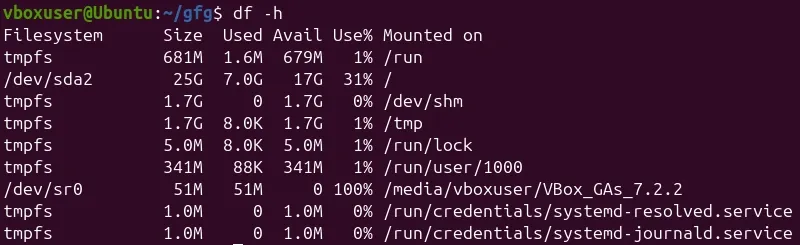
What it does:
- Shows disk space used/available per mounted filesystem in human units, plus mountpoints.
- Scan Use% to spot nearly full volumes; combine with -T to view filesystem types for context.
Monitoring System Performance in Real-Time
Performance monitoring shows how your system resources (CPU, memory, disk, network) are being used right now. It's handy for detecting lag, load, or bottlenecks.
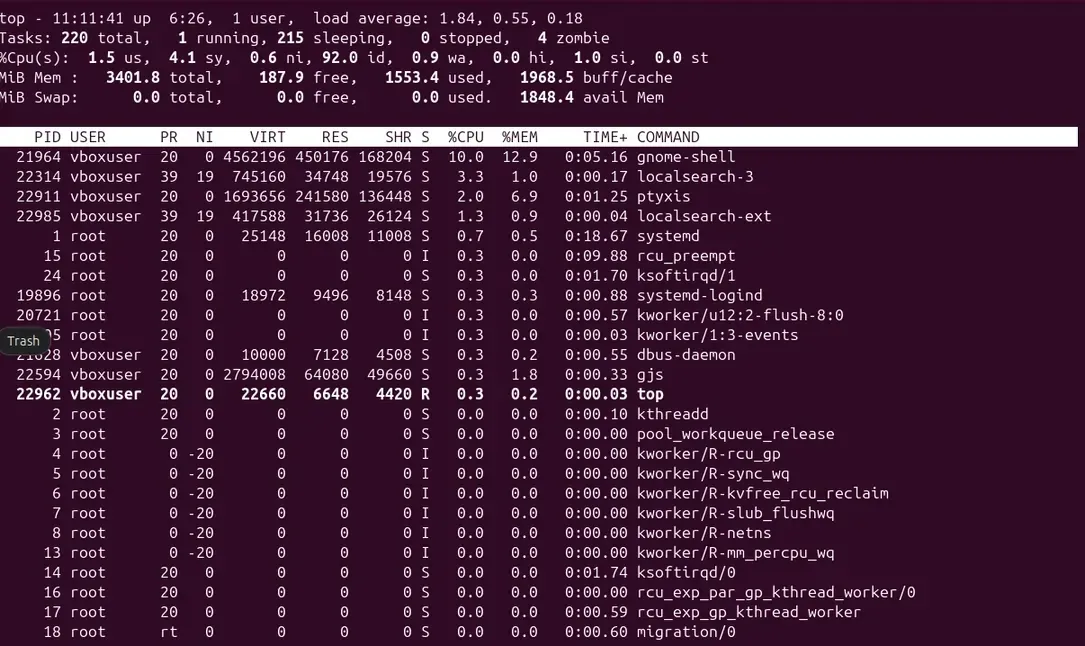
Example 1. Shows live CPU and memory usage by processes, refreshing automatically.
Command:
top
Output:
What it does:
- Live, updating process viewer with CPU/memory usage, load averages, and per-process stats.
- Sort by CPU or MEM to find heavy processes; use interactive keys (e.g., shift+P/M) to change sort.
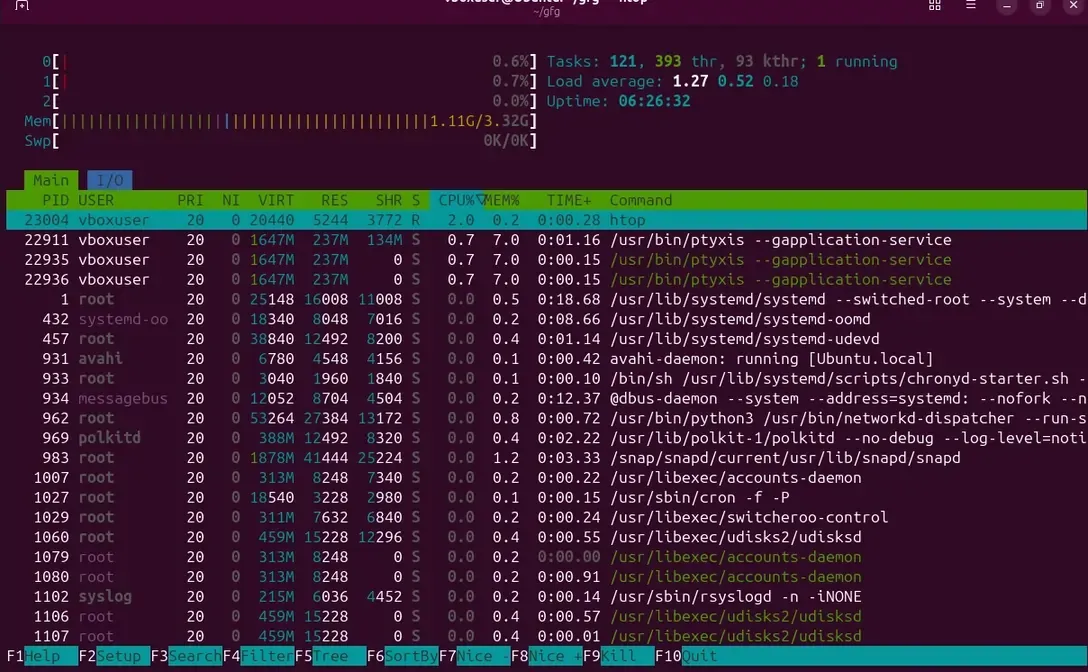
Example 2. A more colorful, user-friendly version of top where you can scroll and sort easily.
Command:
htop
Output:
What it does:
- Colorful, interactive top alternative with scrolling, tree view, and easy sorting/filtering.
- Great for quickly killing processes and viewing per-core usage; may require installation.
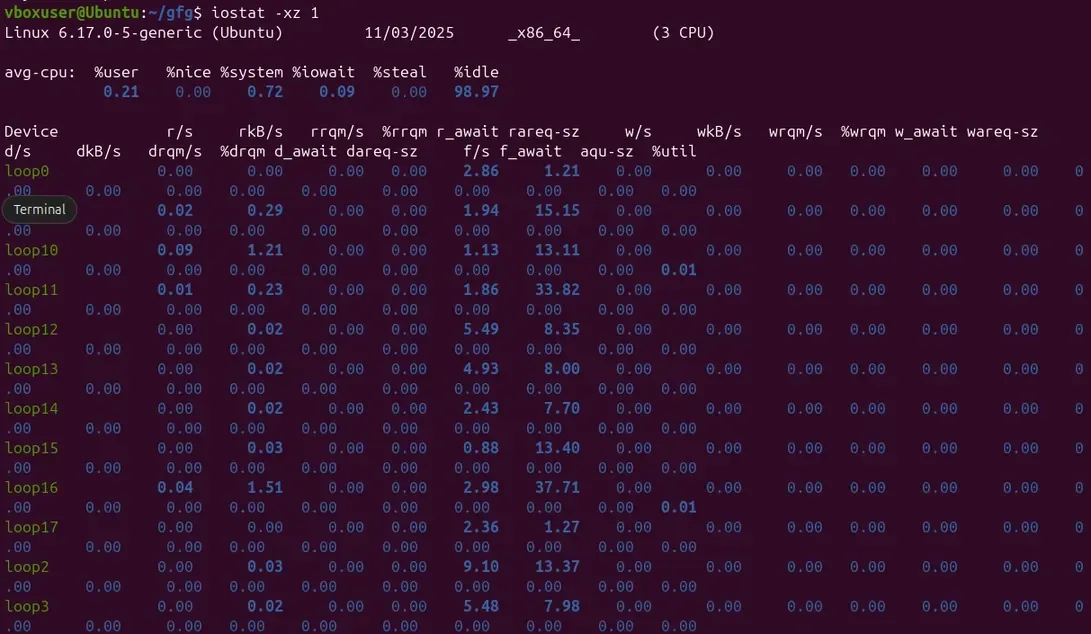
Example 3. Shows how busy your disks are and if any are overloaded.
Command:
iostat -xz 1
Output:
What it does:
- Provides per-disk utilization, throughput, and latency; -x adds extended stats, -z omits idle devices, 1 sets 1s refresh.
- High %util or avgqu-sz with rising await indicates saturated or overloaded disks.
Example 4. Displays real-time network usage in which connections are sending or receiving the most data.
Command:
iftop
Output:

What it does:
- Real-time, per-connection bandwidth monitor showing who is sending/receiving the most data.
- Use it to catch noisy hosts and confirm whether a network spike is local or remote.
Checking Hardware and Devices
Sometimes, issues come from hardware rather than software. These commands help you find what’s actually installed and working.
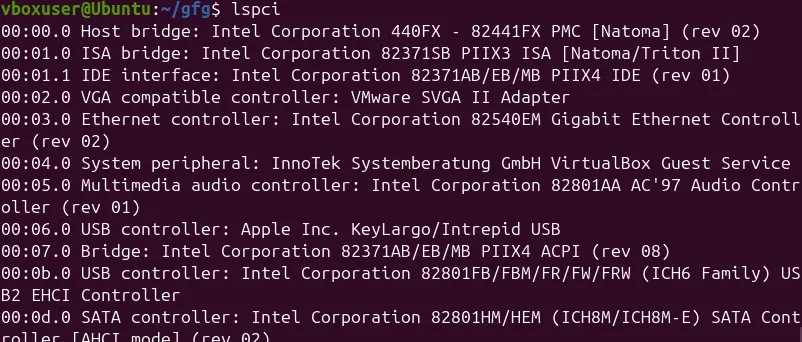
Example 1. Lists all PCI(Peripheral Component Interconnect) devices like graphics cards, network adapters, etc.
Command:
lspci
Output:
What it does:
- Enumerates buses and devices to confirm what hardware is detected by the kernel.
- Useful for driver troubleshooting and inventorying GPUs, NICs, and USB peripherals.
Example 2. Lists USB devices currently connected.
Command:
lsusb
Output:

What it does:
- Shows connected USB devices with vendor/product IDs and basic descriptors.
- Helps verify whether a USB device is recognized before checking dmesg or drivers.
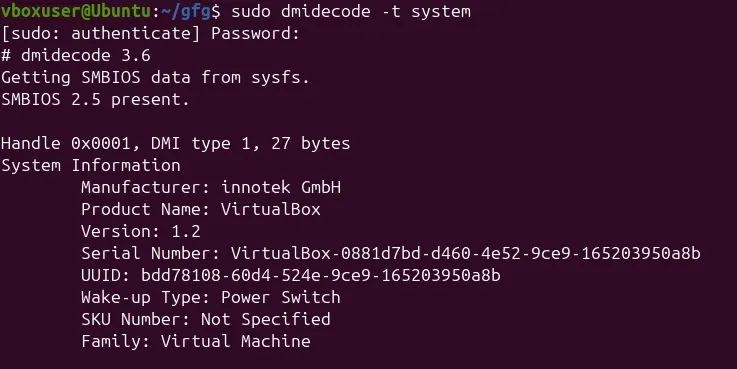
Example 3. Shows hardware details like manufacturer, model, and BIOS version.
Command:
sudo dmidecode -t system
Output:
What it does:
- Reads firmware (DMI/SMBIOS) data to report system manufacturer, product name, serial, and BIOS/UEFI version.
- Use specific -t types (e.g., bios, system, memory) to extract targeted asset and hardware info.
Viewing Logs and System Events
Logs contain messages from the system and services, they explain why something went wrong.
Example 1. Shows recent system errors and warnings.
Command:
journalctl -xe
What it does:
- Shows recent logs with extra context and priority hints, focusing on errors and critical events.
- Ideal first stop after a failure; add -u service to pivot into service-specific logs.
Example 2. Displays logs related to a particular service.
Command:
journalctl -u servicename
What it does:
- Filters logs for a particular systemd service, making timelines and failures clear.
- Add --since/--until for time-bounded investigations; use -f to follow live events.
Example 3. Shows kernel messages (e.g., detected hardware, drivers, or crashes).
Command:
dmesg -T
What it does:
- Prints kernel ring buffer messages with human-readable timestamps.
- Look here for hardware detection, driver issues, and crash traces immediately after boot or errors.
Managing Services and Startup
Linux uses services to run programs in the background (like web or database servers). You can check and control them easily.
Example 1. Shows if a service is running.
Command:
systemctl status service-name
What it does:
- Shows service status, last logs, main PID, and recent failures in one view.
- Great for quick health checks and confirming if restarts or crashes are happening.
Example 2. Starts and enables the service to run at boot.
Command:
systemctl enable --now service-name
What it does:
- Enables a service to start on boot and starts it immediately.
- Use after installation or configuration so the service survives reboots.
Example 3. Lists services that have failed to start.
Command:
systemctl --failed
What it does:
- Lists units that failed to start, with brief reasons and states.
- Start here after boot to triage what needs attention.
Note: Some of these commands and outputs are intentionally omitted or may not run in certain environments due to privacy, permission, or security restrictions (e.g., sandboxed terminals, managed lab VMs, or limited user privileges).
Basic Security and User Checks
Security begins by knowing who’s logged in and what they can do.
Example 1. Displays current user ID and groups.
Command:
id
Output:

- Prints user identity: UID, primary group, and supplementary groups.
- Use it to verify membership in privileged groups like sudo or docker.
Example 2. Shows what commands the current user can run with sudo permissions.
Command:
sudo -l
Output:

- Lists commands the current user can run with elevated privileges, according to sudoers.
- Useful for least-privilege audits and validating expected admin access.
Example 3. Lists the last 10 logins to your system.
Command:
last -n 10
Output:
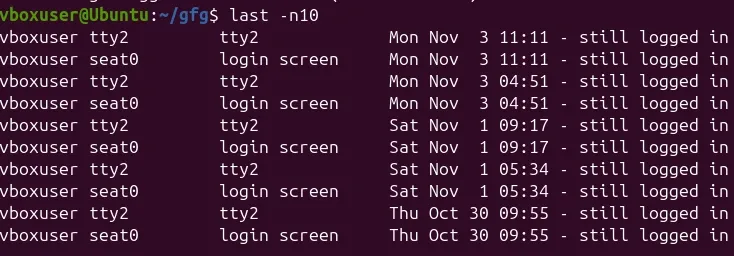
- Shows the last 10 login sessions with usernames, times, and sources.
- Helps spot suspicious logins or confirm maintenance windows.
A Simple System Health Script
You can automate system checks with a short script. Create a file called health.sh, paste this in, and run it with bash health.sh.
#!/usr/bin/env bash
echo "== SYSTEM =="
hostnamectl | egrep 'Operating System|Kernel|Architecture'

echo; echo "== CPU =="
lscpu | egrep 'Model name|CPU|Thread|Core|MHz'

echo; echo "== MEMORY =="
free -h

echo; echo "== DISK USAGE =="
df -hT | awk 'NR==1 || $7 ~ /^\/(home|var|root|\/|boot|data)/'

echo; echo "== NETWORK PORTS =="
ss -tuln | head -n 10

echo; echo "== LOAD AVERAGE (1/5/15) =="
awk '{print $1,$2,$3}' /proc/loadavg

echo; echo "== TOP PROCESSES =="
ps -eo pid,comm,%cpu,%mem --sort=-%cpu | head -n 10
This script summarizes the system’s health helps in doing perfect quick check before troubleshooting or deployment.