

Life expectancy
The average life expectancy of a country usually draws a conclusion about medical and hygiene standards.The oldest people in the world can be 115 years and even older. Most of these records were set in the US, Japan and a few European countries. The usual retirement period is often no more than 10-15 years. The following comparison shows that it can be quite different in other countries.
Remarkable: The most expensive microstates are again on top of this ranking.
▼ Ranking by country
▼ Worldwide development
▼ Differentiation by region
Life expectancy for men and women
A male child born in the United States today will live to be 76.5 years old on average. This puts the male citizens of the US in 57th place in this ranking. On average, US women are 4.9 years older, reaching an age of 81.4. The world average age of death is a few years lower at 71.1 years for men and 76.0 years for women. Within the European Union, these are 79.0 and 84.2 years respectively.Birth rate and death rate are given in births/deaths per 1,000 inhabitants within one year. The table shows the official data from the year 2024. In some minor cases, no data for this year are known, so previously published data were used.
| Country | Life expectancy males | Life expectancy females | Birth rate | Death rate |
|---|---|---|---|---|
| Monaco | 84.6 years | 88.6 years | 9.4 ‰ | 21.0 ‰ |
| San Marino | 84.3 years | 87.2 years | 5.6 ‰ | 8.3 ‰ |
| Kuwait | 83.8 years | 85.4 years | 10.3 ‰ | 1.5 ‰ |
| Hong Kong * | 82.7 years | 88.2 years | 4.4 ‰ | 7.3 ‰ |
| Switzerland | 82.7 years | 86.2 years | 9.0 ‰ | 8.1 ‰ |
| Sweden | 82.6 years | 85.6 years | 9.5 ‰ | 9.0 ‰ |
| Andorra | 82.3 years | 86.2 years | 6.9 ‰ | 6.1 ‰ |
| Liechtenstein | 82.2 years | 86.3 years | 9.1 ‰ | 6.8 ‰ |
| United Arab Emirates | 82.2 years | 84.3 years | 9.8 ‰ | 0.9 ‰ |
| Italy | 82.0 years | 86.0 years | 6.4 ‰ | 11.4 ‰ |
| French Polynesia * | 81.9 years | 86.6 years | 10.9 ‰ | 3.6 ‰ |
| Qatar | 81.8 years | 83.5 years | 9.9 ‰ | 0.9 ‰ |
| Norway | 81.6 years | 84.8 years | 9.4 ‰ | 7.9 ‰ |
| Ireland | 81.4 years | 84.7 years | 10.3 ‰ | 6.6 ‰ |
| Spain | 81.4 years | 86.5 years | 6.6 ‰ | 9.0 ‰ |
| Faroe Islands * | 81.3 years | 84.9 years | 10.6 ‰ | 7.6 ‰ |
| Iceland | 81.2 years | 84.5 years | 11.2 ‰ | 6.7 ‰ |
| Malta | 81.2 years | 84.8 years | 8.1 ‰ | 7.3 ‰ |
| Singapore | 81.2 years | 85.6 years | 7.4 ‰ | 6.2 ‰ |
| Australia | 81.1 years | 85.1 years | 10.8 ‰ | 6.9 ‰ |
| Israel | 81.1 years | 85.4 years | 18.6 ‰ | 5.2 ‰ |
| Japan | 81.1 years | 87.1 years | 6.0 ‰ | 13.0 ‰ |
| Gibraltar * | 81.0 years | 86.2 years | 12.1 ‰ | 6.5 ‰ |
| Luxembourg | 81.0 years | 85.5 years | 9.5 ‰ | 6.6 ‰ |
| Bahrain | 80.9 years | 82.1 years | 12.5 ‰ | 2.1 ‰ |
| South Korea | 80.8 years | 86.6 years | 4.5 ‰ | 6.9 ‰ |
| Macao * | 80.6 years | 86.2 years | 5.5 ‰ | 4.4 ‰ |
| Netherlands | 80.6 years | 83.4 years | 9.2 ‰ | 9.5 ‰ |
| Denmark | 80.4 years | 84.2 years | 9.7 ‰ | 9.8 ‰ |
| New Zealand | 80.4 years | 83.7 years | 11.0 ‰ | 7.3 ‰ |
| Belgium | 80.3 years | 84.4 years | 9.4 ‰ | 9.4 ‰ |
| France | 80.2 years | 85.9 years | 9.9 ‰ | 9.4 ‰ |
| Canada | 80.0 years | 84.3 years | 8.8 ‰ | 8.2 ‰ |
| Austria | 79.8 years | 84.3 years | 8.5 ‰ | 9.8 ‰ |
| Finland | 79.8 years | 85.0 years | 7.8 ‰ | 11.0 ‰ |
| Portugal | 79.7 years | 85.2 years | 8.1 ‰ | 11.2 ‰ |
| Slovenia | 79.7 years | 85.0 years | 8.0 ‰ | 10.2 ‰ |
| United Kingdom | 79.5 years | 83.3 years | 10.0 ‰ | 9.5 ‰ |
| Greece | 79.4 years | 84.4 years | 6.8 ‰ | 12.2 ‰ |
| Bermuda * | 79.1 years | 85.9 years | 8.0 ‰ | 8.9 ‰ |
| Germany | 78.5 years | 83.2 years | 8.3 ‰ | 12.3 ‰ |
| Costa Rica | 78.4 years | 83.6 years | 10.2 ‰ | 5.5 ‰ |
| Puerto Rico * | 78.3 years | 85.4 years | 5.8 ‰ | 10.7 ‰ |
| Albania | 77.9 years | 81.6 years | 10.2 ‰ | 8.3 ‰ |
| Virgin Islands * | 77.6 years | 84.1 years | 11.4 ‰ | 9.0 ‰ |
| United States | 76.5 years | 81.4 years | 10.7 ‰ | 9.2 ‰ |
| Kosovo | 76.0 years | 80.3 years | 12.1 ‰ | 5.9 ‰ |
| Iran | 76.0 years | 79.8 years | 13.0 ‰ | 4.7 ‰ |
| Cuba | 75.9 years | 80.7 years | 8.7 ‰ | 10.1 ‰ |
| Montenegro | 75.5 years | 80.4 years | 11.2 ‰ | 10.1 ‰ |
| China | 75.2 years | 81.0 years | 6.4 ‰ | 7.9 ‰ |
| Argentina | 75.0 years | 80.0 years | 11.1 ‰ | 7.7 ‰ |
| Ecuador | 74.9 years | 80.3 years | 15.0 ‰ | 5.1 ‰ |
| Poland | 74.8 years | 82.2 years | 7.4 ‰ | 11.1 ‰ |
| Bosnia and Herzegovina | 74.6 years | 81.1 years | 7.7 ‰ | 13.5 ‰ |
| Turkey | 74.6 years | 80.3 years | 11.2 ‰ | 6.2 ‰ |
| Malaysia | 74.4 years | 79.5 years | 12.4 ‰ | 5.2 ‰ |
| Serbia | 73.7 years | 78.4 years | 9.2 ‰ | 14.7 ‰ |
| Bangladesh | 73.3 years | 76.7 years | 20.4 ‰ | 5.0 ‰ |
| Brazil | 73.0 years | 79.1 years | 12.3 ‰ | 7.1 ‰ |
| Romania | 72.8 years | 80.3 years | 8.4 ‰ | 12.8 ‰ |
| Mexico | 72.4 years | 78.0 years | 15.7 ‰ | 6.2 ‰ |
| Thailand | 72.3 years | 81.0 years | 8.2 ‰ | 8.9 ‰ |
| India | 70.7 years | 73.9 years | 16.1 ‰ | 6.6 ‰ |
| Dominican Republic | 70.7 years | 77.1 years | 17.9 ‰ | 6.3 ‰ |
| Vietnam | 70.1 years | 79.4 years | 13.8 ‰ | 6.6 ‰ |
| Egypt | 69.7 years | 74.0 years | 21.0 ‰ | 5.5 ‰ |
| Indonesia | 69.2 years | 73.4 years | 15.9 ‰ | 7.5 ‰ |
| Russia | 68.3 years | 78.9 years | 8.6 ‰ | 12.1 ‰ |
| Cambodia | 68.1 years | 73.4 years | 20.8 ‰ | 6.4 ‰ |
| Philippines | 67.0 years | 73.0 years | 16.0 ‰ | 6.2 ‰ |
| Pakistan | 65.5 years | 70.3 years | 27.8 ‰ | 6.5 ‰ |
| Afghanistan | 64.7 years | 67.8 years | 35.4 ‰ | 5.8 ‰ |
| South Africa | 62.8 years | 69.8 years | 18.8 ‰ | 9.2 ‰ |
| Togo | 62.7 years | 63.2 years | 32.6 ‰ | 8.7 ‰ |
| Liberia | 61.0 years | 63.6 years | 31.0 ‰ | 8.1 ‰ |
| Niger | 60.5 years | 62.4 years | 41.9 ‰ | 8.9 ‰ |
| Sierra Leone | 60.2 years | 63.7 years | 30.6 ‰ | 8.3 ‰ |
| Congo (Dem. Republic) | 60.0 years | 64.2 years | 41.3 ‰ | 8.5 ‰ |
| Guinea | 59.7 years | 62.1 years | 33.8 ‰ | 9.1 ‰ |
| Benin | 59.5 years | 62.4 years | 33.9 ‰ | 8.8 ‰ |
| Mali | 59.3 years | 62.2 years | 40.0 ‰ | 8.6 ‰ |
| Burkina Faso | 59.1 years | 63.4 years | 31.6 ‰ | 8.0 ‰ |
| Somalia | 56.5 years | 61.6 years | 43.0 ‰ | 9.8 ‰ |
| Central Africa | 55.5 years | 59.6 years | 46.4 ‰ | 9.4 ‰ |
| Lesotho | 55.0 years | 60.4 years | 24.1 ‰ | 10.6 ‰ |
| South Sudan | 54.8 years | 60.7 years | 28.6 ‰ | 9.6 ‰ |
| Nigeria | 54.3 years | 54.9 years | 33.0 ‰ | 11.7 ‰ |
| Chad | 53.4 years | 57.2 years | 42.4 ‰ | 11.0 ‰ |
Development of life expectancy worldwide
In the years 1960 to 2024, life expectancy has increased perceptibly worldwide. Starting at 50.7 years, it increased for men by 20.4 years to 71.1 years. For women, life expectancy increased by 21.4 years from 54.6 up to an average of 76.0 years since 1960.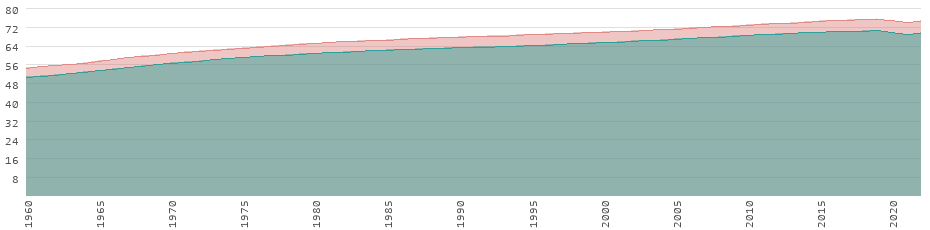
Differentiation by region
Life expectancy in Africa | Male | Female |
|---|---|---|
| Northern Africa | 69.51 | 74.05 |
| Central Africa | 60.11 | 64.48 |
| Western Africa | 57.77 | 59.76 |
| Southern Africa | 62.68 | 69.59 |
| Eastern Africa | 63.29 | 68.85 |
Life expectancy in America | Male | Female |
| Caribbean | 70.14 | 76.16 |
| South America | 73.53 | 79.33 |
| Central America | 71.73 | 77.18 |
| North America | 75.75 | 80.76 |
Life expectancy in Asia | Male | Female |
| South Asia | 70.43 | 73.85 |
| Western Asia | 73.58 | 78.20 |
| Southeast Asia | 69.17 | 75.15 |
| East Asia | 75.83 | 81.56 |
| Central Asia | 69.42 | 75.97 |
Life expectancy in Europe | Male | Female |
| Western Europe | 79.63 | 84.40 |
| Southern Europe | 80.52 | 85.20 |
| Northern Europe | 79.74 | 83.76 |
| Eastern Europe | 70.41 | 79.72 |
Life expectancy in Oceania | Male | Female |
| Polynesia | 74.92 | 79.82 |
| Australia/New Zealand | 80.99 | 84.87 |
| Melanesia | 64.73 | 69.82 |
| Micronesia | 68.39 | 74.35 |
What is life expectancy?
Life expectancy indicates the expected age that is estimated for a human being at the time of birth. This number of years is determined mainly from the current mortality rates. However, since these data only take into account the past, additional estimates are included to determine the future age due to external influences. These can be environmental factors as well as developments in health care. The average life expectancy is therefore not a measured value, but a prognosis for the future.As the life expentancy steadily increases in most countries, the currect average age of death is bit lower than the expected. Depending on the country, it is between two and five years lower.
Above all, life expectancy is a result of the living conditions of a person or a population group. Essential factors are medical care, balanced nutrition and drinking water supply. Regionally occurring diseases such as malaria also play a role in the country comparison. These factors are influenced significantly by political factors, which is why life expectancy often derives from a country's standard of living.
Relationship between economic development and life expectancy
There is a close statistical correlation with gross domestic product per capita, one of the key economic indicators of a country's economic strength. As income rises, the average life expectancy of the population also tends to increase.Economic prosperity enables investment in health infrastructure, medical research, and prevention programs. Countries with high per capita income typically have dense medical care, modern hospitals, and broad access to medicines. Indirectly, living conditions, nutrition, and education improve the personal situation. This reduces child and maternal mortality in particular and reduces the spread of infectious diseases.
However, the relationship is not linear. Empirical representations such as the so-called Preston curve show that life expectancy increases significantly at low incomes as soon as basic needs are met. Above a certain income level, the increase flattens out significantly. Additional prosperity then only leads to comparatively small gains in life expectancy.
Gross domestic product does not explain all differences. Countries with comparable per capita incomes sometimes show considerable variations in life expectancy. The reasons for this include social inequality, the efficiency of the healthcare system, level of education, and health-related lifestyles.
The difference between men and women
In the vast majority of countries, women are four to eight years older than men. According to many scientists, this is not a purely biological difference. Instead it is also attributed to different behaviors. According to this view, men are less careful about their bodies than women. In fact, smokers and alcohol consumers are more common among men. Also, physical stress with simultaneous aversions to medical treatment and health precautions are responsible for this. Indeed, there is also an additional genetic reason for women's longer lives.Influence of the mortality rate of children
A significant impact on life expectancy is the mortality rate of children. Both in the Middle Ages, as well as in the developing countries today, the death rate of children at birth or in the first few years of life is disproportionately high. These factors are already included in the average life expectancy. If one subtracts the proportion of children already deceased after the first years of living, the "average" is maintained, but the life expectancy of the rest increases.* The marked countries are not independent and sovereign states, but dependent territories of other states. Cf. also our article What is a country?