

Inflation trends in the United States of America
The inflation rate for consumer prices in the United States of America moved over the past 65 years between -0.3% and 13.5%. For 2025, an inflation rate of 2.7% was calculated.During the observation period from 1960 to 2025, the average inflation rate was 3.8% per year. Overall, the price increase was 1,006.12%. An item that cost 100 dollars in 1960 costs 1,106.12 dollars at the beginning of 2026.
For April 2026, the year-over-year inflation rate was 3.81%.
This includes energy (+17.9%), food (+2.9%) and rental prices (+4.3%).
› Inflation rates in global comparison
Back to overview: United States
Performance over the last 65 years compared to the European Union
The size and economic structure of the United States is partly comparable with the European Union. As a result, the inflation curve often runs parallel over many years. There were only notable differences at the beginning of the 1980s and during the economic crisis around 2008, when in both cases European consumer prices rose more sharply than in the USA. However, the sharp rise from mid-2021 is clearly noticeable in both regions.Performance based on 100% in 1959:

In the last 5 years alone up to the end of 2025, the inflation rate averaged 4.5%. Cumulatively, it was 24.4%. In the EU, on the other hand, it was 4.8% on average and 26.3% cumulatively in the same period.
Differences between the USA and Europe
The global price increase in recent years is often attributed to the start of the war in Ukraine. The main reasons for this are rising energy prices due to the lack of natural gas supplies from Russia and, at the same time, exploding food prices because the "breadbasket" of Europe is supplying considerably less grain. Both are correct for Europe, but do not have a particularly strong impact on inflation in the USA. The United States produces far more energy than it consumes. It is therefore not at all dependent on Russian gas. Nor do they import grain from the distant Ukraine.The differences become clearer if you take a closer look at the timeline. Prices had already started to rise a few months before the outbreak of the Russian attack. Although energy and grain certainly boosted inflation afterwards, they were not the trigger.
In the USA, inflation was caused by demand. After the last Covid-19 restrictions were lifted, the population had been saving for two years, money was looser again and demand increased. Retailers even experienced supply difficulties, which they compensated for with higher prices. In Europe, the pandemic restrictions were lifted more slowly, but earlier, so that this increase in consumption was not so noticeable. Due to the high dependency on Russian gas and Ukrainian grain, prices in Europe only rose drastically months later because consumers were suddenly consciously spending less. The reason for the inflation is therefore on the demand side.
Interest rate policy
The US Federal Reserve has a fixed inflation target of 2% per year and is acting much more aggressively than central banks in other countries. By increasing the interest rate differential to other countries (especially the euro countries), it makes the export of goods more expensive, which initially leads to an increase in prices outside the USA. Within the US, however, such a measure stabilizes the price structure for a certain period of time.Inflation calculator for the United States of America
Enter any amount, a start year and an end year here. You will then be shown the amount that resulted from the original amount after inflation.100 dollars in 1960 will still be 100 dollars in 2026. The nominal value does not change. What does change, is the purchasing power. In other words, the amount of goods that can be bought with this money. As inflation increases, this amount decreases.
Example: The purchasing power of 100 dollars in 1960 corresponds to that of 1,106.12 dollars at the beginning of 2026. Conversely, in 1960 you could buy as much with 78.49 dollars as you can today with 1000 dollars.
Lowering the key interest rate
Central banks respond to price level movements by adjusting the key interest rate. The key interest rate is the interest rate at which domestic and foreign commercial banks can borrow money from the government. A high key interest rate reduces inflation because it attracts foreign investors and thus brings money into the country. It strengthens the value of the country's own currency. Conversely, a low key interest rate stimulates the economy but increases inflation.For the US and most other countries that use the US dollar, the Federal Reserve Bank (FED) in Washington, D.C. is responsible for this. The last change was made in December 2025, when the central bank lowered the rate from 3.88 to 3.63 percent. The last interest rate hike took place in July 2023. Since then, it has been lowered 6 times in a row. So attempts are being made to strengthen the economy by creating incentives for investment. In doing so, it is accepted that this measure will also have an inflationary effect.
Development of key interest rates
Low inflation typically leads to an appreciation of the domestic currency. Conversely, higher inflation results in depreciation.
Inflation rates for consumer goods in the United States of America
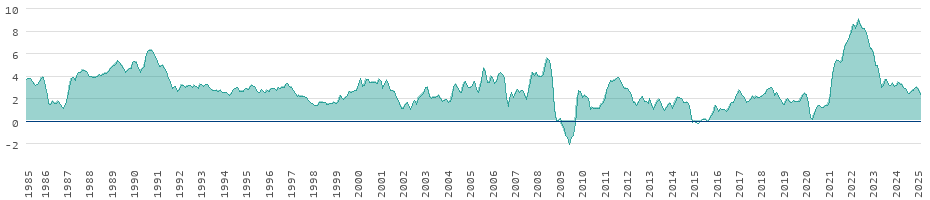
Energy and food
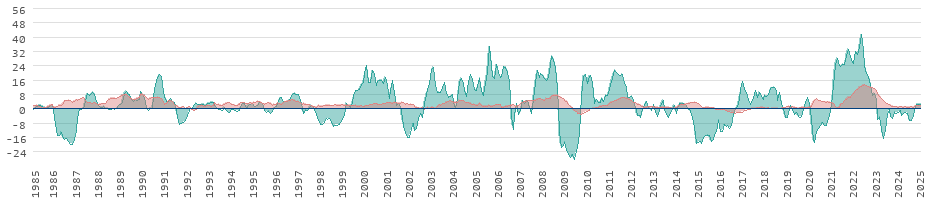
Historical inflation rates in comparison
| Year | United States of America | Ø EU | Ø World |
|---|---|---|---|
| 2025 | 2.65 % | 2.18 % | 4.01 % |
| 2024 | 2.73 % | 2.66 % | 4.87 % |
| 2023 | 3.24 % | 3.22 % | 6.15 % |
| 2022 | 6.41 % | 10.76 % | 8.89 % |
| 2021 | 7.39 % | 5.35 % | 6.31 % |
| 2020 | 1.56 % | 0.16 % | 3.00 % |
| 2019 | 2.10 % | 1.56 % | 3.90 % |
| 2018 | 1.92 % | 1.70 % | 3.62 % |
| 2017 | 2.18 % | 1.50 % | 3.36 % |
| 2016 | 1.30 % | 0.10 % | 2.70 % |
| 2015 | 0.10 % | 0.10 % | 2.70 % |
| 2014 | 1.60 % | 0.40 % | 3.20 % |
| 2013 | 1.50 % | 1.40 % | 3.50 % |
| 2012 | 2.10 % | 2.60 % | 4.00 % |
| 2011 | 3.10 % | 2.80 % | 4.90 % |
| 2010 | 1.60 % | 1.80 % | 3.60 % |
| 2009 | -0.30 % | 0.80 % | 2.60 % |
| 2008 | 3.80 % | 3.70 % | 6.30 % |
| 2007 | 2.90 % | 2.40 % | 4.10 % |
| 2006 | 3.20 % | 2.40 % | 3.90 % |
| 2005 | 3.40 % | 2.40 % | 3.90 % |
| 2004 | 2.70 % | 2.50 % | 3.80 % |
| 2003 | 2.30 % | 2.40 % | 3.90 % |
| 2002 | 1.60 % | 2.80 % | 3.70 % |
| 2001 | 2.80 % | 3.40 % | 4.60 % |
| 2000 | 3.40 % | 3.60 % | 5.00 % |
| 1999 | 2.20 % | 2.50 % | 6.20 % |
| 1998 | 1.50 % | 3.40 % | 6.30 % |
| 1997 | 2.30 % | 12.60 % | 6.60 % |
| 1996 | 2.90 % | 5.40 % | 9.50 % |
| 1995 | 2.80 % | 5.50 % | 16.20 % |
| 1994 | 2.60 % | 8.40 % | 30.80 % |
| 1993 | 3.00 % | 11.80 % | 39.80 % |
| 1992 | 3.00 % | 11.40 % | 39.30 % |
| 1991 | 4.20 % | 14.80 % | 16.90 % |
| 1990 | 5.40 % | 30.00 % | 25.40 % |
| 1989 | 4.80 % | 15.40 % | 22.00 % |
| 1988 | 4.10 % | 5.90 % | 19.10 % |
| 1987 | 3.60 % | 4.00 % | 14.50 % |
| 1986 | 1.90 % | 4.10 % | 11.70 % |
| 1985 | 3.50 % | 6.20 % | 13.70 % |
| 1984 | 4.40 % | 9.90 % | 14.00 % |
| 1983 | 3.20 % | 9.20 % | 13.40 % |
| 1982 | 6.20 % | 14.60 % | 14.30 % |
| 1981 | 10.40 % | 12.10 % | 15.00 % |
| 1980 | 13.50 % | 12.00 % | 17.30 % |
| 1979 | 11.25 % | 8.22 % | n/a |
| 1978 | 7.63 % | 7.76 % | n/a |
| 1977 | 6.50 % | 9.77 % | n/a |
| 1976 | 5.74 % | 9.35 % | n/a |
| 1975 | 9.14 % | 10.47 % | n/a |
| 1974 | 11.05 % | 13.16 % | n/a |
| 1973 | 6.18 % | 7.75 % | n/a |
| 1972 | 3.27 % | 6.01 % | n/a |
| 1971 | 4.29 % | 5.24 % | n/a |
| 1970 | 5.84 % | 4.51 % | n/a |
| 1969 | 5.46 % | 2.67 % | n/a |
| 1968 | 4.27 % | 3.24 % | n/a |
| 1967 | 2.77 % | 3.32 % | n/a |
| 1966 | 3.02 % | 3.70 % | n/a |
| 1965 | 1.59 % | 3.99 % | n/a |
| 1964 | 1.28 % | 3.42 % | n/a |
| 1963 | 1.24 % | 2.92 % | n/a |
| 1962 | 1.20 % | 3.55 % | n/a |
| 1961 | 1.07 % | 2.08 % | n/a |
| 1960 | 1.46 % | 1.74 % | n/a |
Data basis: International Monetary Fund, World Bank and OECD Inflation CPI indicator (doi:10.1787/eee82e6e-en). Central bank policy rates from the Bank for International Settlements (2026), BIS WS_CBPOL. We do not yet have any internationally comparable data for the period after 2025. In order to ensure international comparability, we deliberately do not use data from individual countries, but only the harmonized data from the sources mentioned. Inflation rates for the previous year are normally published 3-5 months after the end of the year and are sometimes corrected several times during the course of the year.