The document discusses machine learning as a subset of artificial intelligence that enables systems to learn from data. It differentiates between supervised and unsupervised learning, and explains the concept of feature vectors and feature spaces essential for modeling tasks like classification. Additionally, it highlights various classification methods, including linear classification and support vector machines, and provides resources for further learning in the field.

![Feature Vectors
A data point is represented by a feature vector
Ninja Turtle = [name, weapon, mask_color]
data point 1 = [michelangelo,nunchaku,orange]
data point 2 = [leonardo,katana,blue]
…](https://image.slidesharecdn.com/machine-learning-formoderndevelopers-140607205731-phpapp01/75/Machine-Learning-for-Modern-Developers-27-2048.jpg)

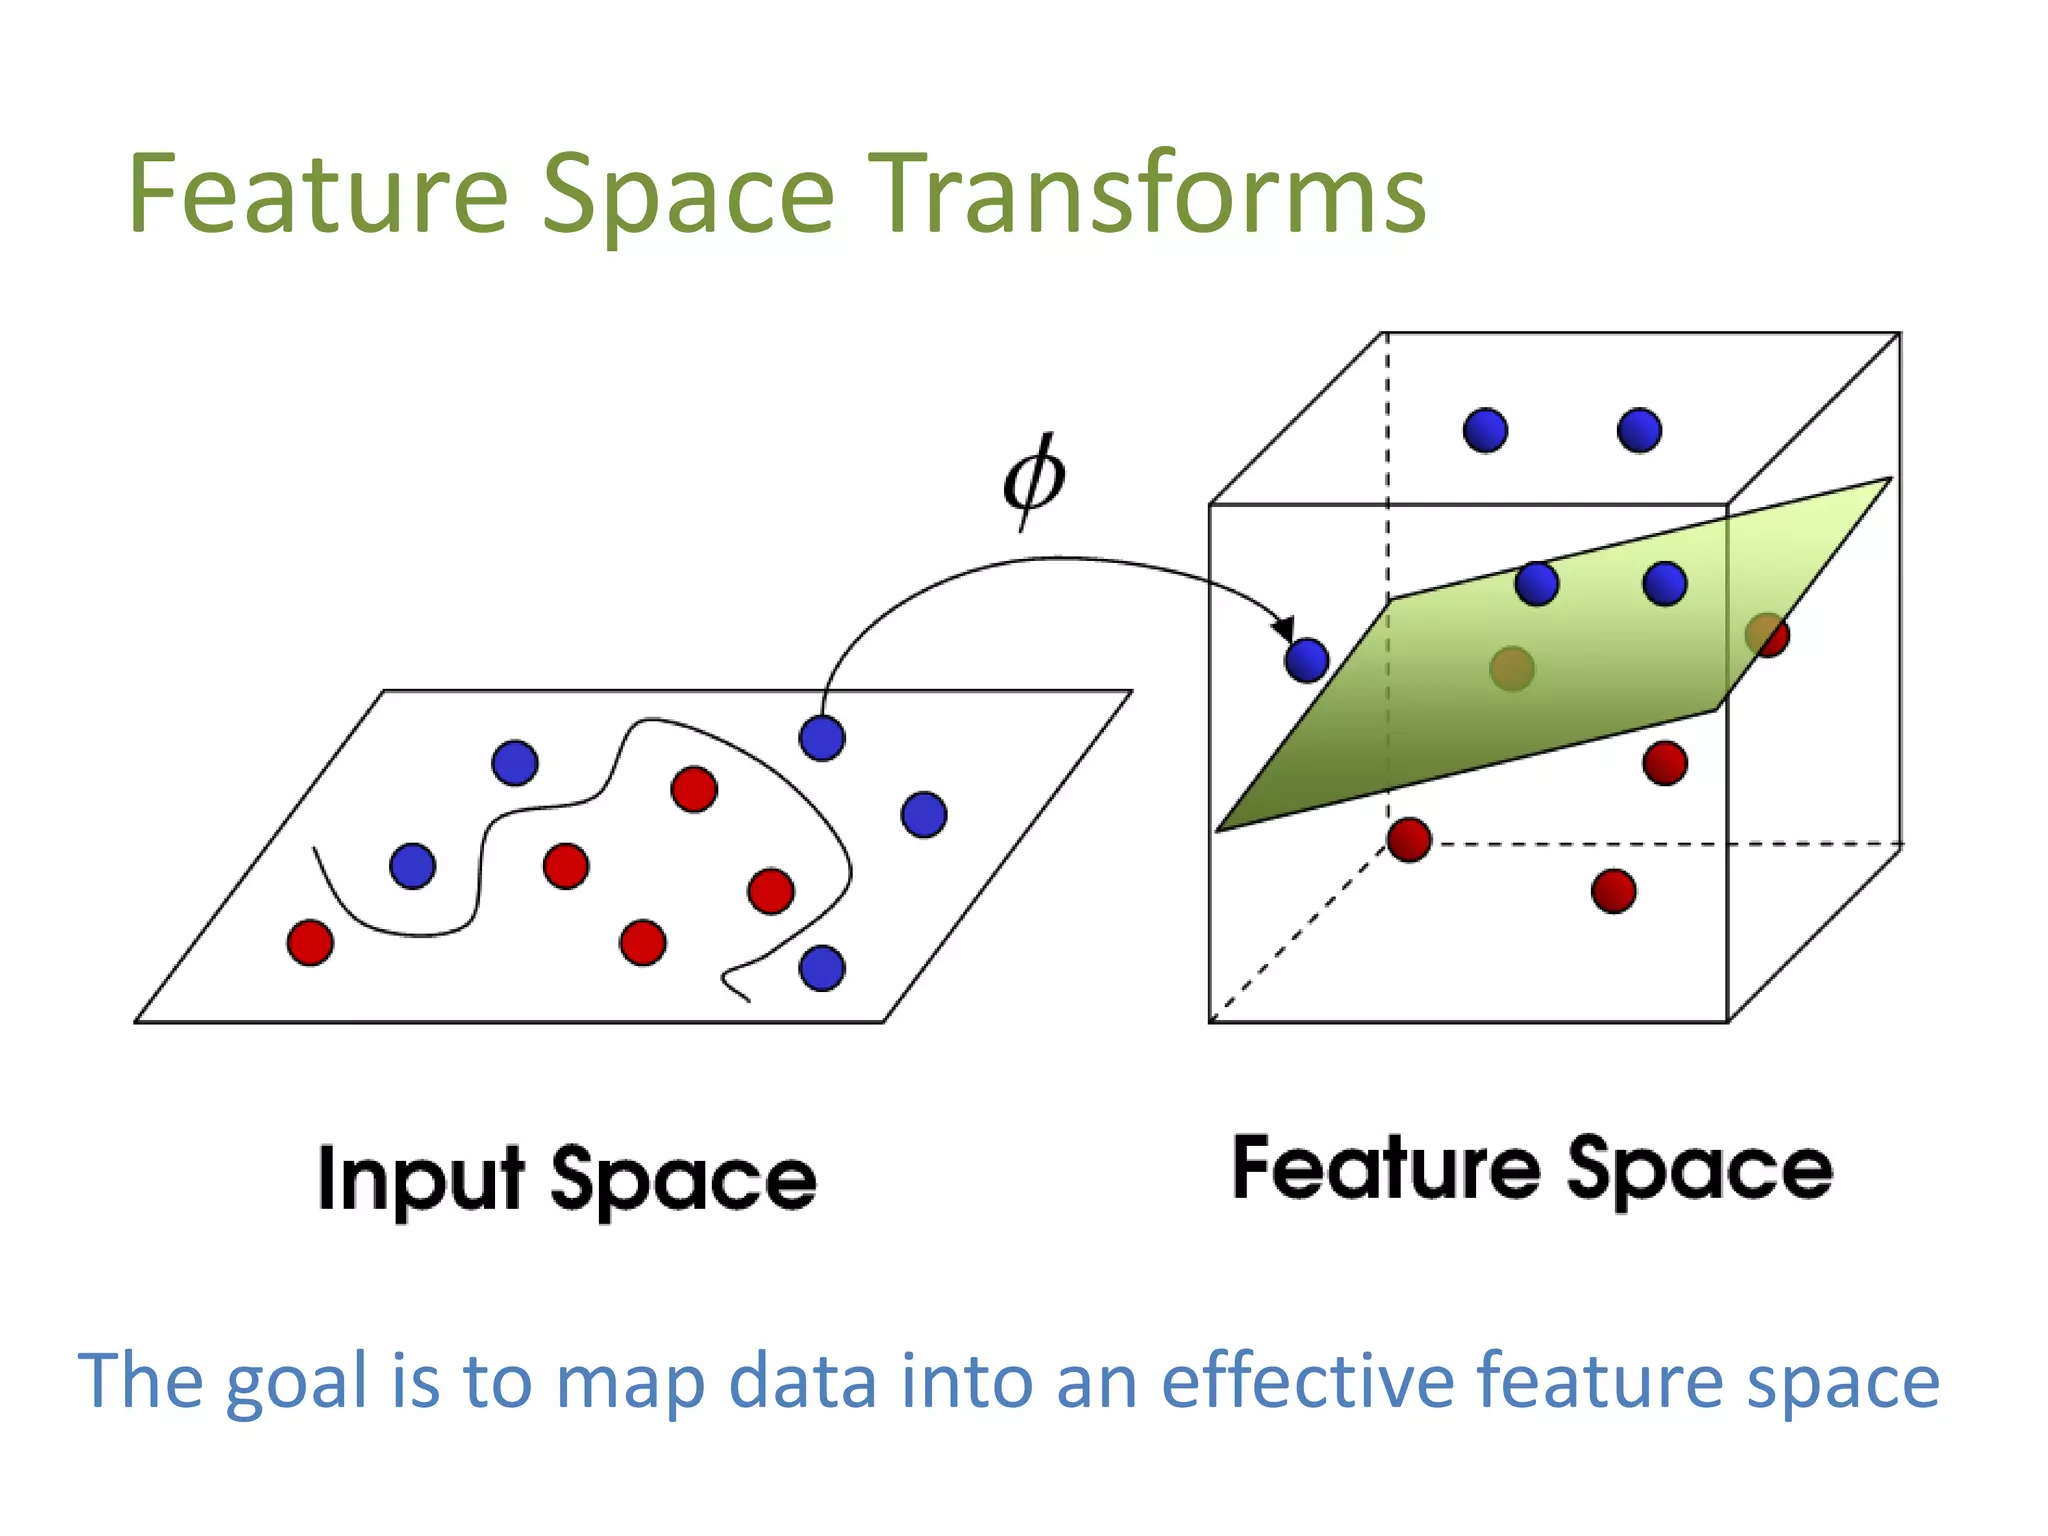
![High-Dimensional Feature Spaces
Most feature vectors are much higher
dimensionality, such as:
FVlaptop = [name,screen size,weight,battery life,
proc,proc speed,ram,price,hard drive,OS]
This means we can’t easily display it visually, but
statistics and matrix math work just fine](https://image.slidesharecdn.com/machine-learning-formoderndevelopers-140607205731-phpapp01/75/Machine-Learning-for-Modern-Developers-30-2048.jpg)
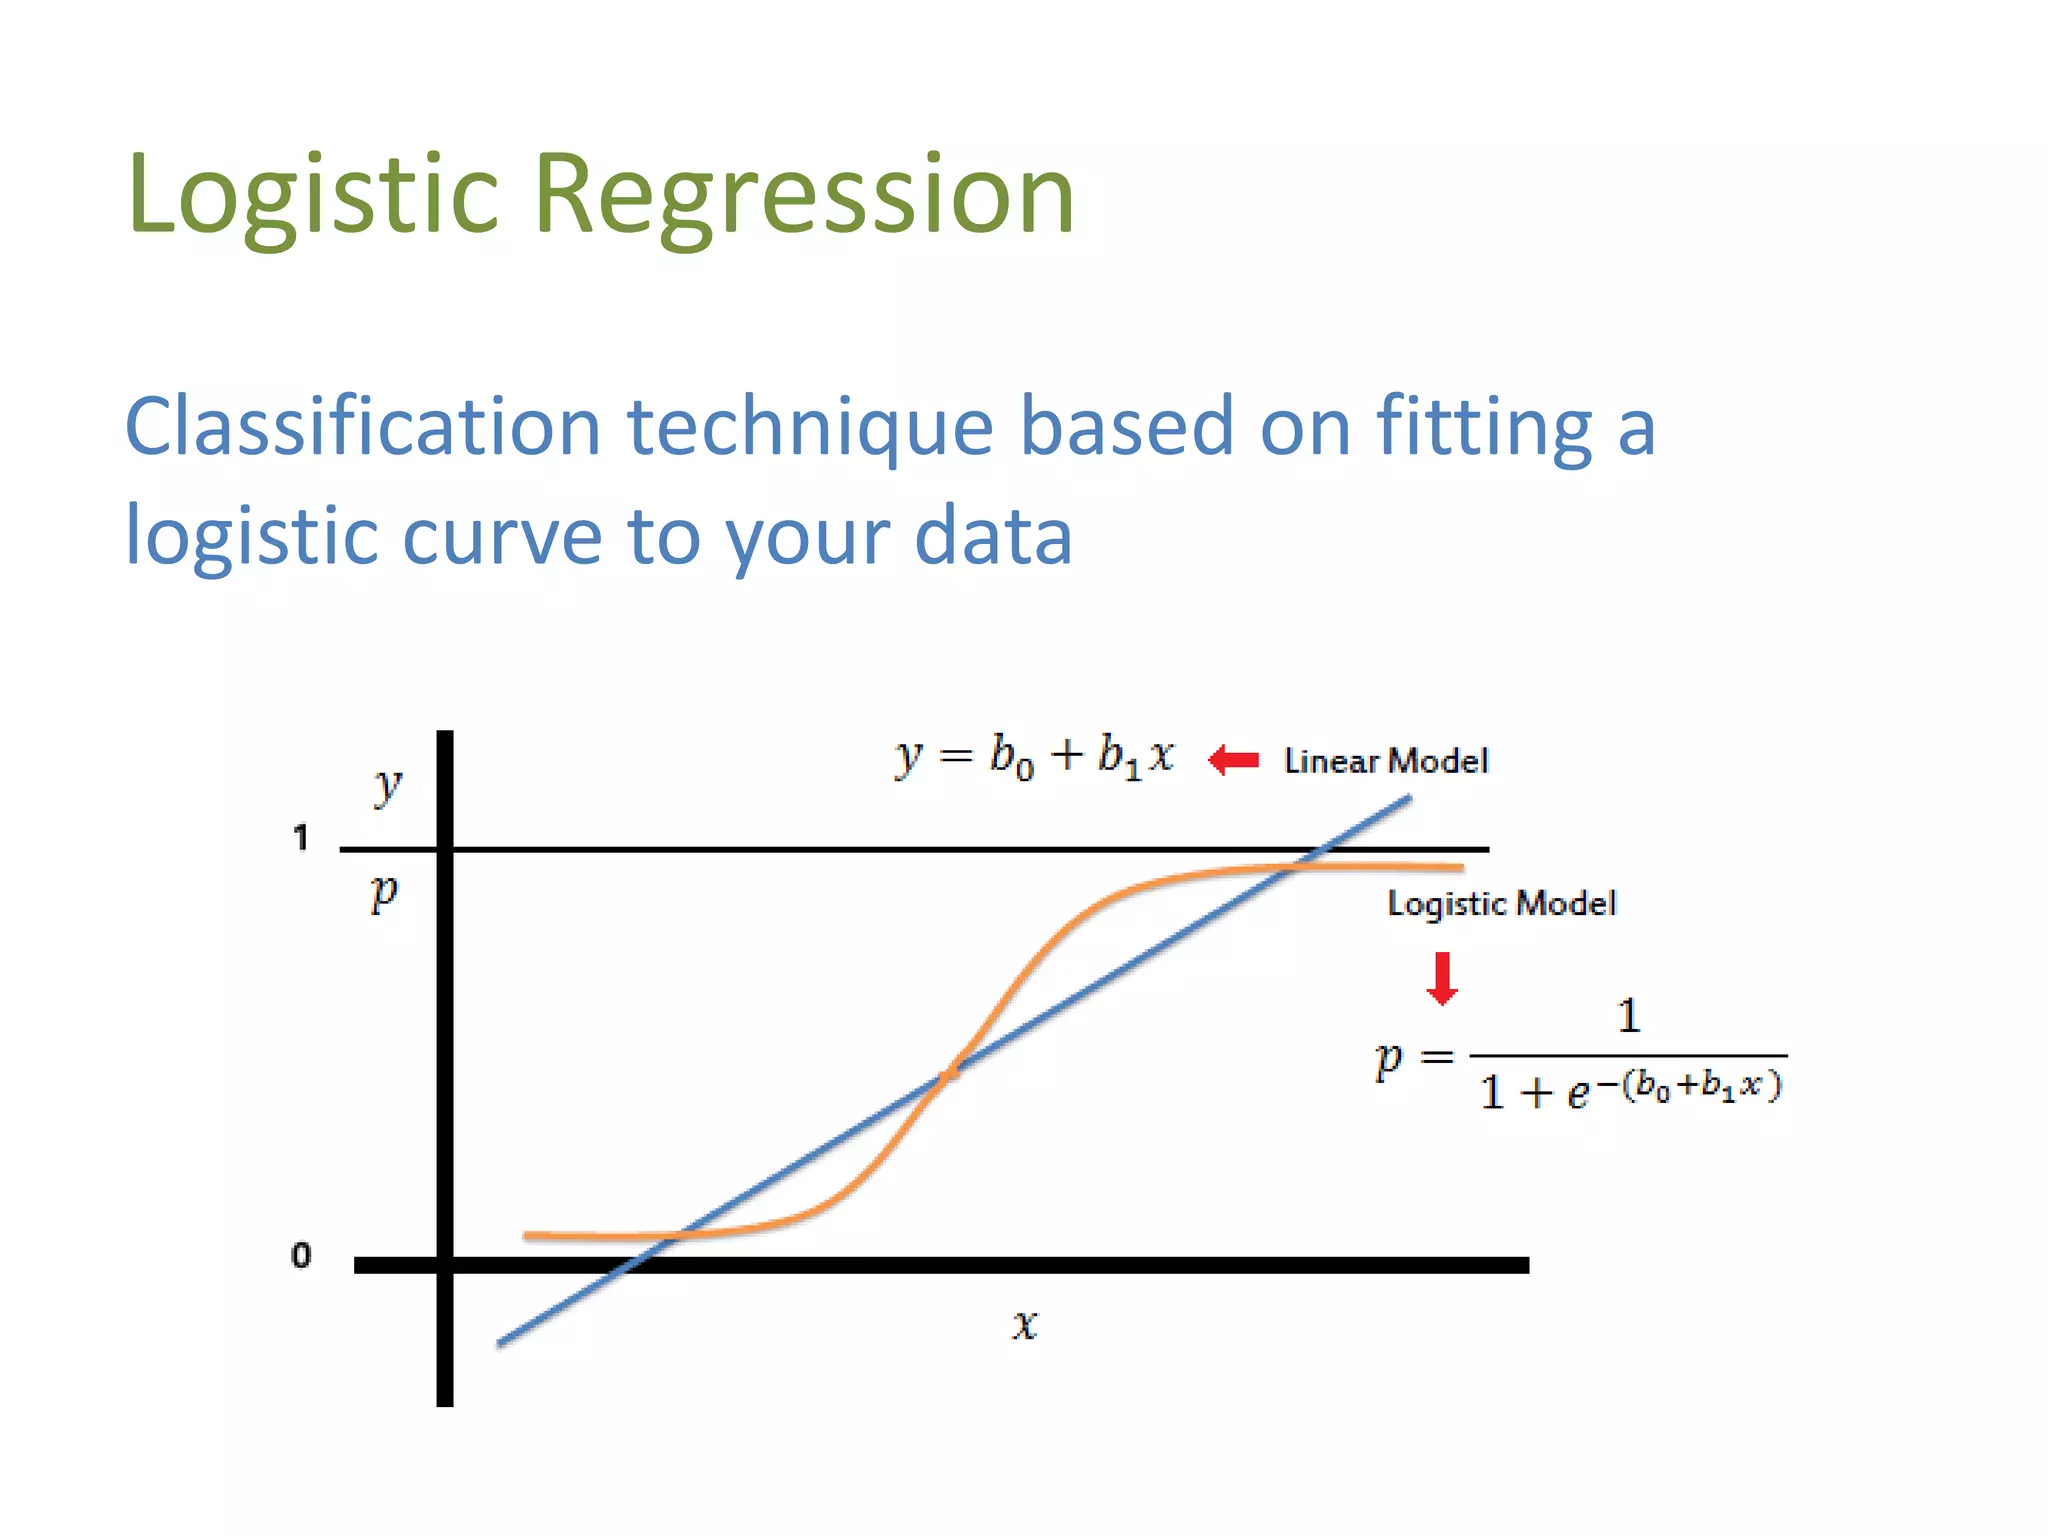
![Demo: Logistic Regression (Scikit-
Learn)
from sklearn.datasets import load_iris
from sklearn.linear_model import LogisticRegression
iris = load_iris()
# set data
X, y = iris.data, iris.target
# train classifier
clf = LogisticRegression().fit(X, y)
# 'setosa' data point
observed_data_point = [[ 5.0, 3.6, 1.3, 0.25]]
# classify
clf.predict(observed_data_point)
# determine classification probabilities
clf.predict_proba(observed_data_point)](https://image.slidesharecdn.com/machine-learning-formoderndevelopers-140607205731-phpapp01/75/Machine-Learning-for-Modern-Developers-55-2048.jpg)
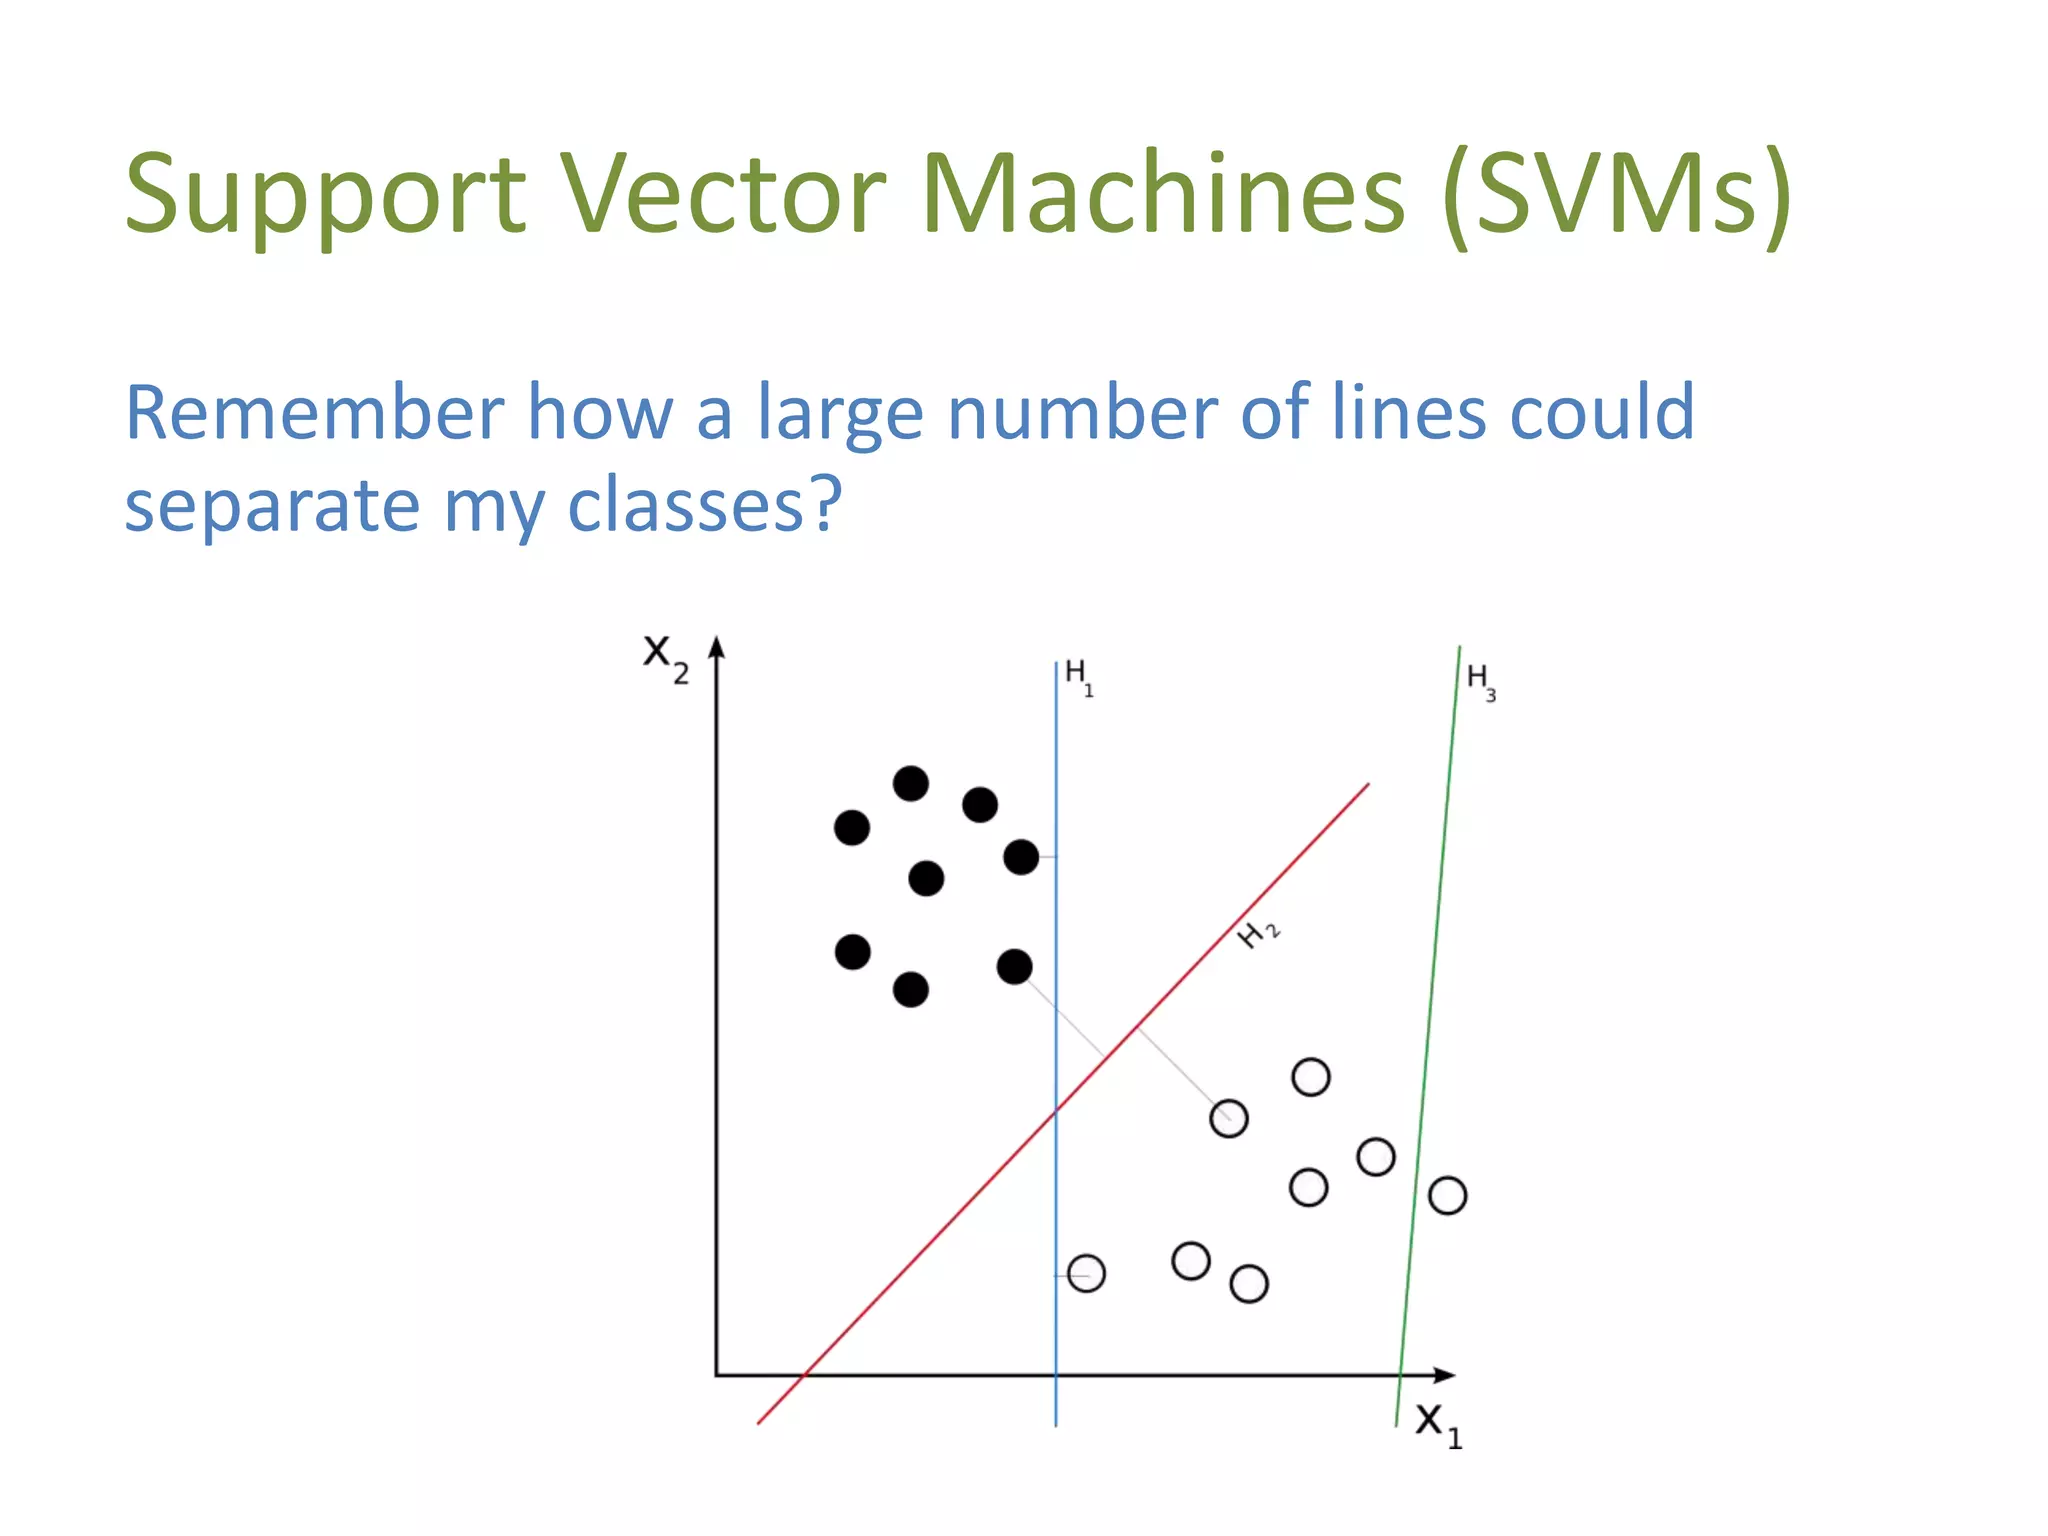
![Demo: Support Vector Machines
(Scikit-Learn)
from sklearn.datasets import load_iris
from sklearn.svm import LinearSVC
iris = load_iris()
# set data
X, y = iris.data, iris.target
# run regression
clf = LinearSVC().fit(X, y)
# 'setosa' data point
observed_data_point = [[ 5.0, 3.6, 1.3, 0.25]]
# classify
clf.predict(observed_data_point)](https://image.slidesharecdn.com/machine-learning-formoderndevelopers-140607205731-phpapp01/75/Machine-Learning-for-Modern-Developers-62-2048.jpg)