Downloaded 249 times
![Integrating web analytics into information architecture and user-centered design 2008 IA Summit Hallie Wilfert [email_address]](https://image.slidesharecdn.com/iasummit2008hlw-1208174190799102-8/75/Integrating-web-analytics-into-information-architecture-and-user-centered-design-1-2048.jpg)
![Or the boring title…. Integrating web analytics into information architecture and user-centered design 2008 IA Summit Hallie Wilfert [email_address]](https://image.slidesharecdn.com/iasummit2008hlw-1208174190799102-8/75/Integrating-web-analytics-into-information-architecture-and-user-centered-design-3-2048.jpg)

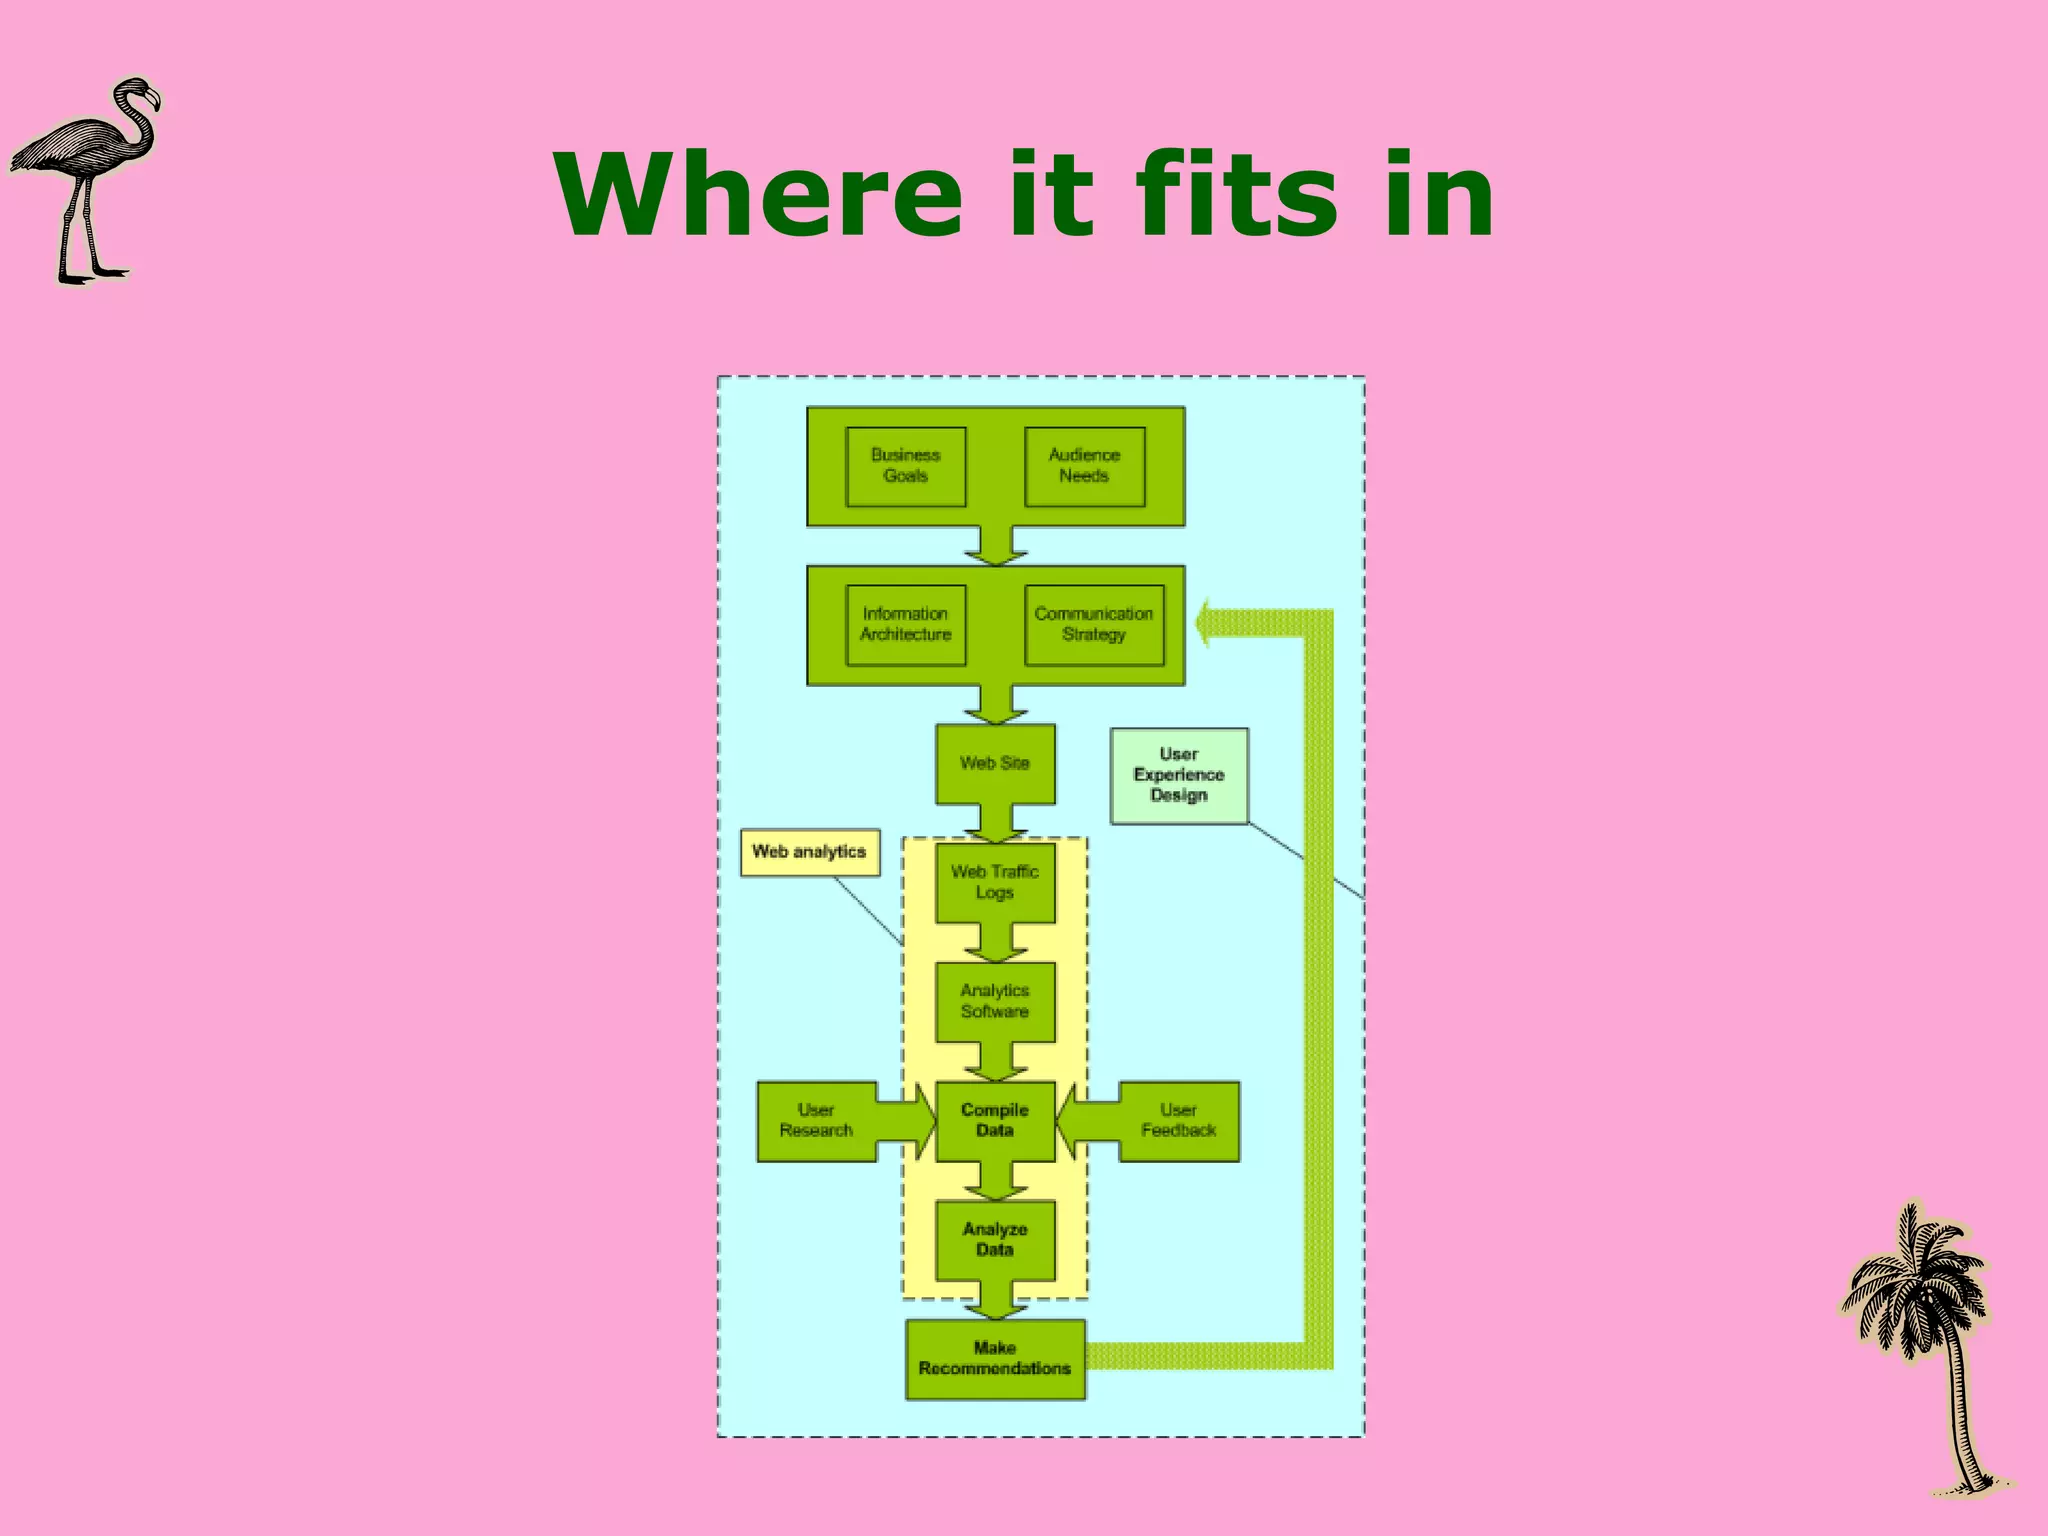
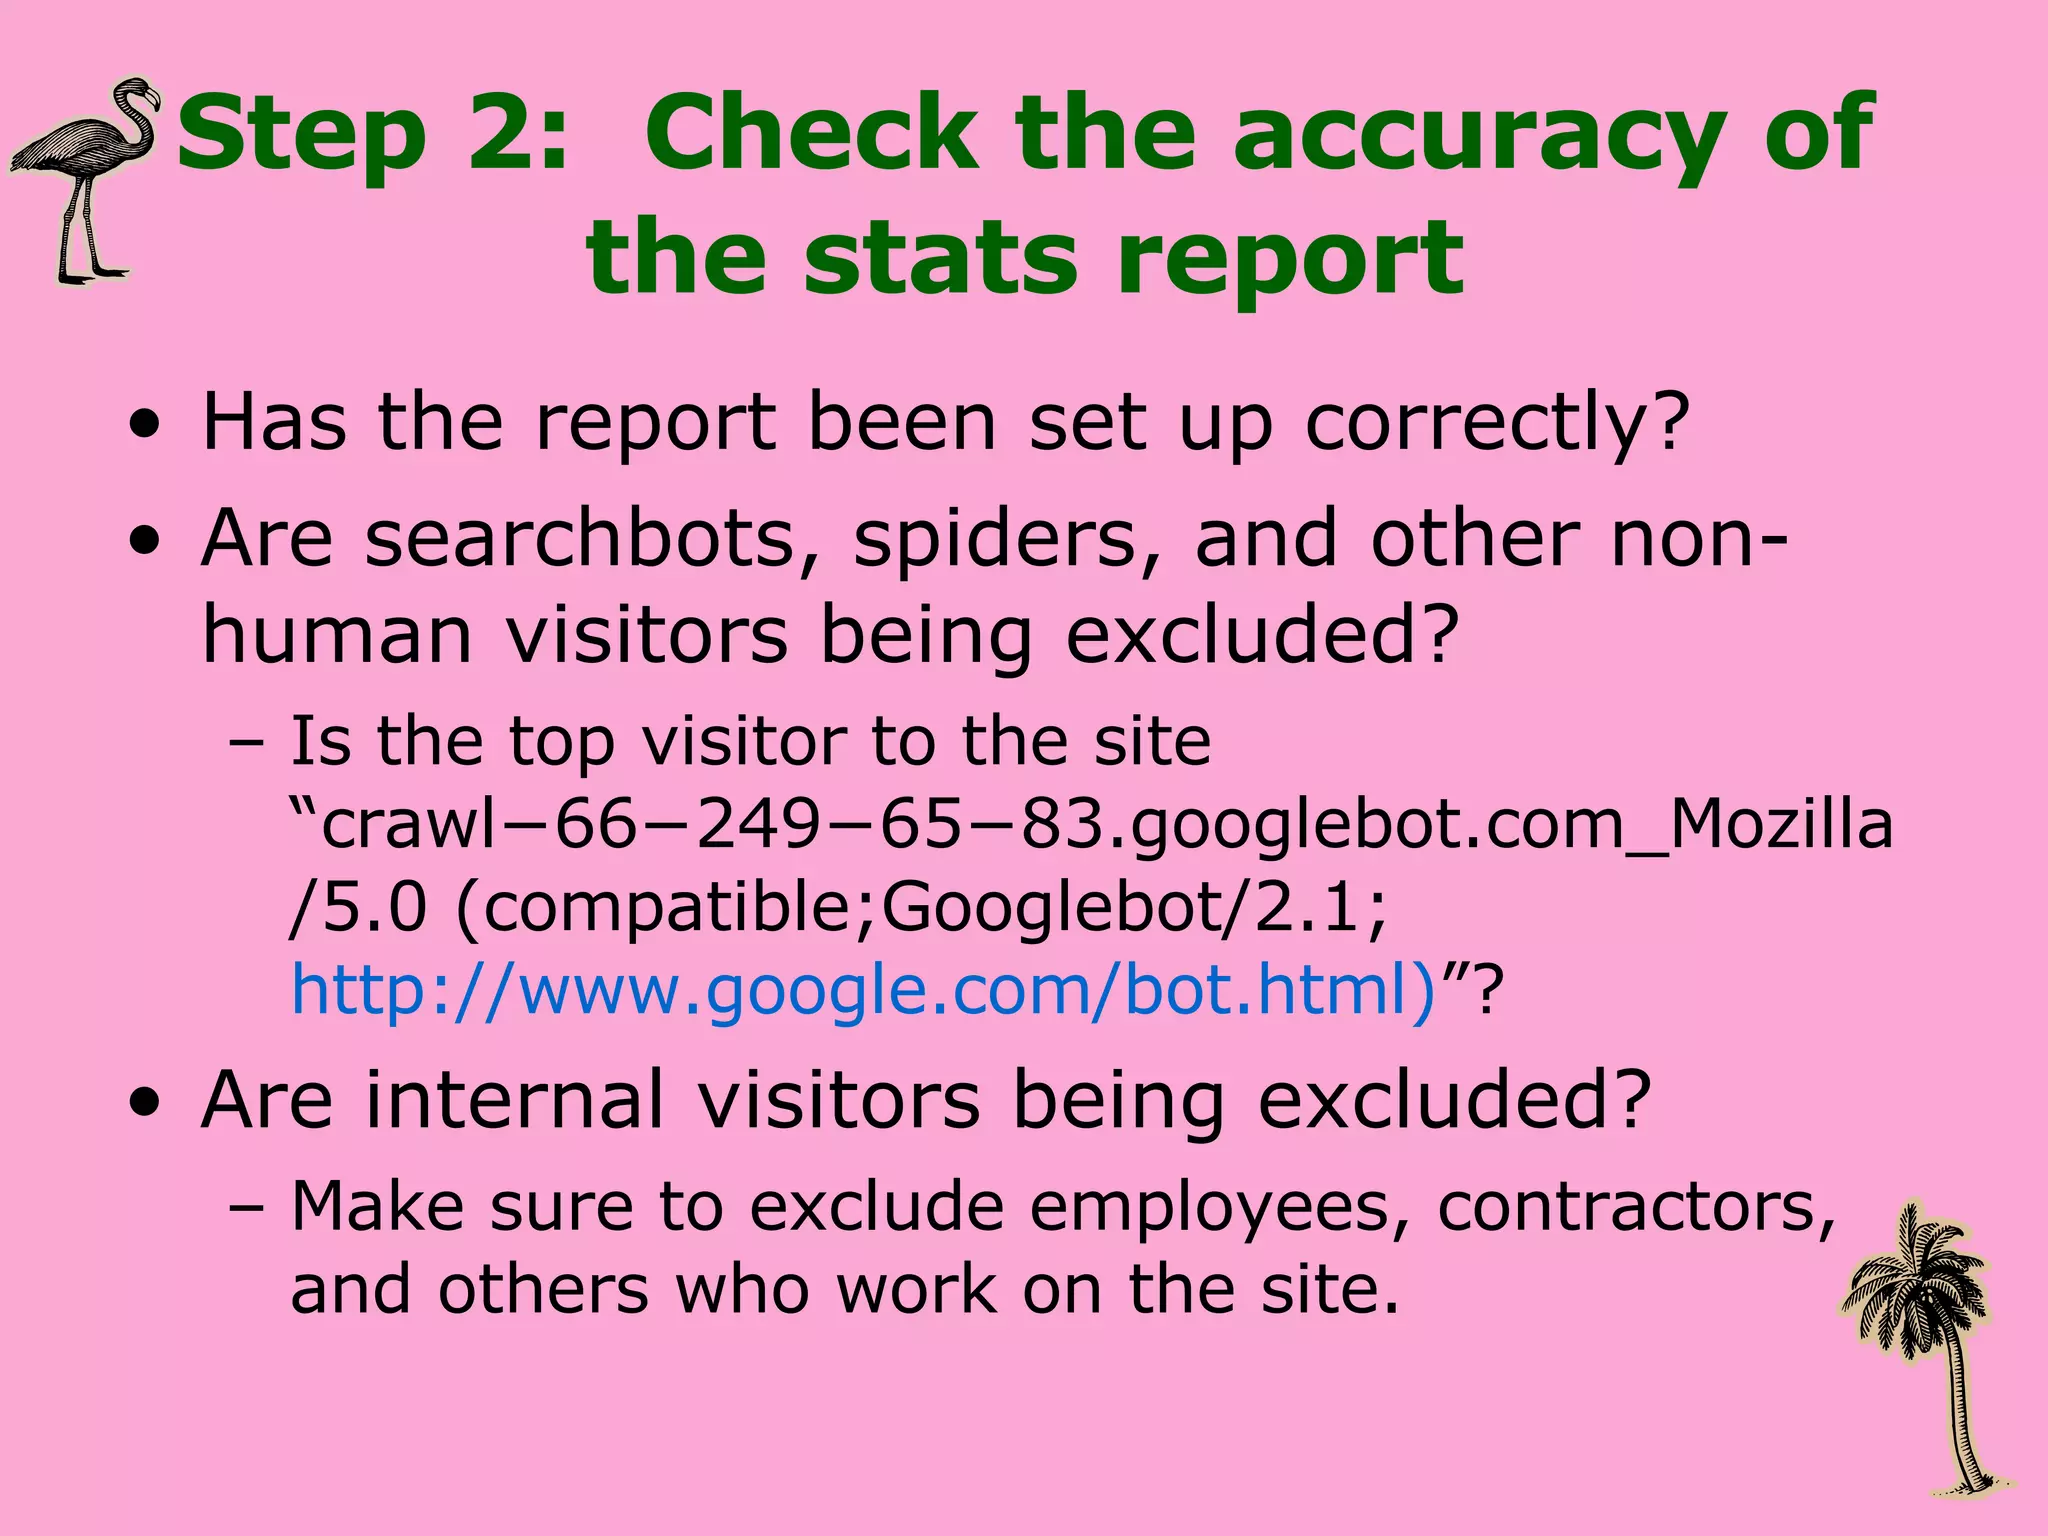
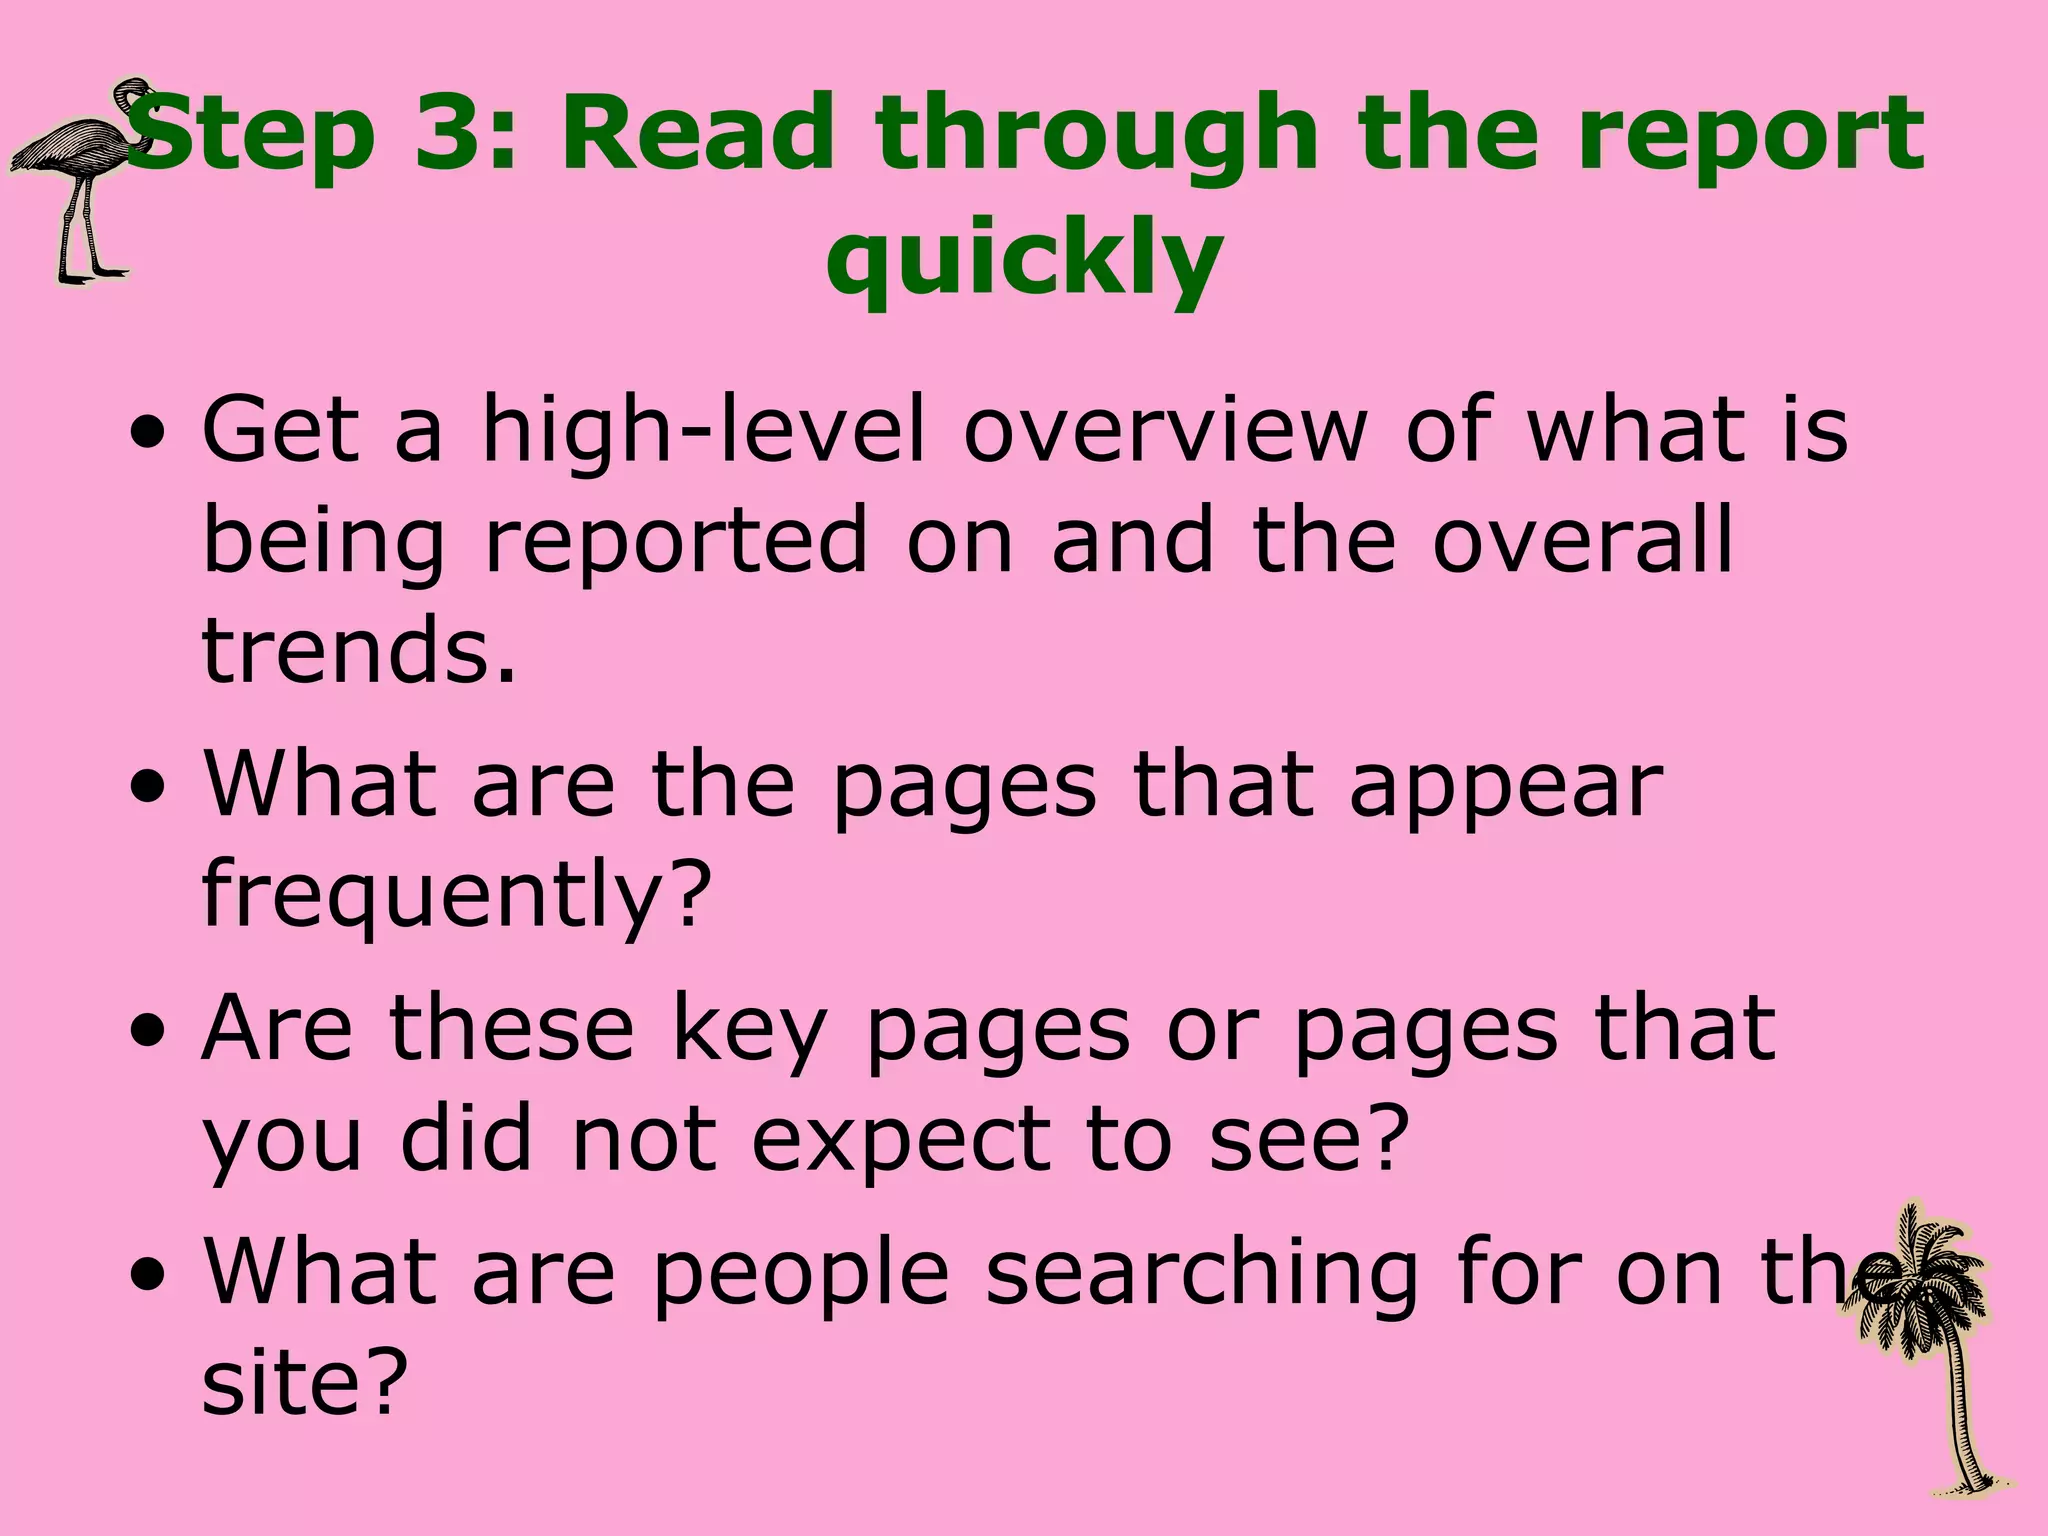
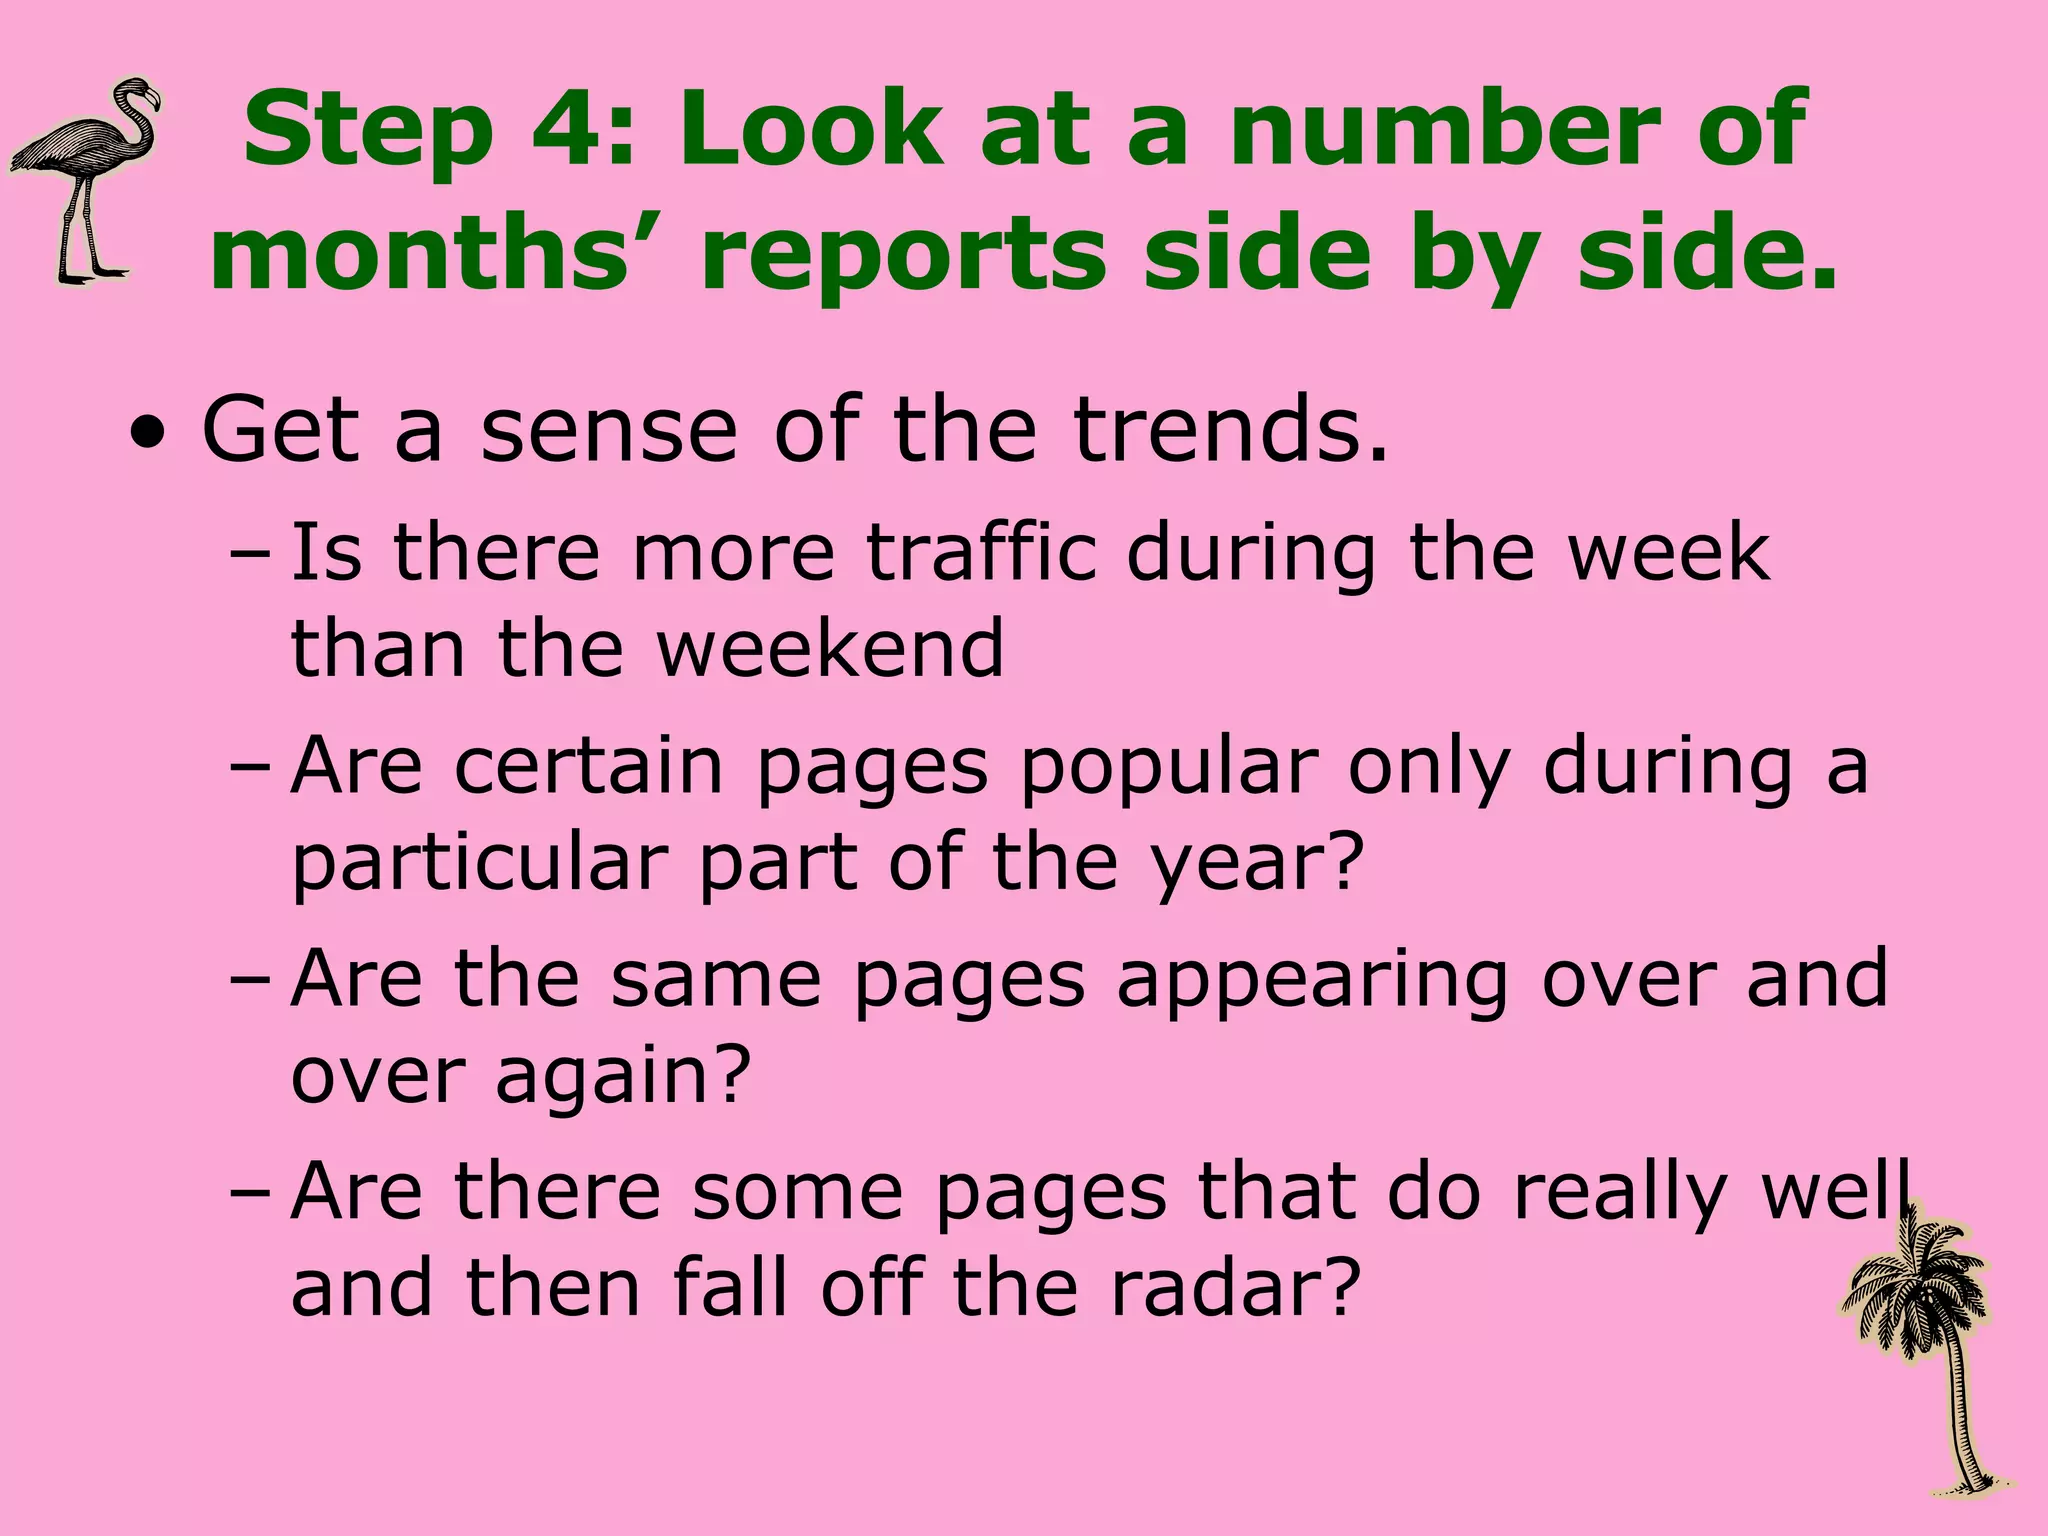
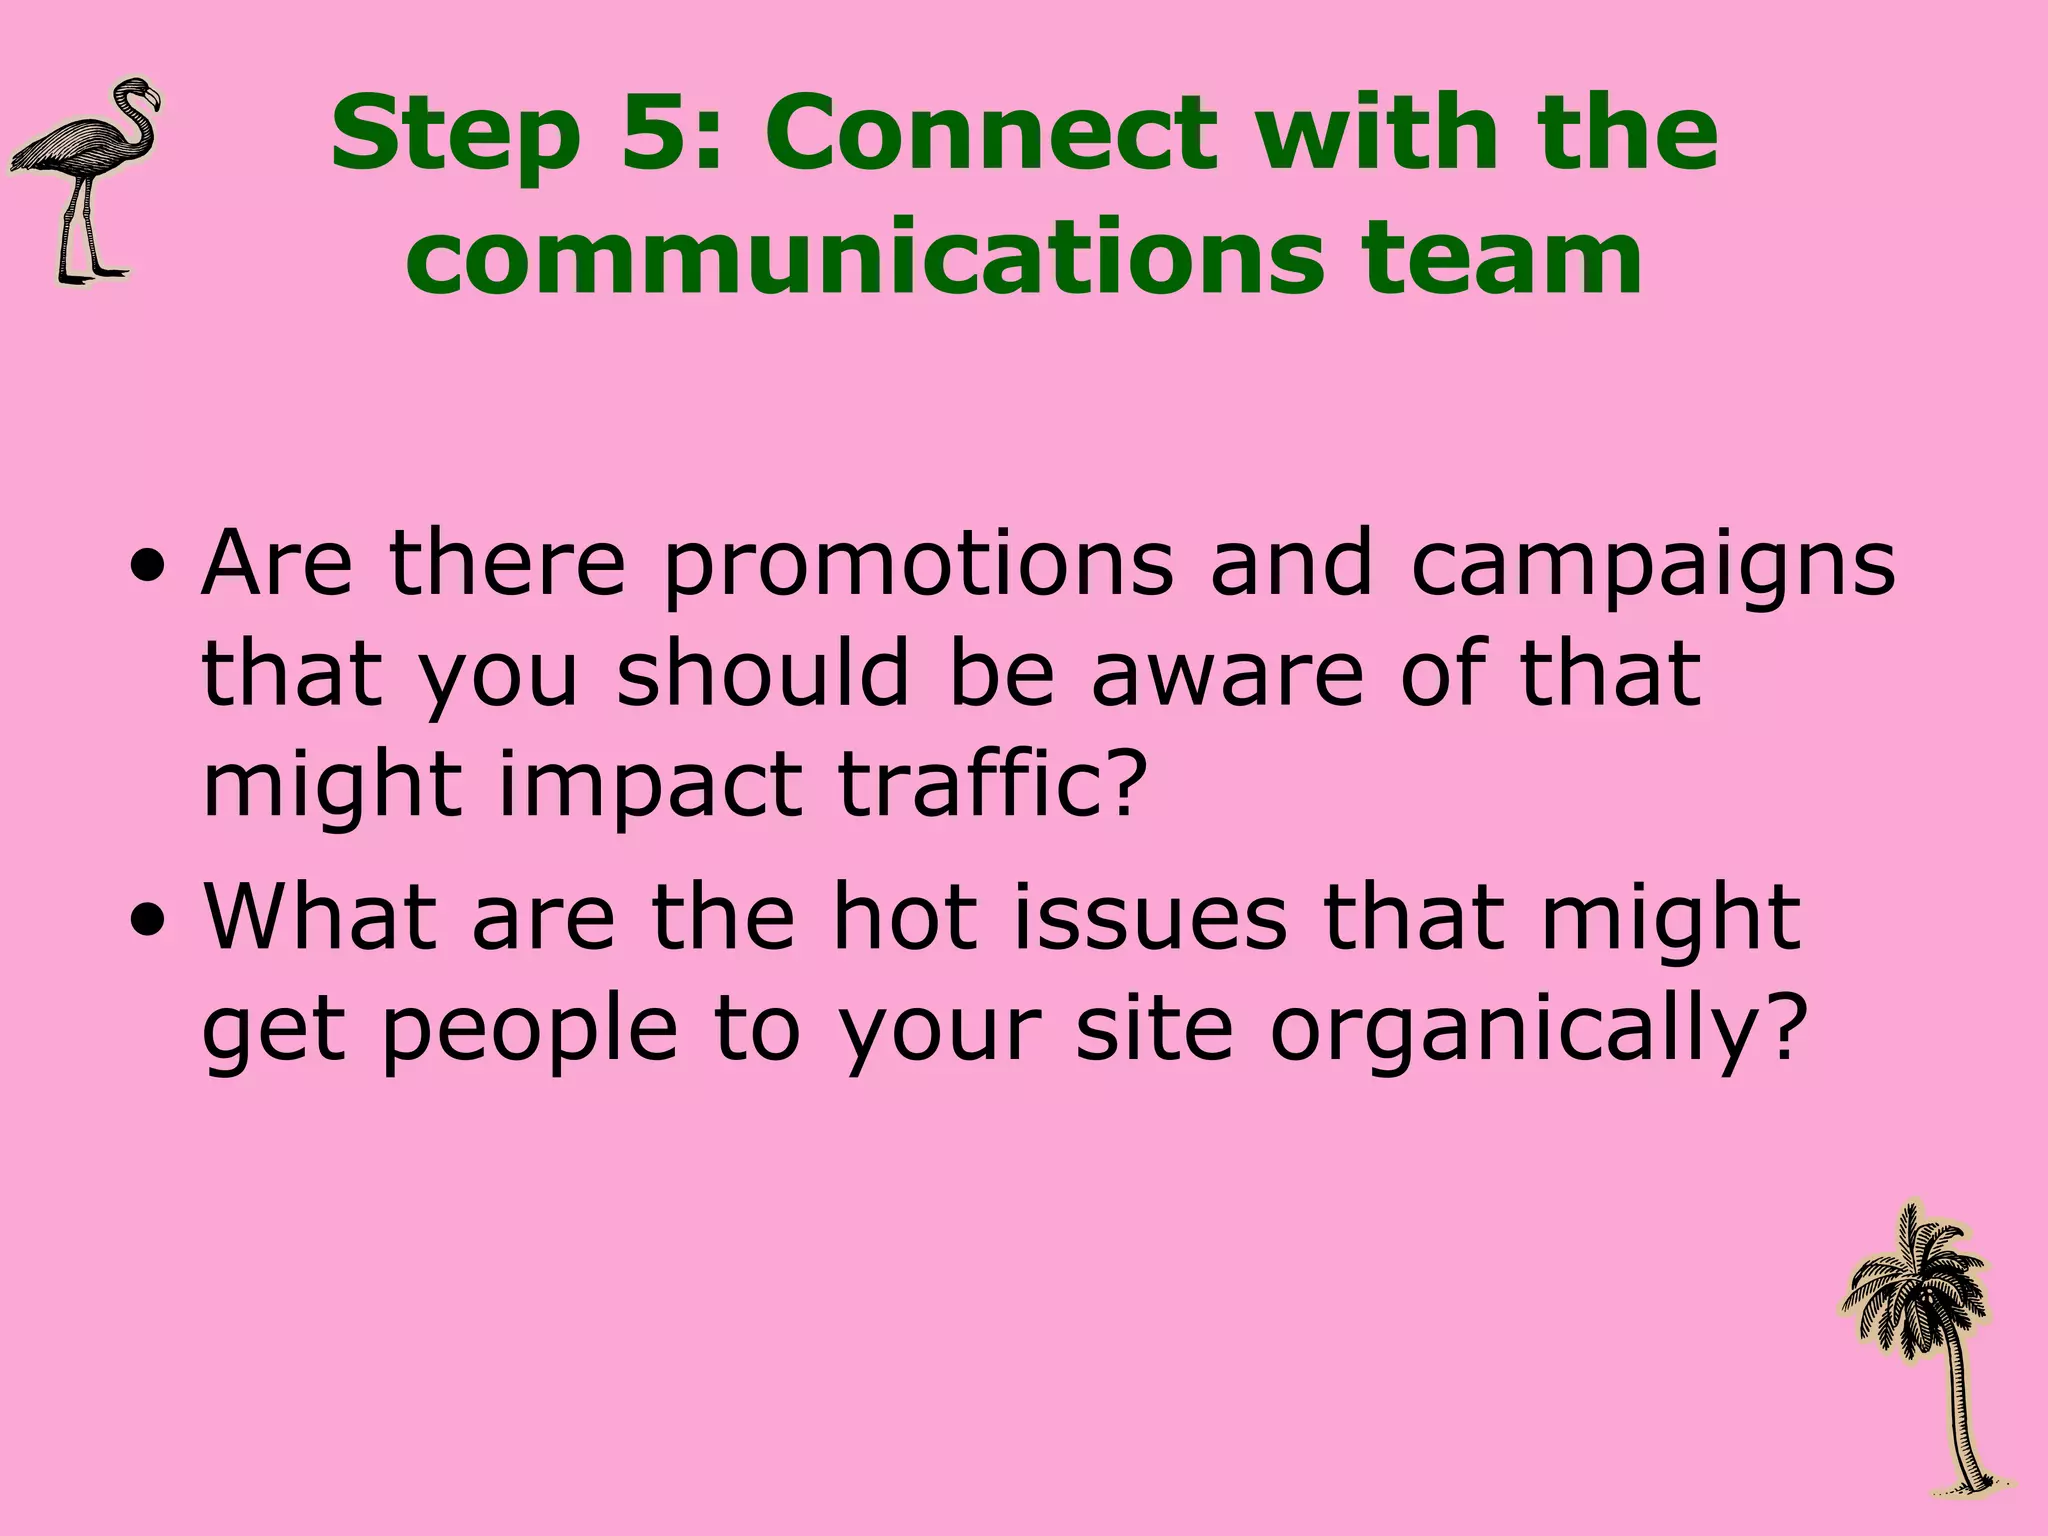
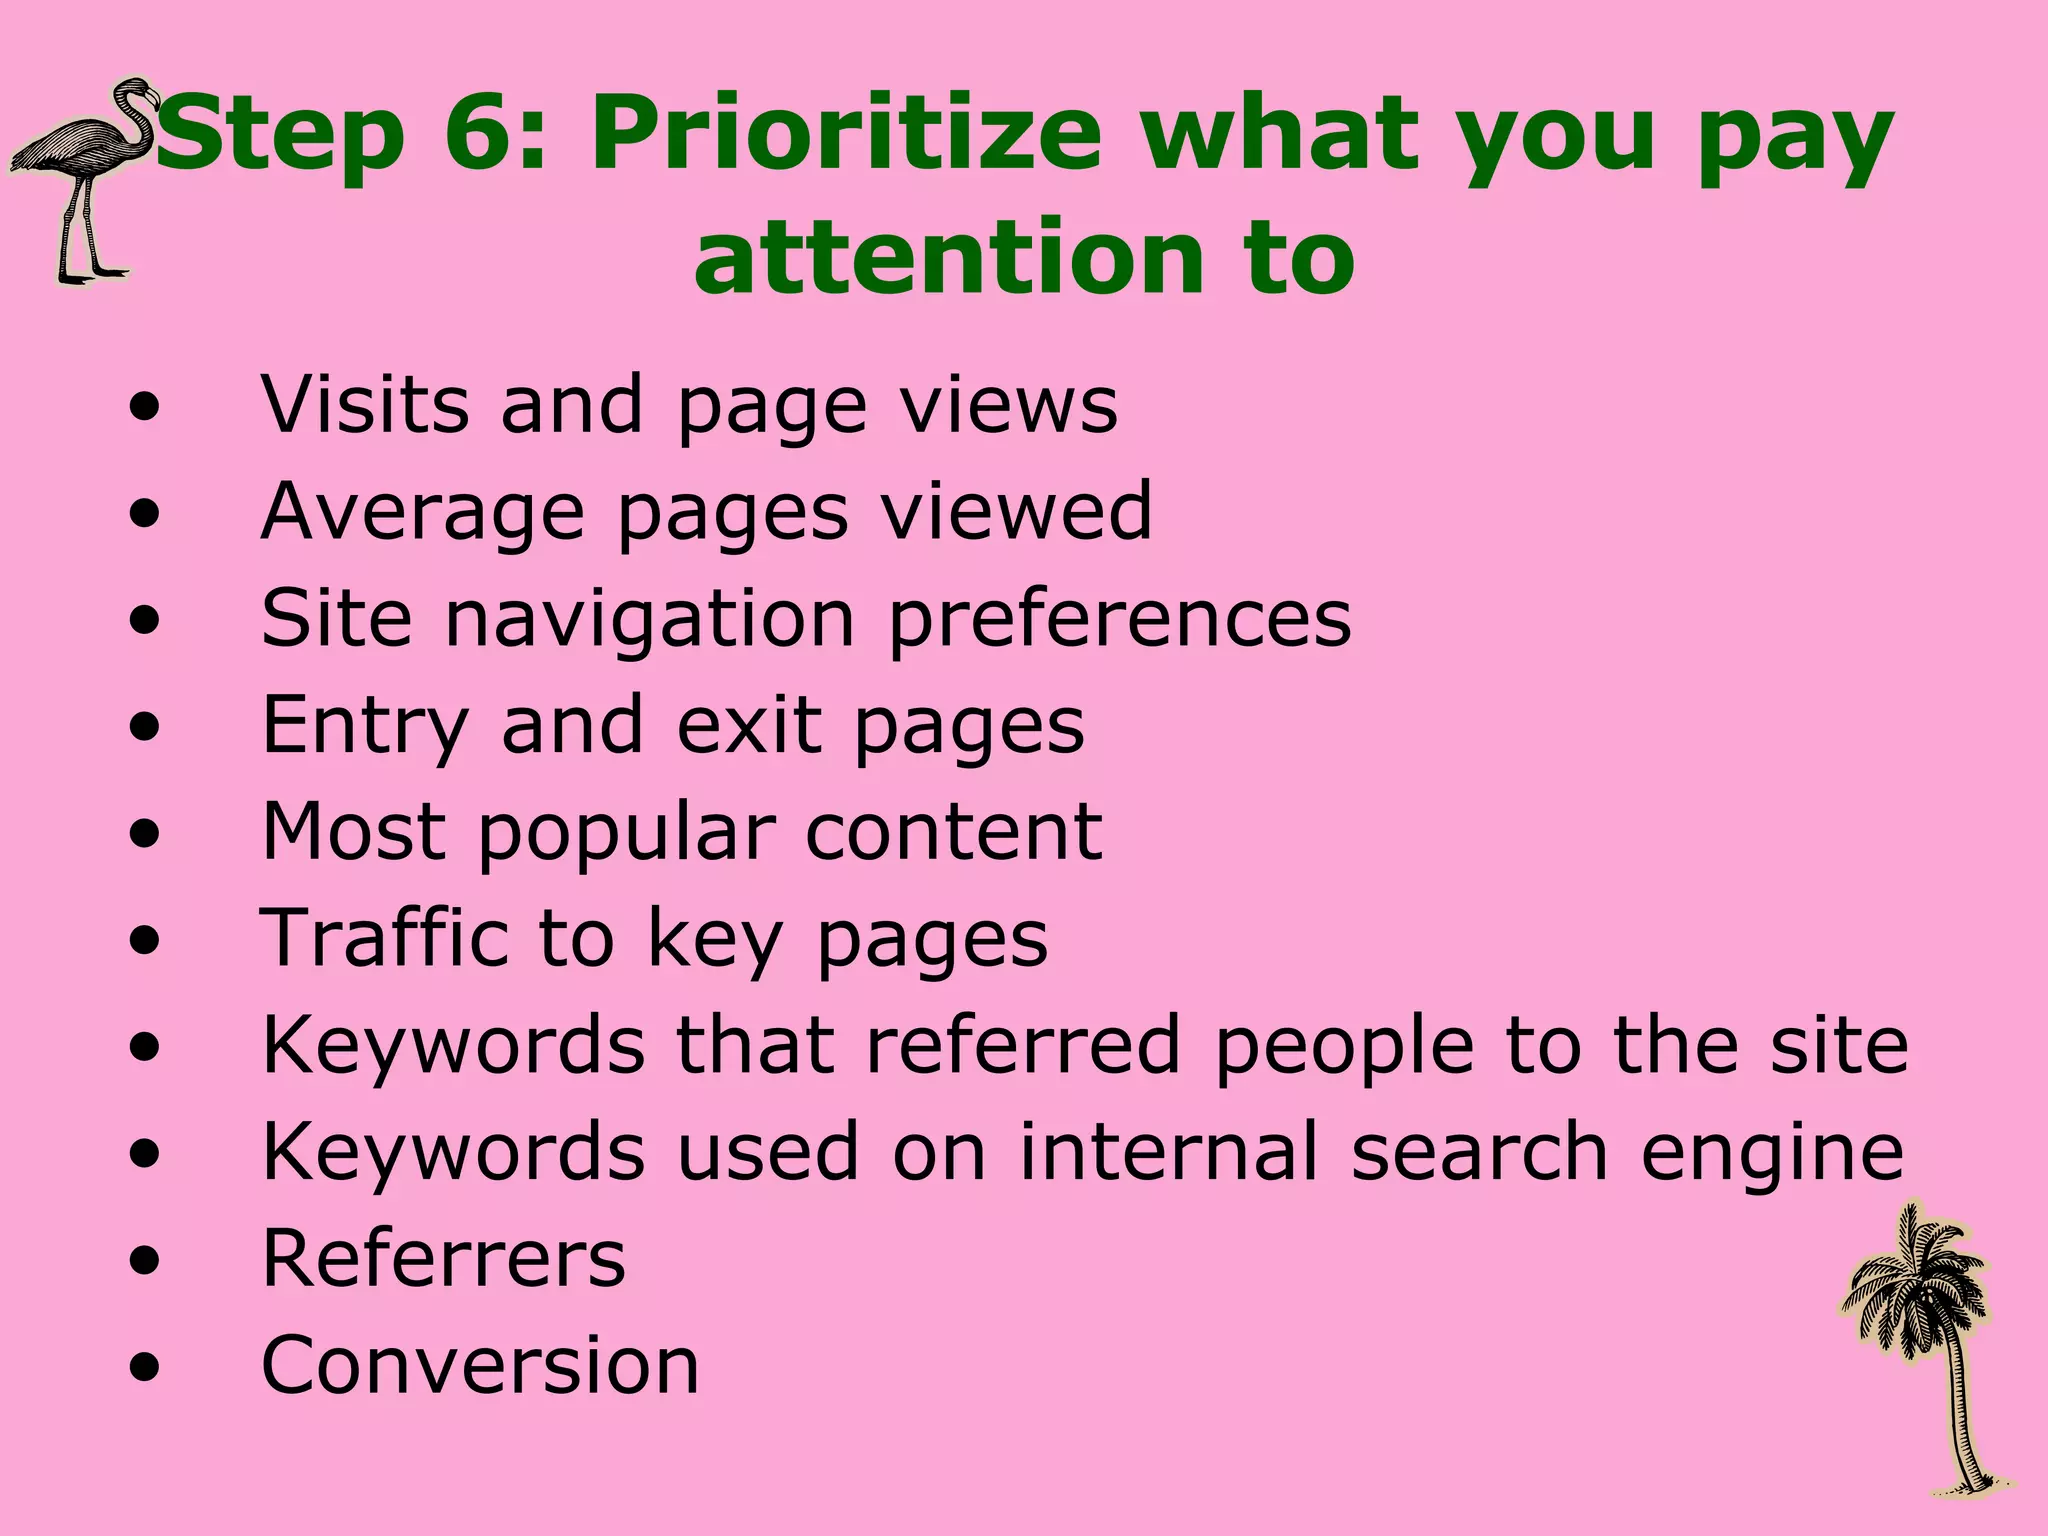
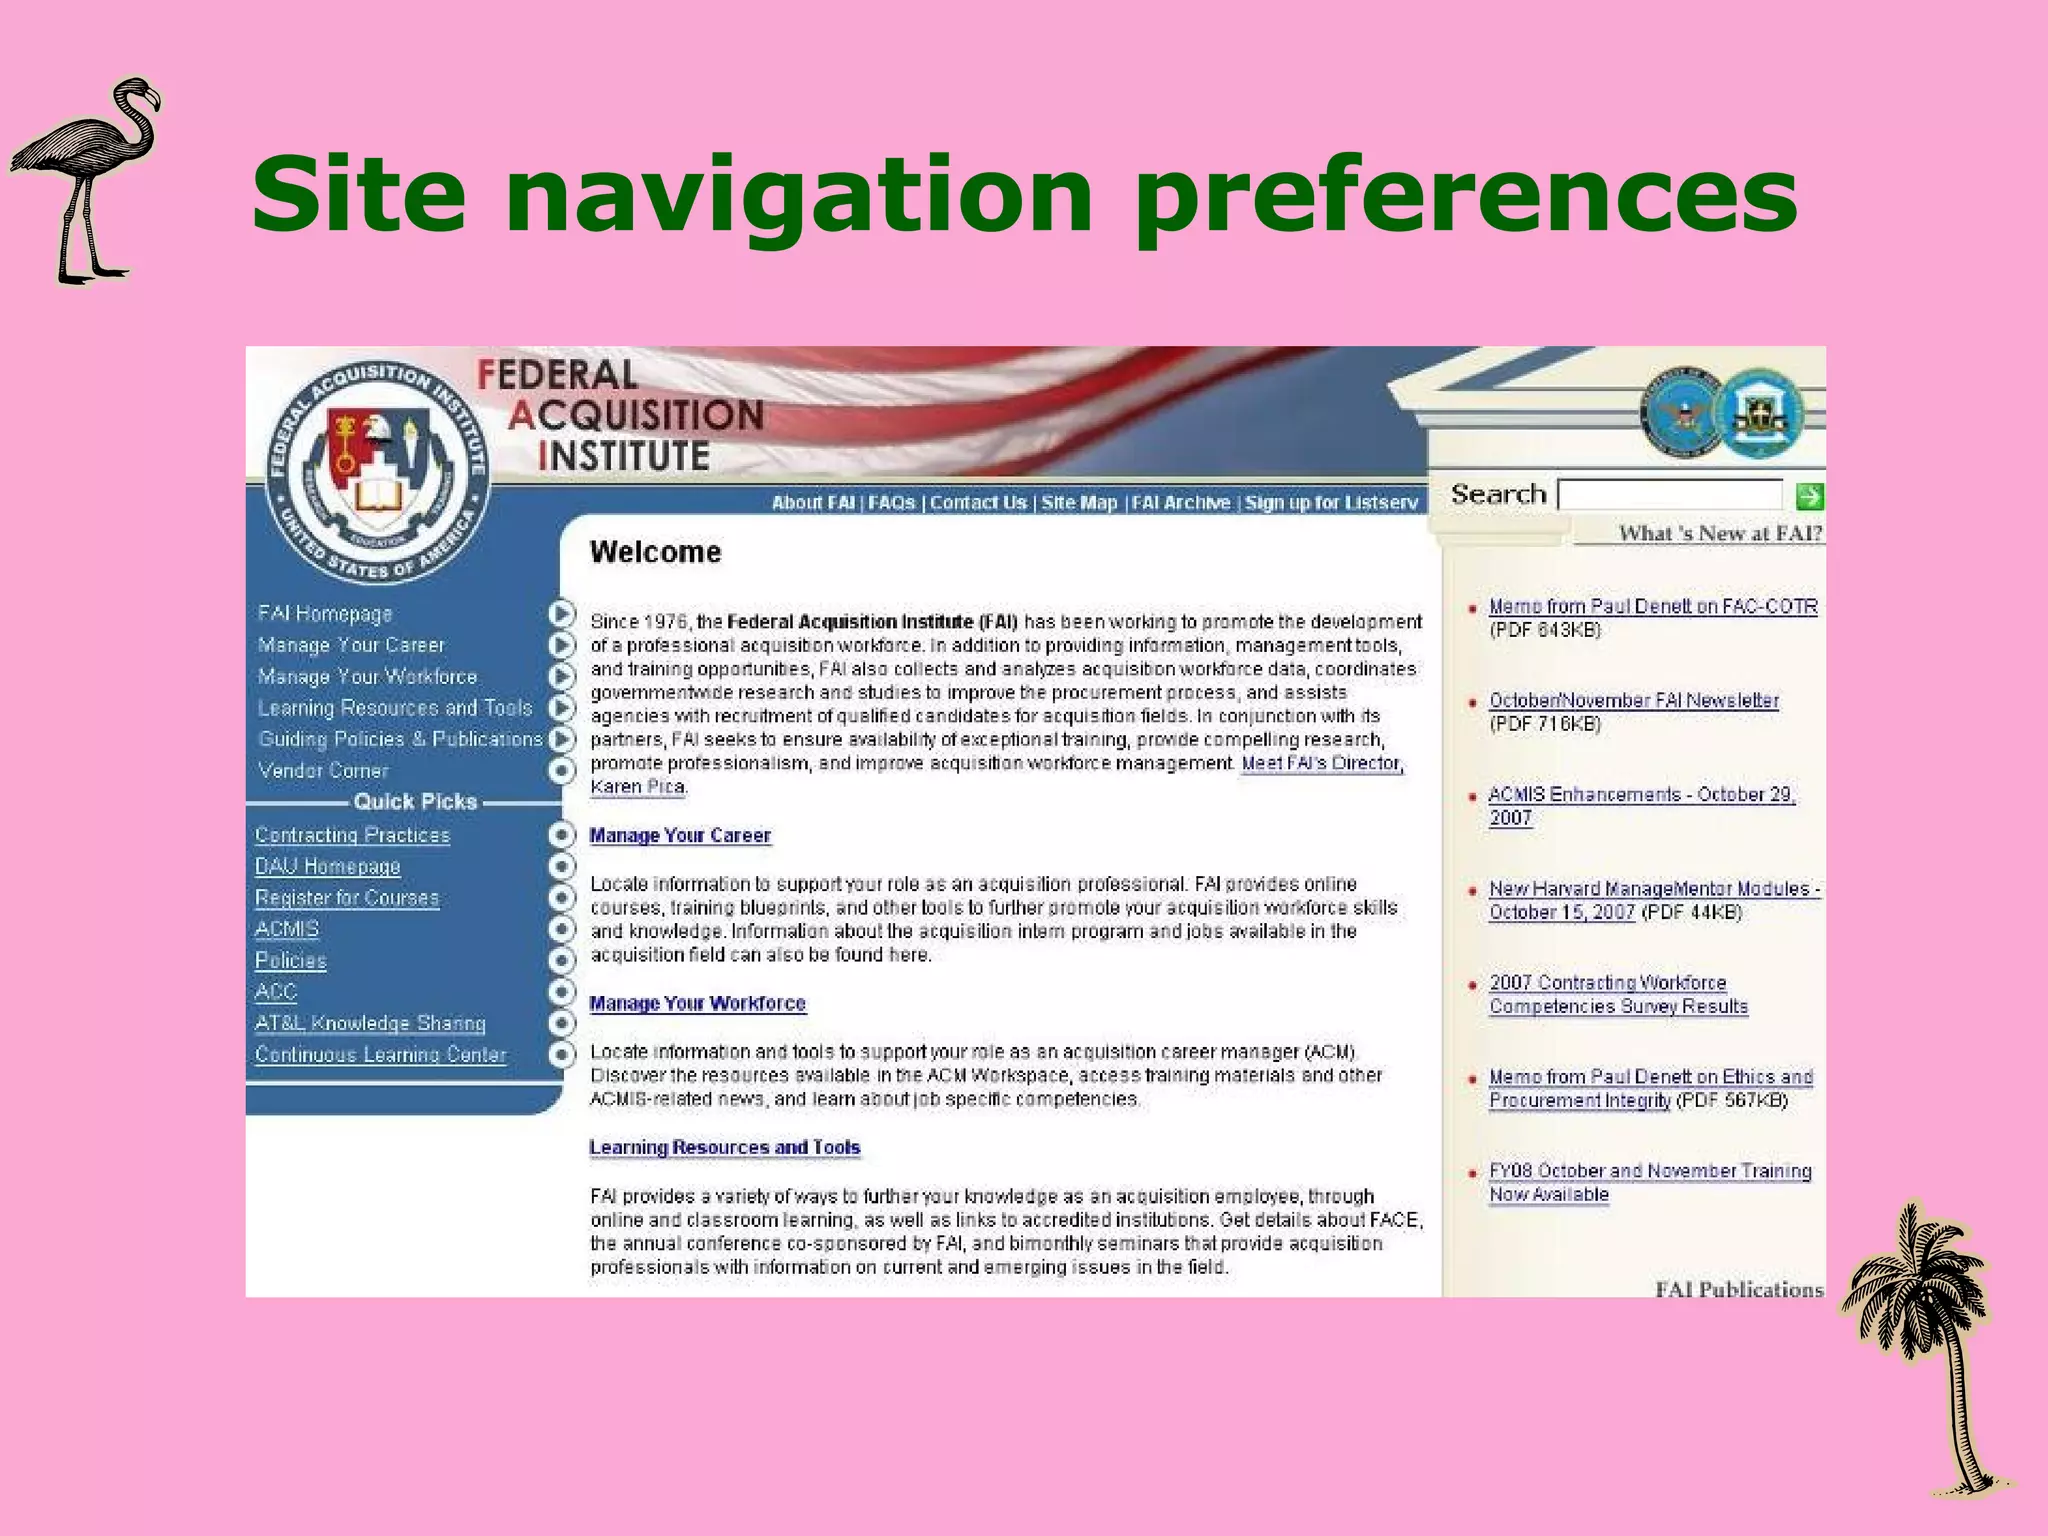
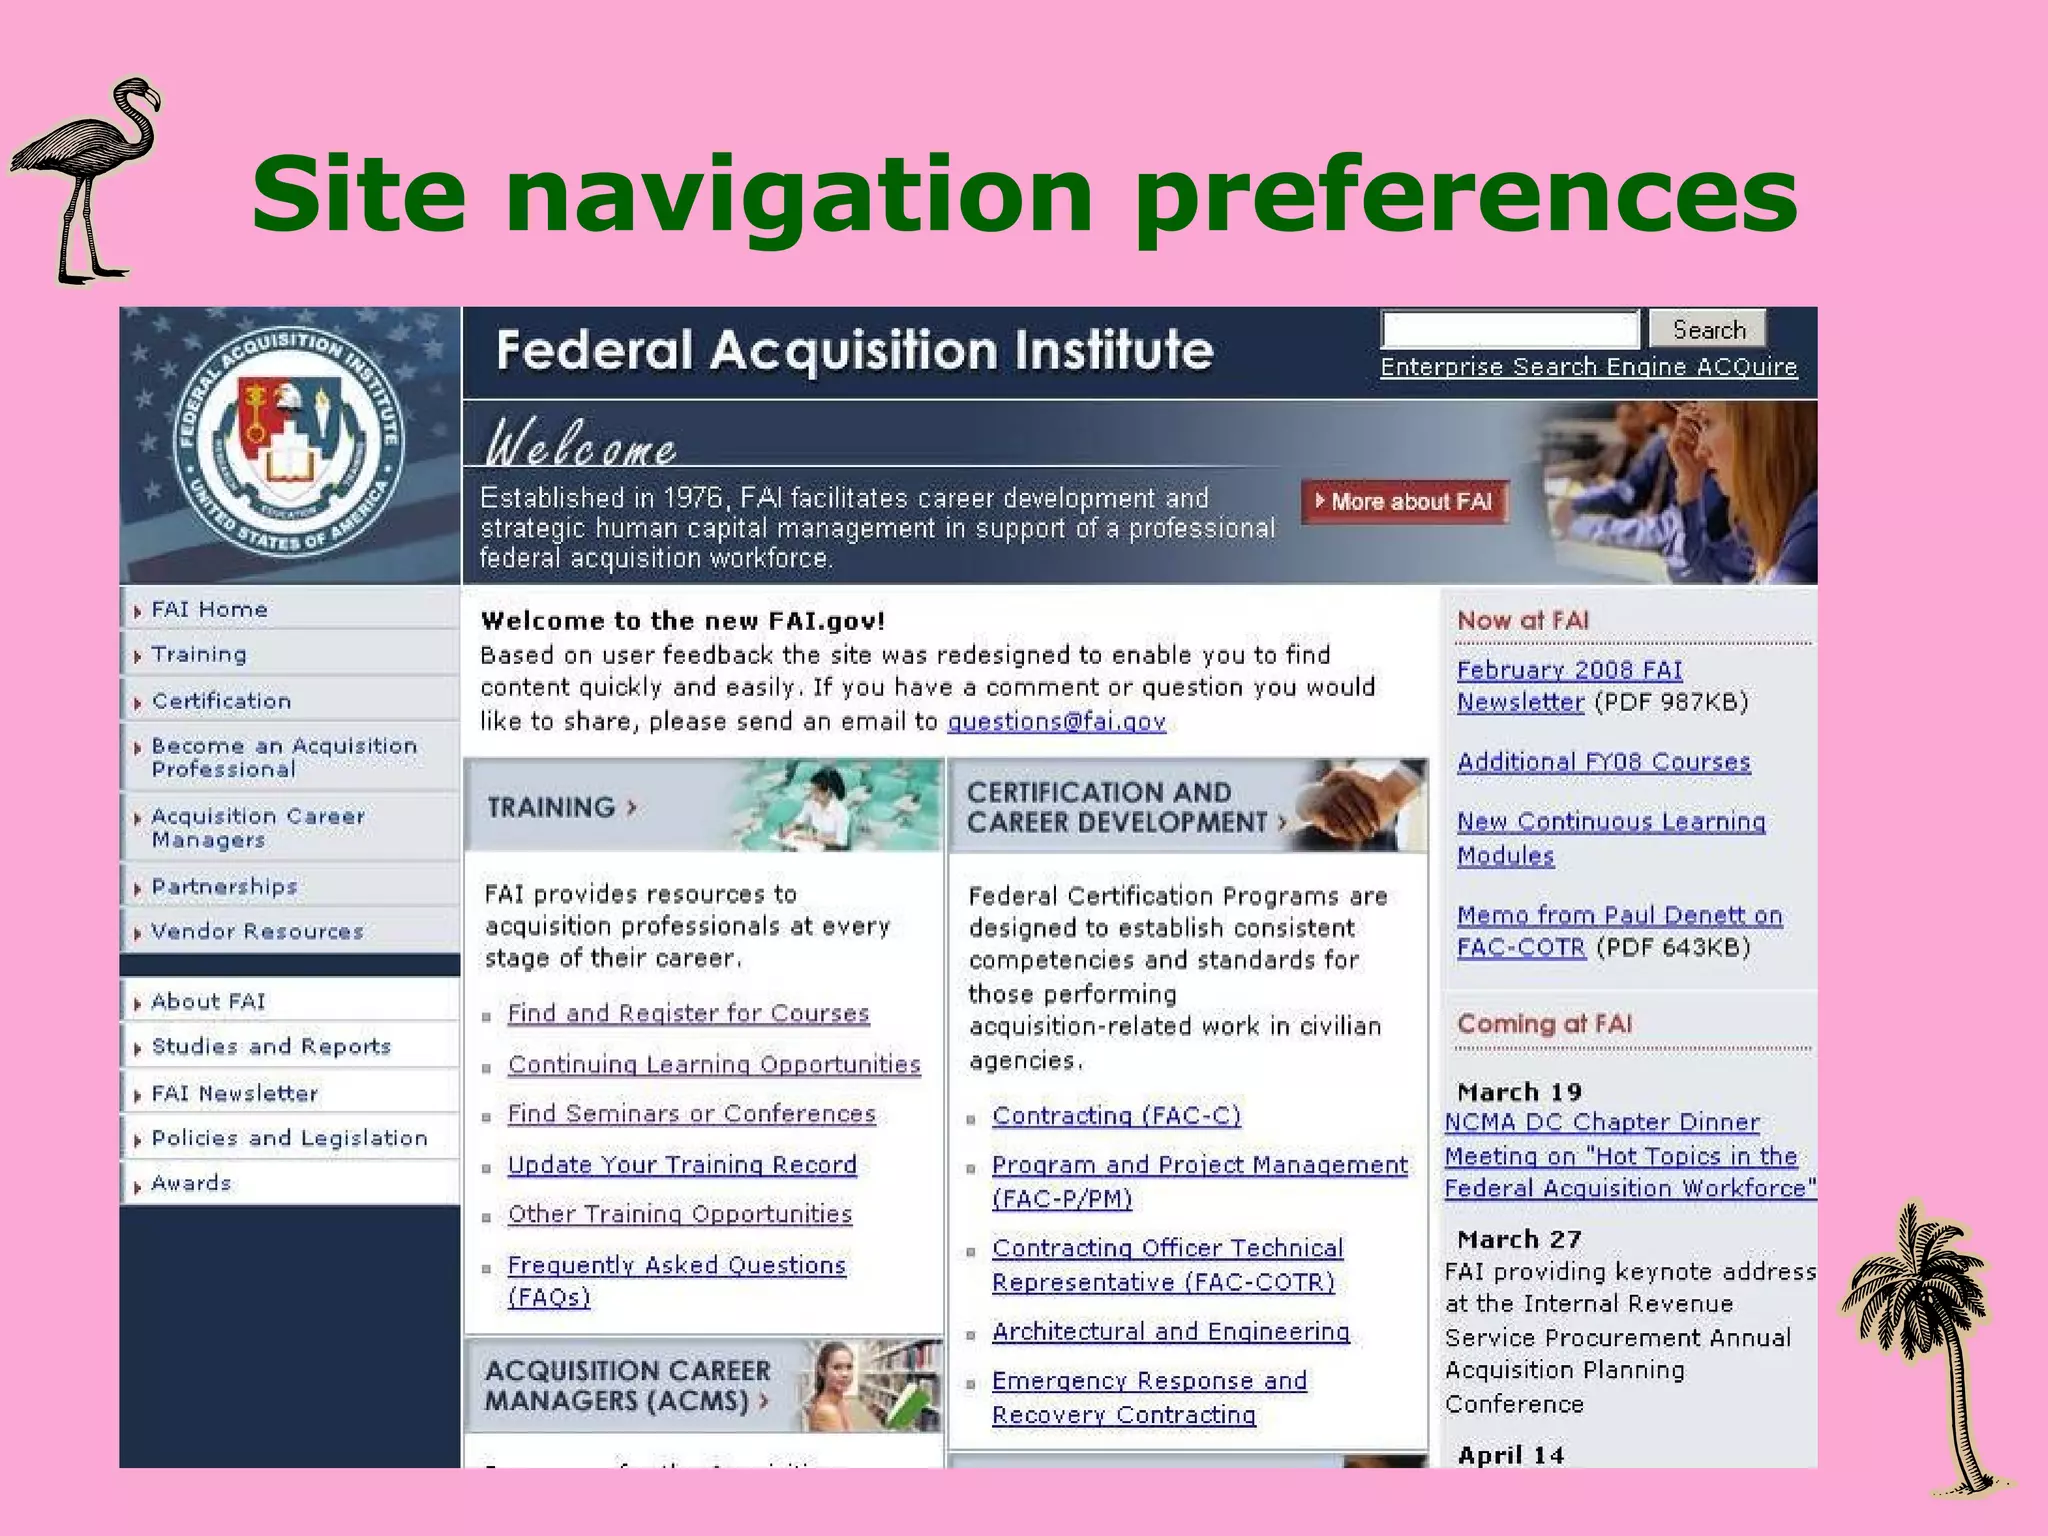

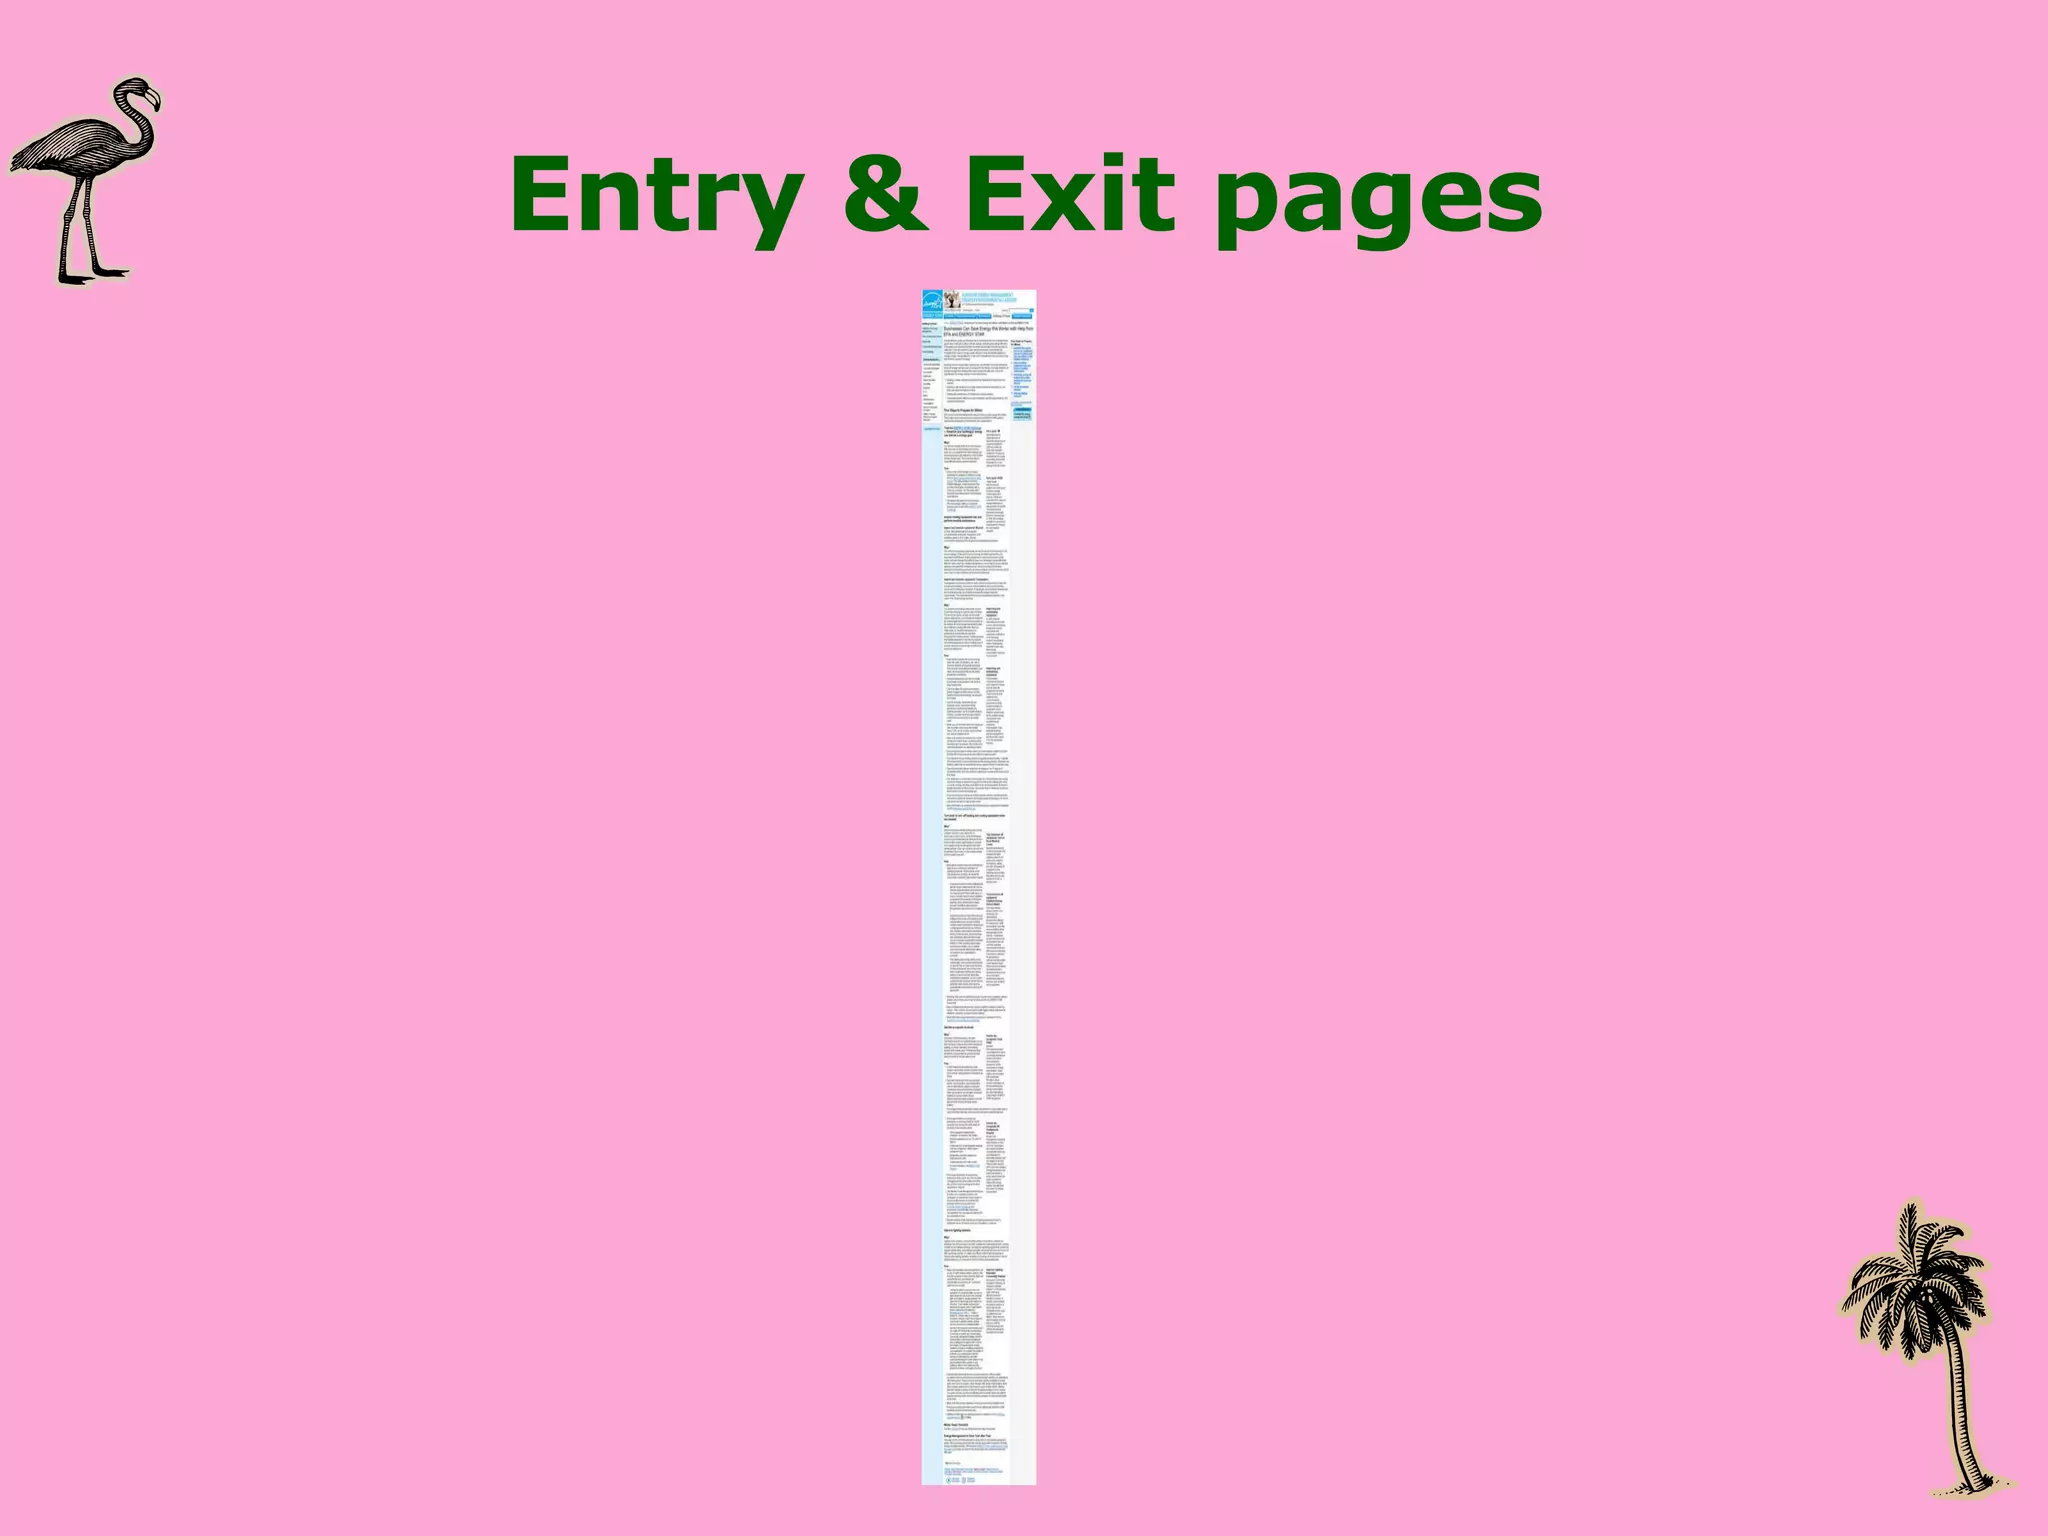


The document discusses integrating web analytics into information architecture and user-centered design. It defines web analytics and explains why it is important for information architects. It provides steps to implement a web analytics program, including checking analytics reports for accuracy, prioritizing metrics to analyze like visits, page views, site navigation, and keywords. The document emphasizes using web analytics to understand user behavior and identify areas for improvement, in order to better meet users' and business goals.