
Server Operating System Market Size and Share
Market Overview
| Study Period | 2020 - 2031 |
|---|---|
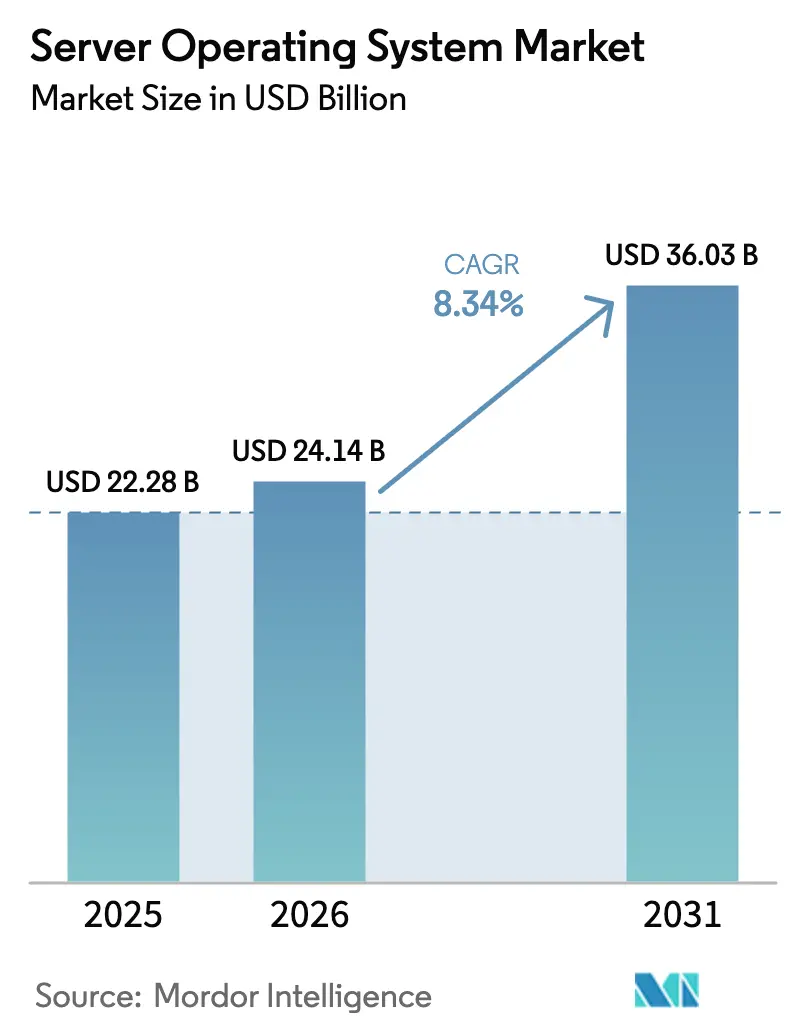
| Market Size (2026) | USD 24.14 Billion |
| Market Size (2031) | USD 36.03 Billion |
| Growth Rate (2026 - 2031) | 8.34 % |
| Fastest Growing Market | Asia Pacific |
| Largest Market | North America |
| Market Concentration | Medium |
Major Players *Disclaimer: Major Players sorted in no particular order Image © Mordor Intelligence. Reuse requires attribution under CC BY 4.0. | |
Server Operating System Market Analysis by Mordor Intelligence
Server Operating System Market size market size in 2026 is estimated at USD 24.14 billion, growing from 2025 value of USD 22.28 billion with 2031 projections showing USD 36.03 billion, growing at 8.34% CAGR over 2026-2031. Demand growth reflects enterprise-wide digital transformation, widespread cloud-first refresh cycles, and artificial intelligence workloads that need purpose-built operating system features. [1]Microsoft Corporation, “Microsoft 2024 Annual Report,” microsoft.com Vendor road maps emphasize hybrid management, container orchestration, and energy-aware scheduling, while buyer priorities center on lower total cost of ownership, hot-patch security, and license model flexibility. Hyperscale data-center expansion, edge build-outs tied to 5G, and cyber-insurance requirements are reinforcing the strategic value of future-ready server platforms. Competition is intensifying as commercial Linux distributions, Windows Server, and emerging ARM-optimized releases vie to shape the next phase of the server operating system market.
Key Report Takeaways
- By deployment mode, cloud installations captured 63.60% revenue in 2025, while hybrid environments expand the quickest at a 10.22% CAGR through 2031.
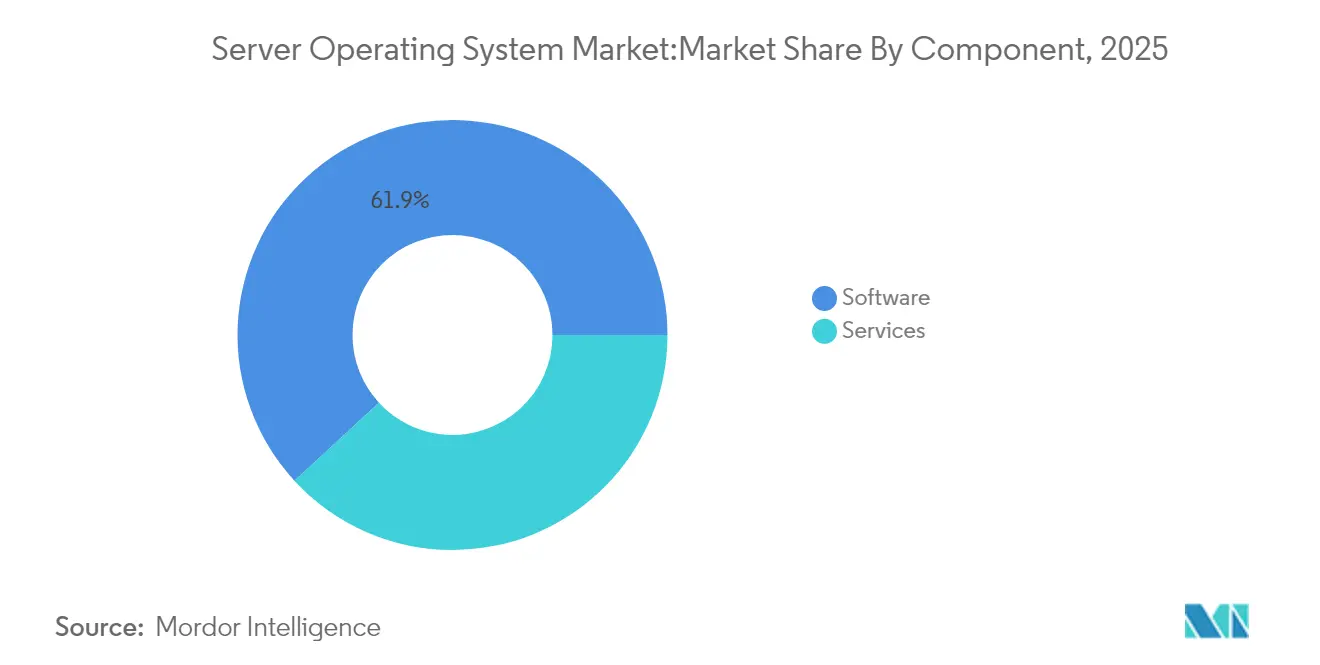
- By component, software held 61.85% of 2025 revenue; services register the fastest 10.58% CAGR as enterprises seek migration and integration support.
- By license model, commercial proprietary offerings commanded 39.10% share in 2025, whereas subscription-based SaaS operating systems grow at a 9.82% CAGR to 2031.
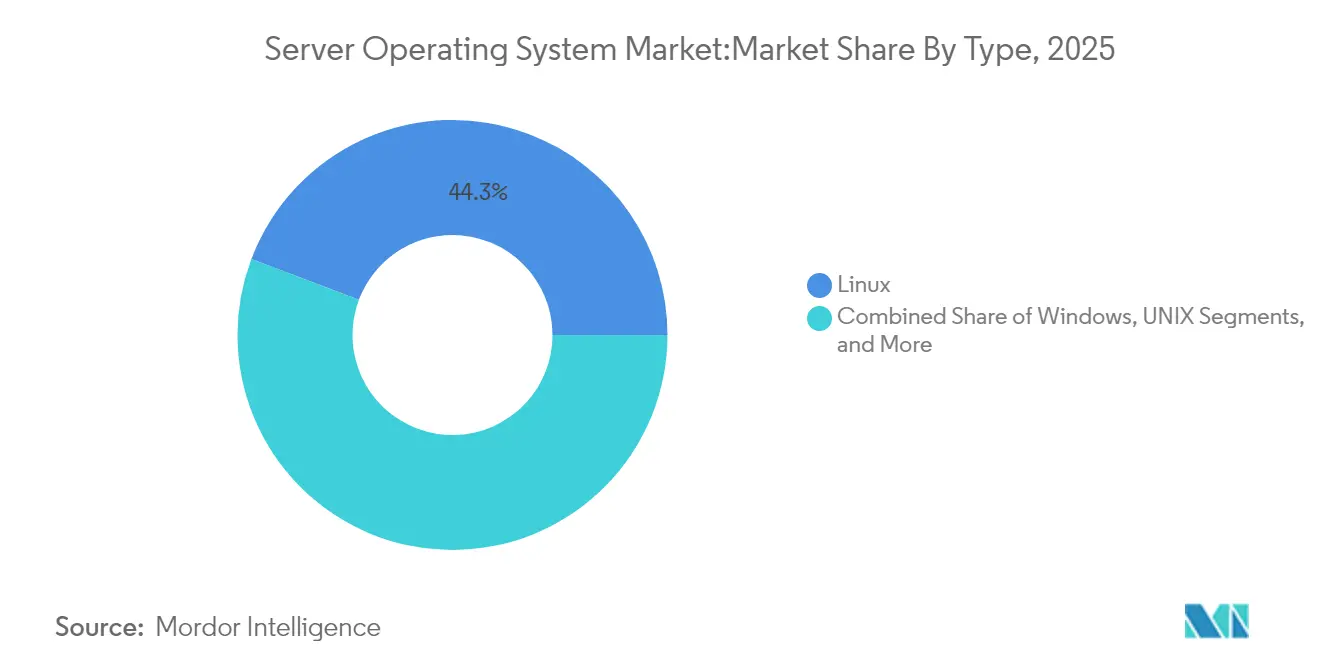
- By type, Linux led with 44.25% share in 2025, and Windows shows the highest 9.62% CAGR on the strength of Windows Server 2025 adoption.
- By server architecture, x86/x64 platforms controlled 56.05% of server operating system market share in 2025; ARM-based servers advance at a 9.47% CAGR to 2031.
- By virtualization status, virtual machines accounted for 59.70% of the server operating system market size in 2025, while containerized deployments rise at a 10.31% CAGR.
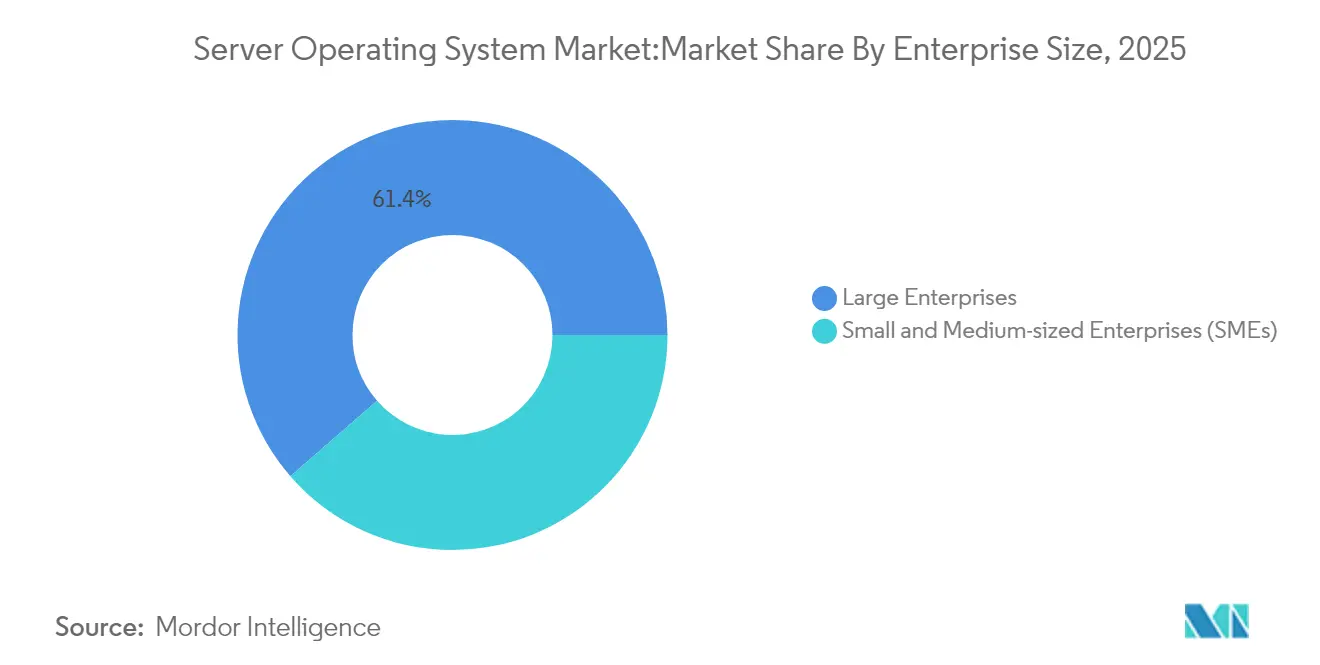
- By enterprise size, large organizations generated 61.40% of 2025 revenue, yet SMEs post the fastest 10.74% CAGR as managed services lower adoption barriers.
- By industry vertical, IT and Telecom supplied 27.55% revenue in 2025, whereas healthcare accelerates the most at a 9.91% CAGR on telemedicine and AI workloads.
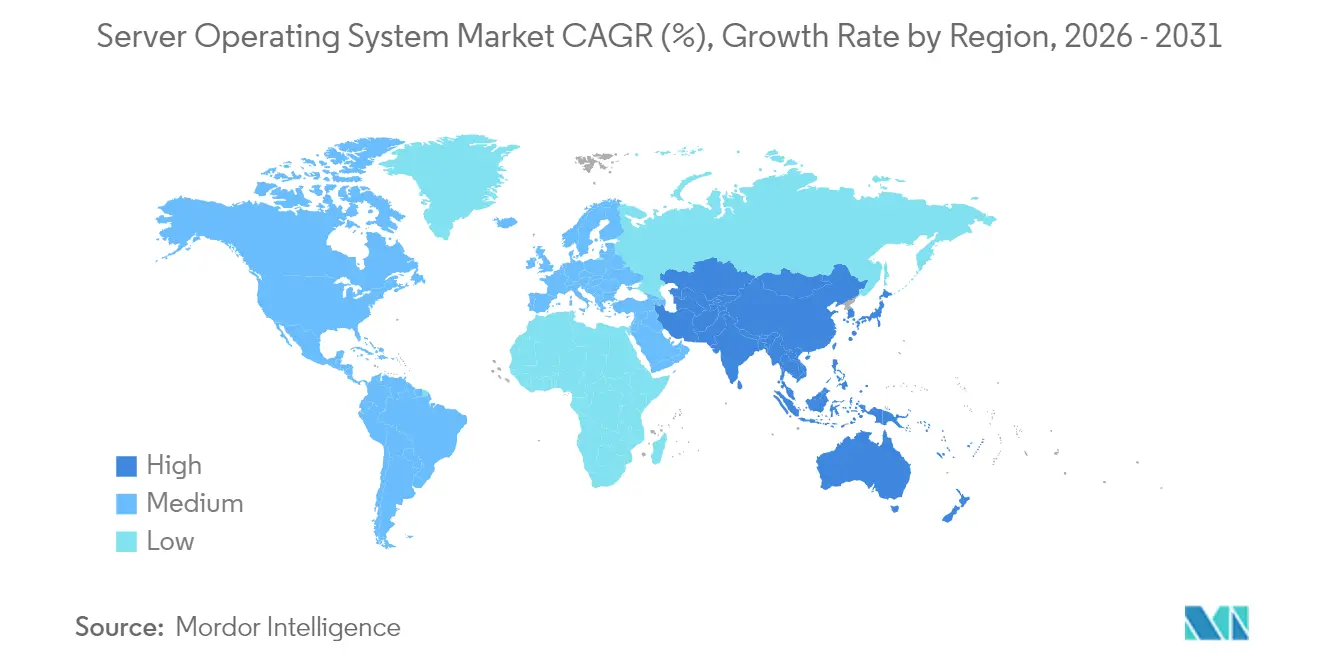
- By geography, North America led with 36.25% revenue in 2025, and Asia-Pacific records the highest 11.02% CAGR thanks to large-scale data-center investment.
- Microsoft, Red Hat, and SUSE jointly represented about 54.70% of 2025 commercial revenue, underscoring moderate concentration in the server operating system market.
Note: Market size and forecast figures in this report are generated using Mordor Intelligence’s proprietary estimation framework, updated with the latest available data and insights as of 2026.
Global Server Operating System Market Trends and Insights
Drivers Impact Analysis*
| Driver | (~) % Impact on CAGR Forecast | Geographic Relevance | Impact Timeline |
|---|---|---|---|
| Cloud-first enterprise refresh cycles | +2.1% | North America and EU with global roll-out | Medium term (2-4 years) |
| Hyperscale data-center build-outs | +1.8% | North America leading, APAC scaling | Long term (≥ 4 years) |
| Edge and 5G micro-data-center rollout | +1.4% | APAC core, spill-over to North America and EU | Medium term (2-4 years) |
| AI/ML workload proliferation | +2.3% | Early adoption in North America and China | Short term (≤ 2 years) |
| RISC-V server OS tool-chains mature | +0.8% | APAC focus, gradual EU and North America uptake | Long term (≥ 4 years) |
| Cyber-insurance compliance hardening | +1.2% | North America and EU, spreading worldwide | Medium term (2-4 years) |
| Source: Mordor Intelligence | |||
Cloud-first enterprise refresh cycles
Organizations are modernizing infrastructure beyond hardware replacement, choosing operating systems that deliver cloud parity on-premises. Windows Server 2025 brings native Azure Arc integration and hot-patch updates, cutting downtime and smoothing workload mobility Microsoft Corporation. Healthcare provider Kaleida Health projects USD 5–10 million in annual savings from hypervisor consolidation and software-defined infrastructure. [2]Cisco Systems, “Kaleida Health Case Study,” cisco.com Vendors court these needs; Red Hat now packages Enterprise Linux AI on Azure to simplify hybrid AI deployment Red Hat. Enterprises expect a single control plane, automated lifecycle management, and predictable cost models. The result is sustained demand for solutions that harmonize licensing, telemetry, and security across multi-location estates in the server operating system market.
Hyperscale data-center build-outs
Cloud providers keep raising capital intensity; Microsoft has earmarked USD 80 billion for AI-ready facilities, while Google plans USD 75 billion over the same horizon. Scale drives operating system redesign so that tens of thousands of nodes appear as one logical computer. Power capping, silicon accelerators, and telemetry APIs are embedded at the kernel level to extract every kilowatt. Warehousing compute at this magnitude spurs new distributions tailored to ARM and custom silicon, widening the addressable base of the server operating system market. Nuclear and renewable energy alliances highlight cost pressure, making energy-aware scheduling in the OS a competitive differentiator.
Edge and 5G micro-data-center rollout
Latency-sensitive use cases push compute to retail stores, cell towers, and factory floors. Red Hat’s MicroShift shrinks Kubernetes to fit fanless appliances, while SUSE Linux Enterprise Micro offers an immutable footprint for unattended sites. Hardware such as GIGABYTE E-series pairs with these OS builds to meet low-power, wide-temperature requirements. Operators demand zero-touch provisioning, self-healing, and secure boot. As 5G coverage widens, traffic steering between edge and core will depend on real-time telemetry integrated at the OS layer, expanding addressable opportunities across the server operating system market.
AI/ML workload proliferation
GPU partitioning, PCIe topology awareness, and high-bandwidth memory scheduling now sit inside mainstream server operating systems. Windows Server 2025 supports live GPU partitioning to enable multiple virtual machines per GPU. AMD positions EPYC platforms for everyday AI inference, requiring kernel patches for concurrent NUMA and GPU. Kubernetes adds elastic AI serving primitives. Operating systems that abstract heterogeneous accelerators give enterprises flexibility, pushing AI adoption deeper into verticals and lifting growth across the server operating system market.
Restraints Impact Analysis*
| Restraint | (~) % Impact on CAGR Forecast | Geographic Relevance | Impact Timeline |
|---|---|---|---|
| High migration and downtime costs | -1.6% | Global, large enterprise bias | Short term (≤ 2 years) |
| Rising zero-day vulnerabilities | -1.1% | Worldwide, acute in regulated industries | Medium term (2-4 years) |
| CentOS EOL license uncertainty | -0.9% | Global, most felt by cost-sensitive users | Short term (≤ 2 years) |
| Energy-efficiency regulations | -0.7% | EU lead, North America and APAC follow | Long term (≥ 4 years) |
| Source: Mordor Intelligence | |||
High migration and downtime costs
Moving mission-critical workloads can consume over USD 15,000 per terabyte when testing, staff retraining, and service windows are included, according to Hitachi Data Systems. Legacy application dependencies make direct upgrades risky, pushing some firms to virtualization wrappers. The CentOS sunset underscored exposure: 26% of scanned Linux servers needed replacement within months. Professional services surge as enterprises seek staged cut-overs that limit business disruption. Cost sensitivity slows near-term churn, tempering expansion of the server operating system market.
Rising zero-day vulnerabilities
Threat actors exploit new vectors faster than patch cycles close them. Hot-patch support in Windows Server 2025 shrinks reboot windows, yet many industries lack automated validation. Hardware-assisted isolation frameworks add layers but also complexity. Compliance audits and insurer questionnaires lengthen operations schedules. Security overhead weighs on budgets and can postpone refresh plans, creating friction that moderates the server operating system market trajectory.
*Our forecasts treat driver/restraint impacts as directional, not additive. The impact forecasts reflect baseline growth, mix effects, and variable interactions.
Segment Analysis
By Component: Services Navigate Integration Complexity
Software dominated with 61.85% revenue in 2025, anchored by subscription licensing and continuous update streams, and it remains the economic foundation of the server operating system market. Enterprises favor predictable operating expense profiles and direct tie-ins with cloud consoles, which strengthens vendor lock-in yet simplifies procurement. Vendors integrate telemetry, policy engines, and cost governance features, blurring traditional OS boundaries and expanding wallet share.Services record an 10.58% CAGR to 2031 as hybrid estates multiply. Migration from CentOS, mainframe offload projects, and edge rollouts all call for advisory, design, and managed services. Providers build packaged engagements that bundle licenses, tuning, and regulatory mapping. As operating environments scale to multicloud and edge, specialized managed service offerings become essential, sustaining momentum for the server operating system market.



By License Model: Subscriptions Shift Economics
Commercial proprietary licenses claimed 39.10% share in 2025, reflecting Windows Server’s hold on directory-centric workloads. However, subscription SaaS models top growth at 9.82% CAGR as enterprises trade capital expenditure for pay-as-you-go utility. Vendors like Red Hat refine per-core and per-node tiers that scale linearly with workload peaks.Community distributions lose ground following CentOS 7 end-of-life, steering production users toward supported variants. Enterprises cite compliance attestations and indemnification as justification for paid Linux. The evolution underscores how consumption-based pricing increasingly defines value in the server operating system market.
By Type: Linux Widens Use-Case Breadth
Linux held a 44.25% share in 2025 on strength in container, cloud, and HPC tasks. Windows enjoys a 9.62% CAGR through 2031, bolstered by ARM64 support and deep Azure integration. UNIX continues a secular decline as proprietary RISC hardware ages out, though pockets remain in telecom billing and financial trading.Workload alignment drives choice: Linux dominates cloud-native microservices, while Windows keeps traction in ERP and identity services. Emerging distributions tuned for AI pipelines and edge autonomy diversify options, extending competitive contours within the server operating system market.
By Server Architecture: ARM and RISC-V Broaden Instruction Diversity
x86/x64 led with 56.05% share in 2025. Competitive challenges arise as ARM garners 13.45% revenue share and posts a 9.47% CAGR on the back of cloud custom silicon programs. AMD’s share climb to 27.2% of server CPU shipments illustrates competitive churn. RISC-V pilots in China showcase open-ISA potential, with early workloads focusing on web serving and object storage. Operating systems that abstract multiple ISAs behind common management APIs strengthen relevance, opening new lanes for adoption across the server operating system market.
By Virtualization Status: Containers Accelerate Modernization
Virtual machines accounted for 59.70% of 2025 deployments, yet containers grow 10.31% CAGR as microservices architecture becomes mainstream. Kubernetes sets the default scheduling layer, and operating systems expose namespace, cgroup, and seccomp optimizations to raise density. Physical deployments persist where hardware pass-through or licensed per-socket software dictate bare-metal.Container-optimized OS variants featuring read-only root and OTA updates shrink attack surfaces. These attributes encourage regulated industries to bypass generalized images in favor of minimal footprints, expanding the reachable base of the server operating system market.

By Deployment Mode: Hybrid Links Cloud and Site
Cloud hosted installations form 63.60% of 2025 nodes. Hybrid placements deliver the highest 10.22% CAGR as firms balance latency, autonomy, and compliance. Windows Server 2025, plus Azure Arc and Red Hat Device Edge, show how vendors unify policy and monitoring across locations. On-premises footprints remain for data sovereignty and equipment amortization.Unified control planes, consistent secrets management, and workload-aware placement algorithms rise to checklist status. Vendors delivering these capabilities shape purchasing criteria, boosting their standing in the server operating system market.
By Enterprise Size: SMEs Embrace Managed Platforms
Large enterprises held 61.40% revenue in 2025, leveraging volume discounts and bespoke support. Still, SMEs deliver an 10.74% CAGR as cloud marketplaces and managed service providers package turnkey stacks. Korean MSP revenue jumped from KRW 7 trillion to KRW 12 trillion in 2024, demonstrating local ecosystem momentum.Low-touch licensing, automated patching, and bundled security compliance help SMEs leapfrog traditional IT buildouts. The democratization accelerates the overall penetration of the server operating system market.
By Industry Vertical: Healthcare Accelerates Modernization
IT and Telecom captured 27.55% of 2025 spend, driven by telco cloud initiatives and data-center refreshes. Healthcare posts the top 9.91% CAGR as telemedicine, imaging, and AI diagnostics demand secure, high-throughput platforms. HCA Healthcare’s OpenShift deployment illustrates real-time analytics gains. BFSI maintains steady demand anchored in stringent governance.Industry-specific compliance, such as HIPAA and PCI-DSS, places a premium on audit-ready kernels and long-term support. Accommodating these mandates steers product differentiation within the server operating system market.
Geography Analysis
North America led with 36.25% revenue in 2025, backed by hyperscale investments from Microsoft, Google, and AWS. Microsoft alone budgeted USD 80 billion for next-generation AI facilities. Canada’s forthcoming efficiency rules for computer room air conditioners emphasize sustainable infrastructure. Mexican manufacturing expansion adds industrial server demand, further anchoring regional leadership in the server operating system market.
Asia-Pacific delivers the fastest 11.02% CAGR to 2031. China’s cloud sector is on track to surpass CNY 1 trillion by 2025. South Korean MSP revenue gains and GPU server sales, which touched KRW 5.1 trillion in 2024 for 72.7% growth, underscore AI’s pull-through effect. Japanese audit tooling and security compliance reinforce demand for hardened platforms. Regional policy pushes domestic ISAs, making multiarc OS support a prerequisite, broadening adoption opportunities in the server operating system market.
Europe witnesses steady uptake as the Energy Efficiency Directive obliges operators above 100 kW IT load to publish energy KPIs by September 2024. Operators adopt OS telemetry extensions to meet mandatory reporting. Germany, France, and the United Kingdom drive enterprise refresh cycles, while Eastern members explore sovereign open-source stacks. Regulatory alignment shapes purchasing criteria, sustaining consistent growth for the server operating system market.

Regulatory Landscape
Regulation is increasingly targeting server operating systems through cybersecurity, software supply chain, and data center sustainability requirements. In the European Union, Regulation (EU) 2024/2847 (Cyber Resilience Act) introduces vulnerability reporting obligations starting September 11, 2026, with broader essential requirements enforceable from December 11, 2027. This raises the bar for patch governance, vulnerability disclosure processes, and secure-by-default configurations across both proprietary and Linux distributions used on servers and in virtualized and container environments.
Standards bodies and national regulators are converting these obligations into technical baselines that platforms must meet. ETSI published EN 304 635 on June 24, 2026, defining cybersecurity requirements for Virtualisation Execution Stacks and Container Execution Stacks, which directly affects server OS builds that host VMs and containers. In China, GB/T 20272-2026 (issued April 30, 2026 and effective November 1, 2026) sets technical specifications for operating system security, increasing compliance expectations for domestic and international OS vendors and for enterprises that deploy them.
Value Chain Analysis
The server operating system value chain spans upstream open-source projects and silicon enablement, core OS engineering and distribution, cloud marketplace packaging, and downstream integration and lifecycle services. Commercial vendors such as Microsoft, Red Hat, and SUSE sit at the center by curating kernels and packages, producing certified images for cloud and on-prem environments, and bundling management and security tooling that connects the OS to hybrid control planes. Hyperscalers and marketplaces also shape distribution by standardizing images and update mechanisms for cloud deployments, reinforcing consumption-led procurement for cloud and hybrid estates.
Downstream, systems integrators, managed service providers, and enterprise platform teams operationalize the OS through migration, hardening, observability, and compliance reporting. As a result, the OS is increasingly positioned as the enforcement layer for patching and policy. Security and provenance controls are becoming more value-chain critical as regulators and industry bodies push for auditable software supply chain practices. Initiatives such as FINOS OSERA (announced June 2026) reinforce the growing role of machine-readable evidence packs and standardized controls for regulated industries, influencing how OS vendors document components, vulnerabilities, and remediation across VM and container stacks.
Competitive Landscape
Competition remains moderate with Microsoft, Red Hat (IBM), and SUSE capturing an estimated 55% combined commercial revenue in 2024. Microsoft reinforces integration with Azure and introduces ARM64 builds while maintaining Active Directory dominance. Red Hat leverages OpenShift and Device Edge to extend Linux from core to edge. SUSE and Canonical focus on immutable, lightweight variants for container workloads. Oracle retains niche demand through highly tuned distributions for its database estate.
Architectural shifts alter the battlefield. ARM’s rise, AMD’s share gains, and experimental RISC-V pilots nudge vendors to broaden ISA support. Platform convergence emerges as a theme: operating system vendors fold observability, compliance scanning, and AI tool-chains into core subscriptions, blurring lines with adjacent software layers. Edge autonomy, AI scheduling, and energy telemetry form the next set of differentiators, steering share capture across the server operating system market.
Strategic moves show direction. IBM’s LinuxONE Emperor 5 embeds AI acceleration. [4]Tux Machines, “IBM Announces Powerhouse Linux Server,” tuxmachines.org Canonical extends 12-year LTS for Docker images. CoreSite partners with Oxide for hyperscale-grade on-prem cloud. Each action reflects a tilt toward lifecycle longevity, workload specificity, and sustainable operations that resonate with current buying criteria in the server operating system market.
Server Operating System Industry Leaders
Microsoft Corporation
Red Hat Inc. (IBM Corporation)
SUSE Group
Oracle Corporation
Amazon Web Services Inc.
- *Disclaimer: Major Players sorted in no particular order


Market Opportunities and Future Outlook
Hybrid enterprise Linux stacks are widening as cloud-native distributions and tooling extend beyond cloud-only deployments into on-premises and edge footprints. Microsoft expansion of Azure Linux 4.0 into a downloadable, enterprise-usable server distribution (with SELinux enforcing by default and FIPS 140-3 work in progress) creates a new option for organizations standardizing Linux across Azure and local environments. It also increases competitive pressure on paid distributions that dominate production workloads.
Compliance-led demand is opening whitespace for operating systems and services that provide verifiable supply chain provenance, VM and container execution stack hardening, and longer-life maintenance options that reduce forced migrations. EU CRA timelines (reporting obligations starting September 11, 2026) and ETSI EN 304 635 (June 2026) raise the bar for virtualization and container security requirements, while China GB/T 20272-2026 (effective November 1, 2026) tightens operating system security specifications. At the same time, ecosystem programs such as FINOS OSERA (June 2026) and cloud-to-OS partnerships, including Red Hat and AWS, point to monetization building around compliant, AI-ready, and operationally automated server OS stacks rather than the kernel alone.
Recent Industry Developments
- July 2026: Microsoft: Azure Linux 4.0 released as a standalone server distribution for on-premises and VM deployments. The initiative supports hybrid cloud and server OS consolidation, enabling enterprises to run Linux and Windows workloads from a unified platform. The action expands Windows/Linux OS options in data centers and supports AI-first workloads in hybrid environments.
- July 2026: Microsoft: Windows Server vNext Preview Build 29621 released with Trusted Launch, ReFS Boot, and NVMe-over-Fabrics support. The release introduces next-generation OS capabilities for secure and scalable servers. It signals ongoing OS feature evolution to compete with Linux distributions and cloud-native stacks.
- July 2026: IBM and Red Hat: Lightwell with new commercial offerings expanded (partners include AWS, AMD, F5, GitLab, Intel, and Microsoft). The expansion reflects an open-source OS ecosystem expansion for AI-era workloads. It strengthens open-source OS portfolio integration across cloud and on-premises for enterprise AI workloads.


Research Methodology Framework and Report Scope
Market Definition and Coverage
This market covers server operating system software and related services used to run and manage server hardware, handle workloads, and support enterprise and cloud infrastructure across on-premise and hosted environments.
Scope exclusions: We exclude client operating systems, application software, and general IT services that are not tied to server OS licensing, subscriptions, support, or OS-linked maintenance.
Segmentation Overview
- By Component
- Software
- Services
- By License Model
- Commercial Proprietary
- Paid Linux Distribution
- Community Linux Distribution (Free)
- Subscription-based SaaS OS
- By Type
- Windows
- Linux
- UNIX
- Others
- By Server Architecture
- x86/x64
- ARM
- RISC-V
- POWER
- Others
- By Virtualization Status
- Virtual Server
- Physical Server
- Containerised Environment
- By Deployment Mode
- Cloud
- On-premise
- Hybrid
- By Enterprise Size
- Large Enterprises
- Small and Medium-sized Enterprises (SMEs)
- By Industry Vertical
- IT and Telecom
- BFSI
- Manufacturing
- Retail and E-Commerce
- Government
- Healthcare
- Media and Entertainment
- Other Industry Verticals
- By Geography
- North America
- United States
- Canada
- Mexico
- South America
- Brazil
- Argentina
- Chile
- Rest of South America
- Europe
- Germany
- United Kingdom
- France
- Italy
- Spain
- Russia
- Rest of Europe
- Asia-Pacific
- China
- India
- Japan
- South Korea
- Malaysia
- Singapore
- Australia
- Rest of Asia-Pacific
- Middle East and Africa
- Middle East
- United Arab Emirates
- Saudi Arabia
- Turkey
- Rest of Middle East
- Africa
- South Africa
- Nigeria
- Rest of Africa
- Middle East
- North America
Data Sources, Market Sizing, and Validation
Desk Research
Desk research was used to build the base demand context for servers and to understand how pricing and licensing models move over time. We reviewed public indicators that show server installs and refresh patterns, including IT spending and digital infrastructure investments, before those signals were translated into market variables.
Sources referenced include public and official publications such as the US Bureau of Economic Analysis (software and IT investment series), US International Trade Commission data (for hardware trade context), OECD digital economy indicators, World Bank macro and enterprise adoption datasets, and NIST cybersecurity publications that affect patching and support needs. We also used company filings, investor presentations, standards and open source project documentation, and a paid subscription for company financials and news, plus a paid patent database to track server OS level innovation themes. The sources listed here are illustrative, and many other documents were used for collection, cross-checking, and clarification.
Primary Interviews and Surveys
Primary work focused on validating what share of server shipments and installed base typically run on each OS family, and how licensing and support are bought across enterprise sizes and verticals. We spoke with a mix of infrastructure leaders, IT operations managers, channel participants, and data center experts across APAC, EMEA, and the Americas. This input helped clarify renewal timing, virtualization practices, and the split between cloud deployments and on-premise deployments.
Distribution of primary research fieldwork respondents
| Company type | Respondent position | Region |
|---|---|---|
| Top tier: 37% | CXOs: 18% | APAC: 46% |
| Mid tier: 41% | Functional/Unit leaders: 28% | EMEA: 32% |
| Smaller Players: 22% | Managers: 54% | Americas: 22% |
Market-Sizing & Forecasting
Sizing starts from a top-down reconstruction of the addressable server OS revenue pool by linking server demand signals to OS attach rates, then mapping those volumes to prevailing licensing and support spend. The model separates commercial subscriptions, perpetual licenses, and paid support contracts so that renewals and first-time deployments are not mixed.
To keep totals grounded, we also run selective bottom-up checks, such as supplier revenue roll-ups where disclosure is available, channel checks on typical per-server pricing, and sampled ASP x installed base calculations for major license models. Key inputs include global server shipment and installed base trends, virtualization penetration (which changes how many OS instances are paid for), the shift between on-premise and cloud deployments, average support contract duration, and the pace of security patching and compliance-driven upgrades.
Forecasting uses scenario analysis supported by expert consensus on how cloud adoption, containerization, and AI workload growth change OS choices and support intensity. Where direct pricing or attach-rate data is missing for smaller geographies, we build ranges from comparable markets and then correct them using primary feedback before finalizing country and regional totals.
Data Validation & Update Cycle
Outputs are cross-checked against independent signals, including server hardware spend direction, software revenue disclosures, and deployment trend markers, and then variances are investigated before sign-off. If a metric moves out of the expected band, assumptions are revisited, and the analyst team re-contacts relevant interviewees to confirm whether it is a true market shift or a data timing issue.
Reviews happen in multiple steps: calculations, definitions, and unit economics are checked by a second analyst, then reviewed again by a lead reviewer. The report is refreshed annually, and interim updates are made when material events occur, such as licensing model changes or major security incidents that shift support demand. Before delivery, a fresh validation pass is completed so clients receive the most current view.
Mordor Intelligence's Server Operating System Market Size Measured Against Other Published Estimates
Published market values for server operating systems can look different across sources, mainly because the revenue boundary is not always treated the same way and because pricing assumptions are updated at different speeds. We keep the approach simple to follow, but it still checks the output against real-world deployment signals and purchase behavior.
The main gap comes from whether adjacent infrastructure software and broader data center services are counted along with server OS revenue, and how cloud instances are handled when the underlying host is not owned by the user. In our model, Mordor Intelligence counts only OS-linked license, subscription, and paid support revenue, and it updates virtualization and deployment mix assumptions using recent primary inputs so renewals are not overstated.
Benchmark comparison
| Source | Market Size | Gaps in Research Methodology |
|---|---|---|
| Mordor Intelligence | USD 24.14 B (2026) | |
| Industry Research House A | USD 21.15 B (2024) | Uses an earlier base year and may blend server OS revenue with broader infrastructure software context, which can dilute or shift the revenue pool when cloud and virtualization mixes change. |
| Industry Research House B | USD 28.40 B (2025) | Shows a higher starting value that can come from counting a wider set of paid platform items, and from using less transparent licensing and support price ladders across enterprise sizes. |
The spread across the three figures is largely explained by scope choices and the timing of mix and pricing updates, not by a single forecasting trick. By keeping the market tied to clearly identifiable OS monetization lines and then sanity-checking it with deployment and renewal behavior, the final number remains traceable to inputs that can be re-checked and updated as conditions change.


Key Questions Answered in the Report
What is the value of the server operating system market in 2026?
The market is valued at USD 24.14 billion in 2026 and is projected to reach USD 36.03 billion by 2031.
Which deployment mode holds the largest share today?
Cloud installations lead with 63.60% of 2025 revenue, reflecting the dominance of hyperscale and SaaS workloads.
What segment is expanding the fastest through 2031?
Hybrid deployments post the quickest growth at a 10.22% CAGR as enterprises balance cloud scalability with on-premises control.
How quickly is ARM gaining ground in server architectures?
ARM-based servers are advancing at a 9.47% CAGR, buoyed by energy-efficient custom silicon adopted by major cloud providers.
Why are services growing faster than software sales?
Integration and migration complexity-especially post-CentOS EOL and during hybrid rollouts-drives a 10.58% CAGR for professional and managed services.
Which vertical shows the highest growth rate?
Healthcare leads with a 9.91% CAGR through 2031 as telemedicine, imaging, and AI diagnostics fuel demand for secure, high-performance server operating systems.
Page last updated on:





