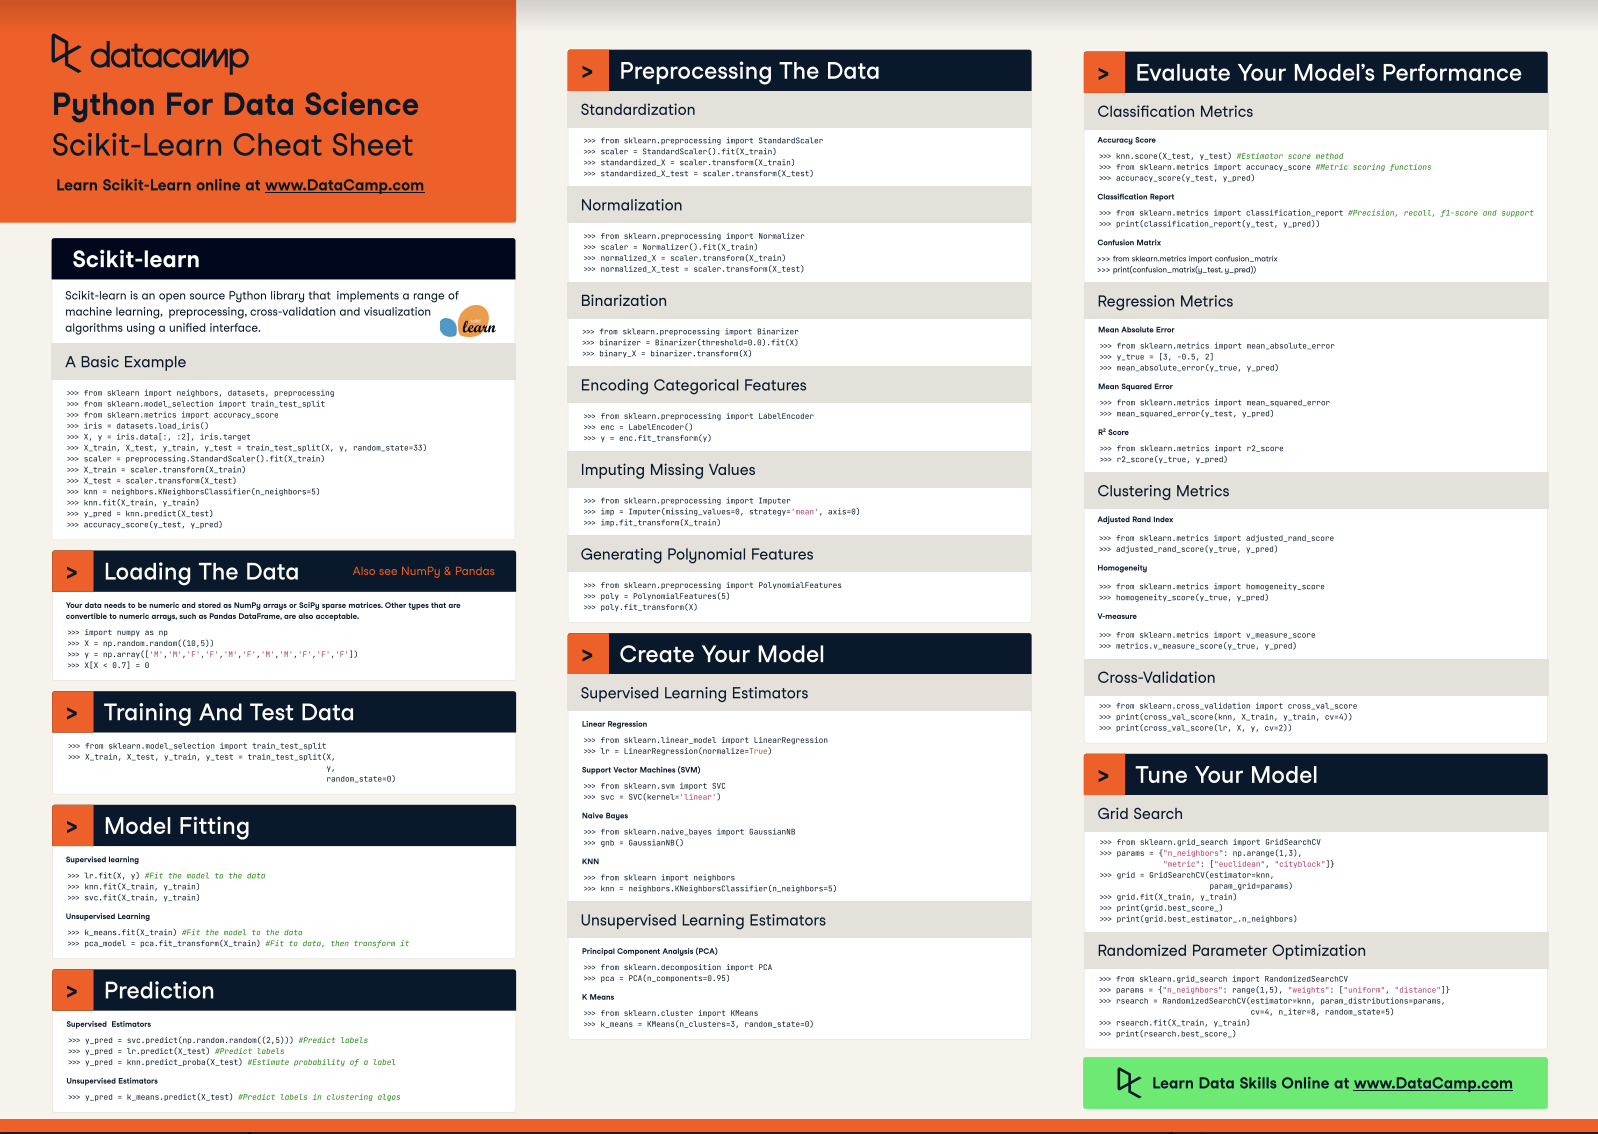
Most of you who are learning data science with Python will have definitely heard already about scikit-learn, the open source Python library that implements a wide variety of machine learning, preprocessing, cross-validation and visualization algorithms with the help of a unified interface.
If you're still quite new to the field, you should be aware that machine learning, and thus also this Python library, belong to the must-knows for every aspiring data scientist.
That's why DataCamp has created a scikit-learn cheat sheet for those of you who have already started learning about the Python package, but that still want a handy reference sheet. Or, if you still have no idea about how scikit-learn works, this machine learning cheat sheet might come in handy to get a quick first idea of the basics that you need to know to get started.
Either way, we're sure that you're going to find it useful when you're tackling machine learning problems!
This scikit-learn cheat sheet will introduce you to the basic steps that you need to go through to implement machine learning algorithms successfully: you'll see how to load in your data, how to preprocess it, how to create your own model to which you can fit your data and predict target labels, how to validate your model and how to tune it further to improve its performance.
Have this cheat sheet at your fingertips
Download PDFIn short, this cheat sheet will kickstart your data science projects: with the help of code examples, you'll have created, validated and tuned your machine learning models in no time.
So what are you waiting for? Time to get started!
(Click above to download a printable version or read the online version below.)
Python For Data Science Cheat Sheet: Scikit-learn
Scikit-learn is an open source Python library that implements a range of machine learning, preprocessing, cross-validation and visualization algorithms using a unified interface.
A Basic Example
from sklearn import neighbors, datasets, preprocessing
from sklearn.model_selection import train_test_split
from sklearn.metrics import accuracy_score
iris = datasets.load_iris()
X, y = iris.data[:, :2], iris.target
X_train, X_test, y_train, y_test = train_test_split(X, y, random_state=33)
scaler = preprocessing.StandardScaler().fit(X_train)
X_train = scaler.transform(X_train)
X_test = scaler.transform(X_test)
knn = neighbors.KNeighborsClassifier(n_neighbors=5)
knn.fit(X_train, y_train)
y_pred = knn.predict(X_test)
accuracy_score(y_test, y_pred)
Loading The Data
Your data needs to be numeric and stored as NumPy arrays or SciPy sparse matrices. Other types that are convertible to numeric arrays, such as Pandas DataFrame, are also acceptable.
import numpy as np
X = np.random.random((10,5))
y = np.array(['M','M','F','F','M','F','M','M','F','F','F'])
X[X < 0.7] = 0
Preprocessing The Data
Standardization
from sklearn.preprocessing import StandardScaler
scaler = StandardScaler().fit(X_train)
standardized_X = scaler.transform(X_train)
standardized_X_test = scaler.transform(X_test)
Normalization
from sklearn.preprocessing import Normalizer
scaler = Normalizer().fit(X_train)
normalized_X = scaler.transform(X_train)
normalized_X_test = scaler.transform(X_test)
Binarization
from sklearn.preprocessing import Binarizer
binarizer = Binarizer(threshold=0.0).fit(X)
binary_X = binarizer.transform(X)
Encoding Categorical Features
from sklearn.preprocessing import LabelEncoder
enc = LabelEncoder()
y = enc.fit_transform(y)
Imputing Missing Values
from sklearn.preprocessing import Imputer
imp = Imputer(missing_values=0, strategy='mean', axis=0)
imp.fit_transform(X_train)
Generating Polynomial Features
from sklearn.preprocessing import PolynomialFeatures
poly = PolynomialFeatures(5)
oly.fit_transform(X)
Training And Test Data
from sklearn.model_selection import train_test_split
X_train, X_test, y_train, y_test = train_test_split(X,y,random_state=0)
Create Your Model
Supervised Learning Estimators
Linear Regression
from sklearn.linear_model import LinearRegression
lr = LinearRegression(normalize=True)
Support Vector Machines (SVM)
from sklearn.svm import SVC
svc = SVC(kernel='linear')
Naive Bayes
from sklearn.naive_bayes import GaussianNB
gnb = GaussianNB()
KNN
from sklearn import neighbors
knn = neighbors.KNeighborsClassifier(n_neighbors=5)
Unsupervised Learning Estimators
Principal Component Analysis (PCA)
from sklearn.decomposition import PCA
pca = PCA(n_components=0.95)
K Means
from sklearn.cluster import KMeans
k_means = KMeans(n_clusters=3, random_state=0)
Model Fitting
Supervised learning
lr.fit(X, y)
knn.fit(X_train, y_train)
svc.fit(X_train, y_train)
Unsupervised Learning
k_means.fit(X_train)
pca_model = pca.fit_transform(X_train)
Prediction
Supervised Estimators
y_pred = svc.predict(np.random.random((2,5)))
y_pred = lr.predict(X_test)
y_pred = knn.predict_proba(X_test))
Unsupervised Estimators
y_pred = k_means.predict(X_test)
Evaluate Your Model's Performance
Classification Metrics
Accuracy Score
knn.score(X_test, y_test)
from sklearn.metrics import accuracy_score
accuracy_score(y_test, y_pred)
Classification Report
from sklearn.metrics import classification_report
print(classification_report(y_test, y_pred)))
Confusion Matrix
from sklearn.metrics import confusion_matrix
print(confusion_matrix(y_test, y_pred)))
Regression Metrics
Mean Absolute Error
from sklearn.metrics import mean_absolute_error
y_true = [3, -0.5, 2])
mean_absolute_error(y_true, y_pred))
Mean Squared Error
from sklearn.metrics import mean_squared_error
mean_squared_error(y_test, y_pred))
R2 Score
from sklearn.metrics import r2_score
r2_score(y_true, y_pred))
Clustering Metrics
Adjusted Rand Index
from sklearn.metrics import adjusted_rand_score
adjusted_rand_score(y_true, y_pred))
Homogeneity
from sklearn.metrics import homogeneity_score
homogeneity_score(y_true, y_pred))
V-measure
from sklearn.metrics import v_measure_score
metrics.v_measure_score(y_true, y_pred))
Cross-Validation
print(cross_val_score(knn, X_train, y_train, cv=4))
print(cross_val_score(lr, X, y, cv=2))
Tune Your Model
Grid Search
from sklearn.grid_search import GridSearchCV
params = {"n_neighbors": np.arange(1,3), "metric": ["euclidean", "cityblock"]}
grid = GridSearchCV(estimator=knn,param_grid=params)
grid.fit(X_train, y_train)
print(grid.best_score_)
print(grid.best_estimator_.n_neighbors)
Randomized Parameter Optimization
from sklearn.grid_search import RandomizedSearchCV
params = {"n_neighbors": range(1,5), "weights": ["uniform", "distance"]}
rsearch = RandomizedSearchCV(estimator=knn,
param_distributions=params,
cv=4,
n_iter=8,
random_state=5)
rsearch.fit(X_train, y_train)
print(rsearch.best_score_)
Going Further
Begin with our scikit-learn tutorial for beginners, in which you'll learn in an easy, step-by-step way how to explore handwritten digits data, how to create a model for it, how to fit your data to your model and how to predict target values. In addition, you'll make use of Python's data visualization library matplotlib to visualize your results.
PS. Don't miss our Bokeh cheat sheet, the Pandas cheat sheet or the Python cheat sheet for data science.