Forest methane science
The Climate Case for Forest Methane
Through their bark, trees pull methane out of the air, a potent greenhouse gas that standard carbon accounting leaves out. It was measured only recently, and current forest-carbon methods do not credit it. This page explains the mechanism, measurements, climate metrics, and limits.
How the uptake works
Inside the Bark
Methane-oxidizing bacteria occupy the oxic outer tissue of the stem, the bark and the sapwood just beneath it, though their exact position is not yet resolved. They oxidize atmospheric methane, consuming oxygen and releasing carbon dioxide. The inner heartwood is dead and anoxic, so they cannot persist there. Soil-derived methane can also travel up the stem through the chimney effect. SelvaFlux measures uptake directly from the atmosphere.
The next figure shows a stem in cross-section.
The next figure shows how one bacterium oxidizes methane.
Oxidizing methane to carbon dioxide is a net climate benefit. Methane traps far more heat than carbon dioxide while it is in the air, on the order of 30 times as much over 100 years and roughly 80 times over the first 20, mass for mass. Converting a methane molecule to carbon dioxide leaves a much weaker greenhouse gas, so the net effect is to reduce warming.
Methanotrophs differ in their affinity for methane. Low-affinity types are active only where methane is abundant, as in wetlands and landfills. High-affinity types oxidize methane at its atmospheric concentration, about 2 parts per million, and are the ones responsible for the atmospheric sink.
At atmospheric concentration the energy yield is very low, less than a cell needs just to maintain itself, so per-cell rates are slow and these bacteria do not live on methane alone. Across the world’s well-drained soils they still remove on the order of 30 million tonnes of methane a year. We found that tree bark adds a sink of the same order of magnitude (Nature 2024). Bark methane-oxidizers have since been characterized by genome sequencing (Leung et al. 2026), though the specific organisms responsible on upland bark are not yet identified.
These bark microbes are not specific to methane. They also oxidize atmospheric hydrogen and carbon monoxide, which supplements their energy at these low concentrations. Across Australian forests, Leung and colleagues (2026) measured bark as a substantial hydrogen sink, on the order of 55 million tonnes a year.
Stoichiometry, step by step
[H] is a reducing equivalent (carried by NAD(P)H and similar cofactors). The first step spends two; the three oxidations after it yield six, more than enough to repay that and to power the cell. At formaldehyde, some of the carbon is assimilated into biomass instead of continuing to CO₂.
The final figure shows the estimated global distribution.
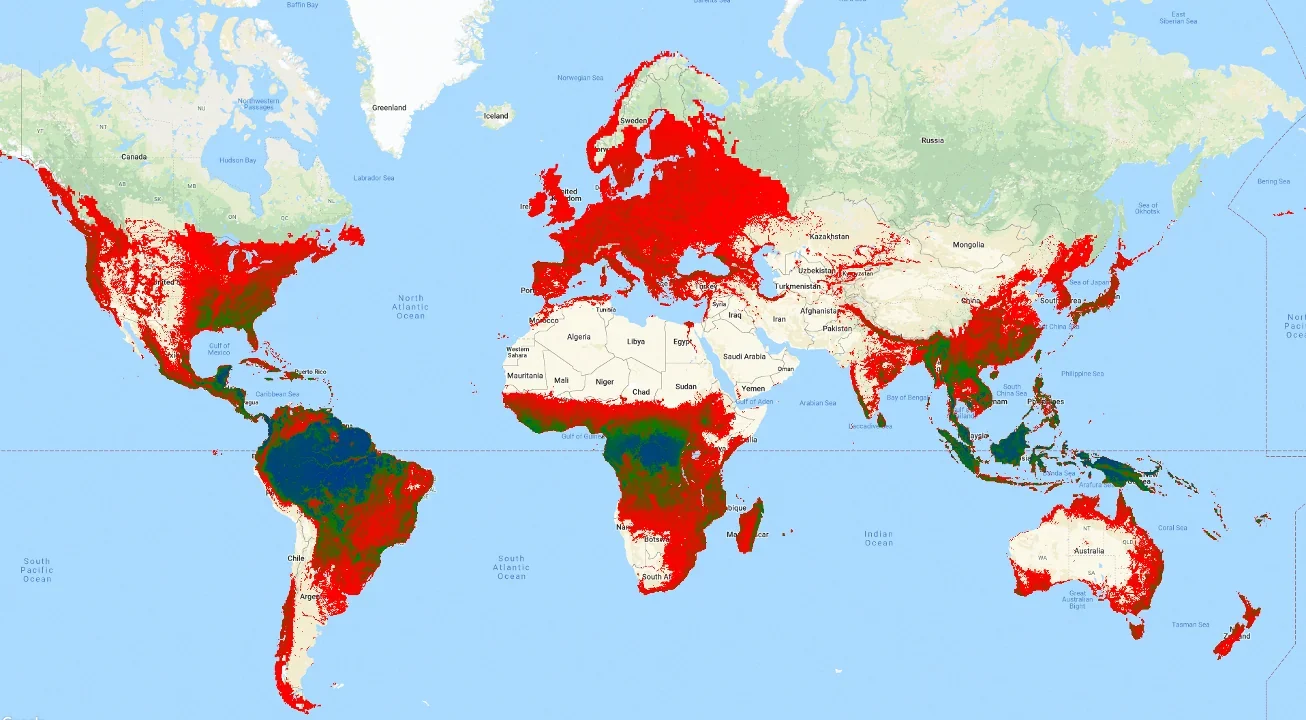
CH₄ uptake: A. Shenkin (SelvaFlux). Basemap: Google.
Quantifying the sink for a specific forest requires measuring its woody surface area. How we measure that →
What the accounts miss
Forests Remove Methane From the Air
Most methane mitigation focuses on emitting less. Forests also take it back out of the air. This sink was measured directly across upland forests worldwide and published in Nature ().
Direct measurements allow the climate effect of this uptake to be quantified. An approved methodology would allow forest projects to credit it.
Methane and near-term warming
Methane Causes Strong Warming Over a Short Period
Carbon dioxide drives warming over centuries. Methane acts on a much shorter timescale: it lasts perhaps a decade in the air, and while it is up there it traps more heat per tonne than CO₂. Removing methane reduces warming over the following decades.
GWP100 Averages Methane’s Effect Over a Century
The commonly cited value of about 28× averages methane’s warming across 100 years, most of them long after the methane itself is gone. Averaged over a century, a short pulse of warming produces a lower value than a shorter time window. Over 20 years, methane’s effect is much larger.
GWP* expresses the warming-equivalent effect of a change in the rate of a short-lived gas (). Its value depends on the methane flux history. The new-sink scenario used here starts uptake at zero and applies full mature-forest uptake from the first modeled year. It gives about 1.81 tCO₂-we/ha/year in years 1 to 20 and about 0.11 tCO₂-we/ha/year after year 20.
Methane accounting
GWP100 and GWP* Use Different Calculations
At the warm-tropical reference uptake rate, GWP100 gives a steady annual value. GWP* depends on when the sink was established and how its removal rate changes.
The modeled value is 1.81 tCO₂-we/ha/year in years 1 to 20 and 0.11 after year 20.
At the same uptake rate, GWP100 gives 0.45 tCO₂e/ha/year before project deductions.
Both start from the methane a hectare of forest takes up each year:
- Bark CH₄ uptake46.7 µg/m²/h × 41,200 m²/ha × 8,760 h/yr = 16.8 kg CH₄/ha/yrper-area uptake from , warm tropics, 2 m up the stem; woody surface area 4.12× the ground area, by laser scanning
- Accounting value, GWP10016.8 kg × 27 = 0.45 tCO₂e/ha/yrabout 4% of biomass carbon
- New-sink scenario, GWP*Years 1 to 20: 1.81 tCO₂-we/ha/yr; after year 20: 0.11 tCO₂-we/ha/yrcalculated from the change in methane removal rate, assuming zero pre-project uptake and full mature-forest uptake from the first modeled year
The GWP* values are a calculated rate-change scenario. They are not a measured flux or a crediting value. SelvaFlux uses GWP100 in prospective credit estimates and reports GWP* separately.
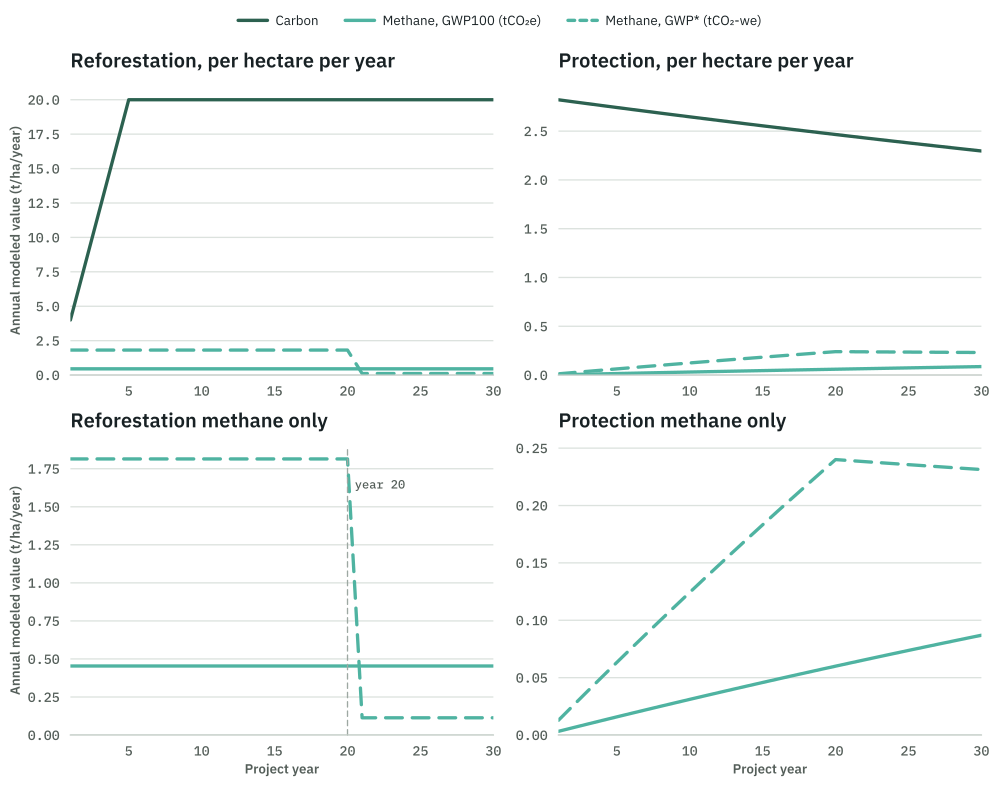
Caveat: these panels assume that woody surface area and methane uptake reach their full mature-forest values in the first modeled year. Uptake development in restored forests has not been measured. A slower rise would change the GWP* path and lower the early values. SelvaFlux is working to measure this rate directly.
How SelvaFlux Uses the Two Metrics
Prospective credit estimates use GWP100. GWP* provides a separate warming-equivalent scenario for a change in the methane removal rate.
No registry currently uses GWP* for crediting. Any future use would require approval. SelvaFlux does not add the GWP100 and GWP* results.
Independent corroboration
Results From Other Research Groups
The 2024 Naturestudy mapped methane uptake by tree woody surfaces across upland forests worldwide, strongest in the warm tropics and fading toward cold high latitudes. Independent groups have measured the same effect at their own sites, at per-area rates that match that temperature trend. Separate labs have documented the mechanism behind it, methane-oxidizing microbes in bark and wood. One 2025 paper (Jardine et al.) asks whether part of the uptake is instead tied to the tree’s own respiration, but the weight of evidence favors the microbial process. The picture is not uniform. In some upland forests the stems release more methane than their surfaces take up, and those results are here too. Wetland forests, which emit methane heavily from waterlogged soil, are a separate question and are not used here.
Woody-Surface Methane Uptake, Measured Independently
Tree stems take up atmospheric methane at per-area rates that match the 2024 study’s temperature trend. SelvaFlux measures methane uptake at this surface.
- Jardine et al. 2025, Trees. An upland tree stem in California was measured taking up atmospheric methane, at a per-area rate in the range the 2024 study found for a temperate-climate stem.
- Machacová et al. 2021, New Phytologist. In a well-drained tropical rainforest on Réunion, on volcanic substrate, the stems of six species and their bark cryptogams were net methane sinks, the stronger uptake expected at a warm site.
Methane Uptake by Tree Foliage
Studies have also measured atmospheric methane uptake by leaves. SelvaFlux does not include foliage in its bark-uptake estimates.
- Sundqvist et al. 2012, Geophysical Research Letters. Branch chambers on four boreal species in central Sweden measured net uptake of atmospheric methane by their shoots and foliage.
- Gorgolewski et al. 2023, Ecosystems. In an upland temperate forest in Ontario, tree foliage was a net daytime methane sink.
The Mechanism: Microbes in Bark and Wood
Independent studies have identified methane-oxidizing microbes in bark and wood.
- Jeffrey et al. 2021, Nature Communications. Methanotrophic bacteria in the bark of paperbark trees cut the methane the trees emit by about 36%, with uptake rising where more of these bacteria live.
- Jeffrey et al. 2021, New Phytologist. Carbon-isotope measurements up the trunk showed about a third of the methane moving through the stem is oxidized on the way.
- Leung et al. 2026, Science. Across eight Australian tree species spanning wetland, mangrove, coastal heath, and upland forests, bark microbes oxidized methane, hydrogen, and carbon monoxide.
- Putkinen et al. 2021, New Phytologist. Metagenomic sequencing of boreal Norway spruce needles found monooxygenase genes potentially able to consume methane.
Where the Picture Is Mixed
Net direction varies by species and setting, and we include the contrary results. Wetland forests, heavy methane emitters from waterlogged soil, are a separate question and are not used here.
- Epron et al. 2025, Tree Physiology. In a cool-temperate mountain forest, bark methane oxidation was real but about ten times smaller than trunk emissions, so those trees were a net source. The authors caution it is early to treat tree surfaces as a global sink everywhere.
- Hettwer et al. 2025, Biogeochemistry. In a Maine conifer forest, living stems of spruce, hemlock, and red maple were net methane emitters across the moisture gradient.
- Kasak et al. 2026, Agricultural and Forest Meteorology. In a California blue oak savanna, oak stems were a weak but persistent methane source year-round at all three measured heights, and the ecosystem was a net methane source even though its soils took up methane. Chambers reached 2.7 m up the trunk. The authors’ laser scans put the whole trunk at about 6% of a tree’s woody surface, and they did not measure branches.
- Gewirtzman et al. 2025, bioRxiv (preprint). In upland forests, tree stems were net methane emitters at the chamber scale, though the sapwood just beneath the bark, and the heartwood, carried methane-oxidizing genes alongside the methane-producing ones.
At the scale of a country
National Forest Methane Inventories
From satellites, the same measurement can quantify forest methane uptake across a whole jurisdiction or a single project. A jurisdictional estimate gives governments additional information for national forest accounts. We design these programs with national forest institutions and climate funders.
Bark methane uptake is a natural process the forest already carries out. It is reportable for completeness in a national inventory. It does not create a carbon credit, offset, or license to emit.
For governments and jurisdictionsOther forest benefits
Methane Is One Benefit of Standing Forests
Standing forests store carbon, support biodiversity, recycle rainfall, and protect soil. SelvaFlux measures methane uptake. These other benefits are not included in the methane credit.
Other benefits of standing forestsPilot measurements are underway. We estimate that crediting is 1 to 2 years away.
The homepage explains the projected revenue for forest-project developers.
References
Where the Numbers Come From
- Forest methane uptakeGauci, V. et al. (2024). Global atmospheric methane uptake by upland tree woody surfaces. Nature.DOI
- Methane rate-based accounting (GWP*)Lynch, J., Cain, M., Pierrehumbert, R. & Allen, M. (2020). Demonstrating GWP*: a means of reporting warming-equivalent emissions. Environmental Research Letters 15(4), 044023.DOI
- GWP100 methane conversion (~27× for biogenic methane)IPCC (2021). Climate Change 2021: The Physical Science Basis, Working Group I (AR6), Chapter 7.Report
- Forest biomass growthCook-Patton, S. C. et al. (2020). Mapping carbon accumulation potential from global natural forest regrowth. Nature 585, 545-550.DOI