Try:
What scholars in Engineering share the name Gang Chen?What are the most cited publications in data mining at Stanford?Who are the Highly Ranked Scholars in Cancer in Chicago?
The 2025 ScholarGPS® Top 10 Institutions in Physical Sciences rankings illuminate a uniquely competitive global landscape, with academic excellence distributed across the United Kingdom, the United States, China, and Switzerland. Physical Sciences encompass fields such as mathematics, physics, chemistry, astronomy, earth sciences, and statistics. The Lifetime Academic rankings are led by the University of Cambridge and the University of Oxford, reflecting the long-standing research strength of the UK, followed closely by top U.S. institutions including Stanford University, UC Berkeley, MIT, UCLA, UC San Diego, and Caltech. In contrast, the Prior Five Years rankings demonstrate a dramatic surge in research productivity from China, with the University of Science and Technology of China, Nanjing University, Wuhan University, Tsinghua University, and Central South University occupying the majority of top positions. ETH Zurich further represents Europe with consistent high performance across both time periods.
Non-academic research institutions show overwhelming U.S. leadership, with Lawrence Berkeley National Laboratory, Los Alamos National Laboratory, Woods Hole Oceanographic Institution, NIST, Goddard Space Flight Center, Brookhaven National Laboratory, and the U.S. Geological Survey all securing places in the top ten. Additional global contributions come from the Russian Academy of Sciences and the Institute for Advanced Study, underscoring the worldwide depth of physical sciences research. Collectively, these rankings highlight ScholarGPS®'s unparalleled capacity to capture both long-term institutional legacy and rapidly emerging research powerhouses, offering a comprehensive and data-driven view of excellence in the Physical Sciences. To explore rankings for other universities, labs, and research organizations, visit the ScholarGPS® Institutional Rankings at https://scholargps.com/institutional-rankings.
|
Academic Institutions –
Lifetime |
Academic Institutions –
Prior Five Years |
Non-Academic
Institutions – Lifetime |
|||
|---|---|---|---|---|---|
| 1 | University of Cambridge United Kingdom. |
1 | University of Science and Technology of China China. |
1 | Lawrence Berkeley National Laboratory United States. |
| 2 | University of Oxford United Kingdom. |
2 | Nanjing University China. |
2 | Los Alamos National Laboratory United States. |
| 3 | Stanford University United States. |
3 | King Saud University Saudi Arabia. |
3 | Woods Hole Oceanographic Institution United States. |
| 4 | University of California, Berkeley United States. |
4 | Wuhan University China. |
4 | National Institute of Standards and Technology United States. |
| 5 | Massachusetts Institute of Technology United States. |
5 | Tsinghua University China. |
5 | Goddard Space Flight Center United States. |
| 6 | University of California, Los Angeles United States. |
6 | Central South University China. |
6 | Brookhaven National Laboratory United States. |
| 7 | ETH Zurich Switzerland. |
7 | ETH Zurich Switzerland. |
7 | International Business Machines Corporation United States. |
| 8 | Harvard University United States. |
8 | University of Oxford United Kingdom. |
8 | Russian Academy of Sciences Russia. |
| 9 | University of California, San Diego United States. |
9 | University of Cambridge United Kingdom. |
9 | Institute for Advanced Study United States. |
| 10 | California Institute of Technology United States. |
10 | Nankai University China. |
10 | United States Geological Survey United States. |
The 2025 ScholarGPS® Top 10 Institutions in Public Health rankings reveal a powerful combination of continuity and global breadth across academic and non-academic organizations. Harvard University and Johns Hopkins University lead both Lifetime and Prior Five Years academic rankings, reaffirming their unmatched global influence in public health research and education. U.S. institutions—including the University of Washington, UCSF, Columbia, and the University of Michigan—perform strongly across all categories, while Canada, the United Kingdom, Sweden, and Australia make notable contributions through top performers such as the University of Toronto, University of Oxford, Karolinska Institute, Monash University, and the London School of Hygiene & Tropical Medicine. Overall, the rankings show that although the United States dominates much of the field, excellence in public health research remains widely distributed across multiple nations.
In the non-academic sector, the National Cancer Institute (NIH) and the Centers for Disease Control and Prevention (CDC) secure the top two positions, highlighting the critical role of U.S. federal health agencies in driving global public health innovation. Additional leading institutions—including INSERM in France, Brigham and Women's Hospital, the National Institute of Environmental Health Sciences (NIH), Fred Hutchinson Cancer Research Center, and Finland's National Institute for Health and Welfare—demonstrate the diverse ecosystem contributing to advancements in epidemiology, population health, and preventive medicine. Collectively, these rankings showcase ScholarGPS®'s comprehensive and data-driven approach to evaluating institutional excellence in Public Health. To explore rankings for other universities, hospitals, and research centers, visit the ScholarGPS® Institutional Rankings at https://scholargps.com/institutional-rankings.
|
Academic Institutions –
Lifetime |
Academic Institutions –
Prior Five Years |
Non-Academic
Institutions – Lifetime |
|||
|---|---|---|---|---|---|
| 1 | Harvard University United States. |
1 | Harvard University United States. |
1 | National Cancer Institute, National Institutes of Health United States. |
| 2 | Johns Hopkins University United States. |
2 | Johns Hopkins University United States. |
2 | Centers for Disease Control and Prevention United States. |
| 3 | University of Washington United States. |
3 | London School of Hygiene & Tropical Medicine United Kingdom. |
3 | Institut National de la Santé et de la Recherche Médicale France. |
| 4 | University of Toronto Canada. |
4 | University of Toronto Canada. |
4 | Brigham and Women's Hospital United States. |
| 5 | University of Oxford United Kingdom. |
5 | Monash University Australia. |
5 | National Institute of Environmental Health Sciences, National Institutes of Health United States. |
| 6 | Karolinska Institute Sweden. |
6 | University of Sydney Australia. |
6 | Fred Hutchinson Cancer Research Center United States. |
| 7 | University of California, San Francisco United States. |
7 | University of Oxford United Kingdom. |
7 | Dana-Farber Cancer Institute United States. |
| 8 | Columbia University United States. |
8 | Karolinska Institute Sweden. |
8 | National Institute for Health and Welfare Finland. |
| 9 | London School of Hygiene & Tropical Medicine United Kingdom. |
9 | Columbia University United States. |
9 | Memorial Sloan Kettering Cancer Center United States. |
| 10 | University of Michigan United States. |
10 | Imperial College London United Kingdom. |
10 | Food and Drug Administration United States. |
The 2025 ScholarGPS® Life Sciences rankings highlight the global institutions that consistently lead across the full spectrum of life-science research—from molecular and cellular biology to biochemistry , environmental science, ecology, neuroscience, biotechnology, and biomedical sciences. Harvard University maintains its commanding position in both the Lifetime and Prior Five Years categories, reflecting its long-term strength and recent high-impact contributions. Close behind, Stanford University, University of Oxford, and University of Cambridge underscore a powerful U.S.-U.K. presence, while University College London, Karolinska Institute, and the University of California system further solidify the depth and diversity of top-tier research in the field. The Prior Five Years category also showcases dynamic movement, with institutions such as King Saud University, Ghent University, and Hunan University emerging as rapidly growing contributors to global life-science scholarship.
In the Non-Academic Institutions - Lifetime category, the landscape remains internationally competitive. France's INSERM ranks first, followed by the U.S. National Cancer Institute and Pasteur Institute, demonstrating the major role that national research agencies and independent institutes play across the biological and life sciences. Additional U.S. leaders—such as NIAID, Scripps Research, Memorial Sloan Kettering, and Massachusetts General Hospital—reinforce the country's dominant contributions to a broad range of life-science disciplines. Together, the 2025 rankings reveal a vibrant, evolving global ecosystem in which established institutions continue to excel while rising universities and research centers rapidly expand their impact across the life sciences.
For deeper insights and to explore rankings across all fields and institutions, visit:🔗 https://scholargps.com/institutional-rankings
|
Academic Institutions –
Lifetime |
Academic Institutions –
Prior Five Years |
Non-Academic
Institutions – Lifetime |
|||
|---|---|---|---|---|---|
| 1 | Harvard University United States. |
1 | Harvard University United States. |
1 | Institut National de la Santé et de la Recherche Médicale France. |
| 2 | Stanford University United States. |
2 | University of Oxford United Kingdom. |
2 | National Cancer Institute, National Institutes of Health United States. |
| 3 | University of Oxford United Kingdom. |
3 | King Saud University Saudi Arabia. |
3 | Pasteur Institute France. |
| 4 | University of Cambridge United Kingdom. |
4 | Ghent University Belgium. |
4 | National Institute of Allergy and Infectious Diseases, National Institutes of Health United States. |
| 5 | University College London United Kingdom. |
5 | Karolinska Institute Sweden. |
5 | Scripps Research United States. |
| 6 | University of California, Los Angeles United States. |
6 | Stanford University United States. |
6 | Memorial Sloan Kettering Cancer Center United States. |
| 7 | Karolinska Institute Sweden. |
7 | Hunan University China. |
7 | Francis Crick Institute United Kingdom. |
| 8 | Cornell University United States. |
8 | University of Pennsylvania United States. |
8 | Salk Institute for Biological Studies United States. |
| 9 | University of California, Berkeley United States. |
9 | University of Cambridge United Kingdom. |
9 | Massachusetts General Hospital United States. |
| 10 | Duke University United States. |
10 | University of Queensland Australia. |
10 | National Heart, Lung, and Blood Institute, National Institutes of Health United States. |
The 2025 ScholarGPS® Engineering rankings reveal a striking contrast between long-established global leaders and the rapidly rising institutions shaping the future of the field. In the Lifetime category, the United States maintains a dominant presence, with MIT, Stanford, Georgia Tech, UC Berkeley, and the University of Michigan securing the top positions. These institutions continue to anchor global engineering excellence through decades of high-impact research, innovative contributions, and strong academic ecosystems. Singapore's leading universities—Nanyang Technological University and the National University of Singapore—also hold prominent positions, reinforcing their global reputation for engineering strength.
However, the Prior Five Years rankings present a dramatically different picture, highlighting China's remarkable rise. Tsinghua University leads the 2025 results, followed closely by Harbin Institute of Technology, Tianjin University, Xi'an Jiaotong University, and Shanghai Jiao Tong University—reflecting the country's major investments and rapid growth in engineering innovation. Non-academic institutions show similar patterns: Microsoft, IBM, Google, major U.S. national laboratories, and top Asian research centers dominate the Lifetime rankings, underscoring the critical role of industry and government research in advancing engineering. Together, the 2025 results underscore a global landscape defined by long-term U.S. leadership, China's accelerating ascent, and an increasingly competitive and diversified ecosystem of engineering excellence worldwide. To explore engineering rankings across all institutions, visit: https://scholargps.com/institutional-rankings.
|
Academic Institutions –
Lifetime |
Academic Institutions –
Prior Five Years |
Non-Academic
Institutions – Lifetime |
|||
|---|---|---|---|---|---|
| 1 | Massachusetts Institute of Technology United States. |
1 | Tsinghua University China. |
1 | Microsoft Corporation United States. |
| 2 | Stanford University United States. |
2 | Harbin Institute of Technology China. |
2 | International Business Machines Corporation United States. |
| 3 | Georgia Institute of Technology United States. |
3 | Tianjin University China. |
3 | Google, Inc. United States. |
| 4 | University of California, Berkeley United States. |
4 | Xi'an Jiaotong University China. |
4 | National Institute for Materials Science Japan. |
| 5 | University of Michigan United States. |
5 | Shanghai Jiao Tong University China. |
5 | Oak Ridge National Laboratory United States. |
| 6 | University of Illinois at Urbana-Champaign United States. |
6 | University of Electronic Science and Technology of China China. |
6 | Samsung South Korea. |
| 7 | University of Texas at Austin United States. |
7 | Zhejiang University China. |
7 | National Institute of Standards and Technology United States. |
| 8 | Purdue University United States. |
8 | Nanyang Technological University Singapore. |
8 | Argonne National Laboratory United States. |
| 9 | Nanyang Technological University Singapore. |
9 | City University of Hong Kong Hong Kong. |
9 | Lawrence Berkeley National Laboratory United States. |
| 10 | National University of Singapore Singapore. |
10 | National University of Singapore Singapore. |
10 | Qualcomm Incorporated United States. |
The 2025 ScholarGPS® Top 10 Institutions in Medicine rankings highlight the continuing dominance of leading academic and medical research powerhouses across three evaluation periods: Lifetime Academic, Prior Five Years Academic, and Lifetime Non-Academic. Harvard University and Johns Hopkins University reaffirm their long-standing global leadership, consistently securing top positions across both lifetime and recent-performance categories. Other major U.S. institutions—including UCSF, Stanford, UCLA, Michigan, and the University of Pennsylvania—maintain their strong presence, while the University of Toronto and University College London represent the highest-ranked contributors outside the United States. Overall, the results reveal overwhelming U.S. dominance in medical research, with only a handful of positions occupied by Canada, the United Kingdom, and France.
In the non-academic sector, Mayo Clinic leads decisively, followed by Massachusetts General Hospital and Brigham and Women's Hospital—emphasizing the critical role of clinical research institutions in advancing global medicine. Cleveland Clinic, Memorial Sloan Kettering Cancer Center, Dana-Farber Cancer Institute, and Boston Children's Hospital further highlight the exceptional research output of specialized medical centers. Collectively, these rankings demonstrate ScholarGPS®'s unmatched ability to capture both academic and clinical contributions at scale, offering the most comprehensive and data-driven assessment of institutional excellence in medicine worldwide. To explore how other universities, hospitals, and research centers rank in Medicine, visit the ScholarGPS® Institutional Rankings at https://scholargps.com/institutional-rankings.
|
Academic Institutions –
Lifetime |
Academic Institutions –
Prior Five Years |
Non-Academic
Institutions – Lifetime |
|||
|---|---|---|---|---|---|
| 1 | Harvard University United States. |
1 | Johns Hopkins University United States. |
1 | Mayo Clinic United States. |
| 2 | Johns Hopkins University United States. |
2 | Harvard University United States. |
2 | Massachusetts General Hospital United States. |
| 3 | University of California, San Francisco United States. |
3 | Stanford University United States. |
3 | Brigham and Women's Hospital United States. |
| 4 | Stanford University United States. |
4 | University of Toronto Canada. |
4 | Institut National de la Santé et de la Recherche Médicale France. |
| 5 | University of California, Los Angeles United States. |
5 | University of California, San Francisco United States. |
5 | Cleveland Clinic United States. |
| 6 | University of Michigan United States. |
6 | University of Michigan United States. |
6 | Memorial Sloan Kettering Cancer Center United States. |
| 7 | University of Toronto Canada. |
7 | University of Pennsylvania United States. |
7 | Dana-Farber Cancer Institute United States. |
| 8 | University of Washington United States. |
8 | University of Texas M.D. Anderson Cancer Center United States. |
8 | Boston Children's Hospital United States. |
| 9 | University of Pennsylvania United States. |
9 | Yale University United States. |
9 | National Cancer Institute, National Institutes of Health United States. |
| 10 | Yale University United States. |
10 | University College London United Kingdom. |
10 | Beth Israel Deaconess Medical Center United States. |
We are pleased to announce the release of the 2025 ScholarGPS® Scholar, Institutional, and Country Rankings!
This year's comprehensive quantitative rankings are derived from the ScholarGPS® database, encompassing over 30 million Scholar Profiles and 120,000 Institutional Profiles across 14 Fields, 177 Disciplines, and more than 350,000 Specialties, evaluated over both lifetime and five-year periods. The 2025 rankings for all scholars are now available on their individual profiles.
To explore the various ranking categories, please visit:
These rankings showcase the most influential scholars, leading research institutions, and highly cited publications across all academic domains, providing valuable insights into global research excellence over both long-term (lifetime) and recent (five-year) periods.
ScholarGPS® recognizes two categories of scholarly excellence:
We invite you to explore the full set of 2025 ScholarGPS® Rankings and celebrate the exceptional scholars and institutions shaping the future of research and innovation.
We're thrilled to announce a major milestone for ScholarGPS® — introducing an advanced AI-driven search experience that revolutionizes the way users explore scholars, institutions, and publications.
ScholarGPS® AI is the only academic analytics platform and search engine that lets users ask natural-language questions spanning scholars, institutions, and publications across all fields, disciplines, and specialties—instantly delivering ranked, data-driven results. Unlike other AI tools, ScholarGPS® uniquely combines powerful AI search with comprehensive global rankings and evaluation of scholarly productivity and impact for both scholars and institutions.
Users can now seamlessly switch between Classic Search and ScholarGPS AI directly above the main search box on the homepage. Instantly explore scholar and institutional profiles, rankings, and publications — or combine them all — simply by asking natural-language questions through ScholarGPS AI, such as:
ScholarGPS AI transforms curiosity into actionable insights, unlocking the full depth of the ScholarGPS® database with unmatched speed, accuracy, and intelligence. Whether you prefer traditional keyword searches or conversational queries, ScholarGPS® delivers the most comprehensive and intuitive academic search experience available today.
ScholarGPS is pleased to announce the launch of a new user-friendly interface designed specifically for phone applications. The platform now automatically adapts when accessed from a mobile device, ensuring a seamless experience for scholars on the move.
While the desktop version remains the preferred environment to fully utilize the breadth of ScholarGPS's advanced features and analytics, the new mobile interface provides convenient access to rankings, scholar and institutional profiles, and insights anytime, anywhere.
This enhancement reflects our ongoing commitment to making ScholarGPS more accessible and responsive to the needs of the global scholarly community.
Data from ScholarGPS® ranking platform are used to reveal unique scholarly trends including the impact and influence of Mechanical Engineering (ME) and Heat Transfer research. Publication and citation histories for both ME and Heat Transfer are presented for 1970-2023. A breakdown of publications is provided such as the percentage of ME publications that deal with Heat Transfer, and the percentage of Heat Transfer publications authored by ME scholars. Based on the productivity (archival publications), impact (citations), and quality (h-index) of individual scholars, the influence of countries, in both ME and Heat Transfer, is reported. Countries with growing, decreasing, and emerging influence in the last five years are identified. Top-ranked scholars and academic (and, separately, nonacademic) institutions are listed for both ME and Heat Transfer. Based on their lifetime work, the world's Top 20 Highly Ranked Scholars™ (HRS) in both ME and Heat Transfer are identified. In general, it is found that the U.S. and Canada, along with other developed nations, have suffered significant declines in their influence in both ME and Heat Transfer research. In contrast, China, India, Iran, and other developing countries have increased their scholarly influence in both ME and Heat Transfer. University rankings follow similar trends. The methodologies used to identify the preceding trends are described in detail, so that studies of any of the 14 Fields, 177 Disciplines, and 350,000 Specialties covered by ScholarGPS can be conducted by other individuals and organizations.
Scholarly Trends and Rankings in Mechanical Engineering and Heat Transfer
ScholarGPS is proud to announce two groundbreaking features—Country Profiles and Country Rankings—that offer unprecedented insights into global scholarly performance. To our knowledge, our Country Rankings are the only comprehensive, directly quantitative system that spans every level of analysis: overall, by field, by discipline, and by specialty.
These rankings are based on the quality and quantity of active scholars in each country. We assess productivity (number of publications), impact (citations), and scholarly excellence (h-index), drawing from each scholar’s lifetime or recent five-year contributions. All data are carefully normalized by author count and exclude self-citations, ensuring a fair and accurate comparison.
Explore these new features directly from our homepage:
You can also view sample visualizations across a wide range of fields, disciplines, and specialties using the link below.
Rankings by Country: Overall (All Fields): Top 25
Rankings by Country: Medicine: Top 25
Rankings by Country: Engineering: Top 25
Rankings by Country: Life Sciences: Top 25
Rankings by Country: Agriculture: Top 25
Rankings by Country: Cardiology: Top 25
Rankings by Country: Computer Science: Top 25
Rankings by Country: Biology and Biological Sciences: Top 25
Rankings by Country: Animal Sciences: Top 20
Rankings by Country: Cancer: Top 25
Rankings by Country: Artificial Intelligence: Top 25
Rankings by Country: Genomics: Top 25
Rankings by Country: Biotechnology: Top 25
Our latest data reveal significant shifts in global academic rankings. While the United States and several European countries have seen their long-standing leadership decline—sometimes dramatically—emerging research powerhouses like China, India, South Korea, Australia, and Iran have surged forward, reflecting a dynamic transformation in the global scholarly landscape.
ScholarGPS is proud to announce the release of its 2024 rankings, recognizing top-performing scholars and institutions across the globe. The comprehensive rankings span all academic levels and include evaluations across multiple tiers—overall (all fields), 14 broad fields (such as Medicine, Engineering, and Humanities), 177 academic disciplines (including Surgery, Computer Science, and History), and more than 350,000 specialized research areas (such as Cancer, Artificial Intelligence, and Ethics).
The 2024 rankings are based on two evaluation periods: lifetime achievement and scholarly performance over the past five years. This dual approach offers a well-rounded view of scholarly impact and institutional excellence.
In addition, rankings from previous years—2022 and 2023 Highly Ranked Scholars and Institutional Rankings—are archived and easily accessible on the ScholarGPS platform, providing valuable insights and continuity for scholars, institutions, and academic leaders.
This study provides the first specific evidence that ScholarGPS Highly Ranked Scholars come from a wide range of diverse academic institutions, including both elite and non-elite universities, as well as governmental research institutions and the private sector. The ScholarGPS system uniquely identifies Highly Ranked Scholars, representing the top 0.05% among more than 30 million individuals across 14 fields, 177 disciplines, and over 350,000 specialties. Additionally, we explain how the ScholarGPS methodology minimizes the potential for ranking manipulation, both for scholars and institutions.
We're thrilled to announce the official launch of our revolutionary scholarly analytics platform! Using cutting-edge AI and data science, ScholarGPS® transforms the way scholar and institutional rankings are analyzed and presented. Our platform brings deeper insights, accuracy, and transparency, empowering scholars and institutions worldwide. Stay ahead with ScholarGPS®!
A journal article linked below presents the first quantitative rankings of 120,000 institutions and their programs, based on the individual rankings of approximately 30 million scholars. These rankings are determined by scholar productivity, impact, and quality. The ScholarGPS database used for this study ranks institutions in the following categories: (i) all Fields, (ii) 14 individual Fields, (iii) 177 Disciplines, and (iv) approximately 350,000 unique Specialties.
An interesting journal article linked below provides the first analysis using the ScholarGPS database of the number and country distribution of Highly Ranked Scholars. This analysis covers a universe of over 30 million scholars from more than 200 countries across various fields, disciplines, and specialties. The scholarly contributions of Highly Ranked Scholars position these eminent individuals within the top 0.05% of all scholars worldwide.
ScholarGPS provides the first quantitative institutional rankings in all Fields ("Overall"), in each of 14 broad Fields (such as Medicine, Engineering, or Humanities), in 177 Disciplines (such as Surgery, Computer Science, or History), as well as in over 350,000 unique Specialties (such as Cancer, Artificial Intelligence, or Ethics). ScholarGPS institutional rankings are developed based on active scholars on both a Lifetime basis ("Lifetime") and on the basis of scholarly work produced over a Five Year interval (in this case, January 2017-December 2021). See Ranking Terminology and Methodology for details of the institution ranking methodology. Access to both academic and non-academic institutional and program rankings is now available for free at ScholarGPS Institutional Rankings.
One significant insight obtained from the institutional rankings of over 5,600 institutions is the notable shift in rankings across various categories relative to both time intervals (Lifetime/Five Years).
Below, we identify the Top 20 academic institutions in the world relative to their Overall performance (all Fields), and for the two Fields having the largest numbers of scholars i.e., (i) Medicine and (ii) Engineering. By generating and comparing lists for both the Top 20 Lifetime and Top 20 Five Year academic institutions, we can observe how the rankings have changed relative to these two time intervals, and how the extent of the changes can vary from Field-to-Field.
The Top 20 institutions for All Fields (Overall) are shown in Fig. 1. Harvard University and Stanford University occupy the top two positions in both the Lifetime and Five Year lists. Most of the institutions identified in the figure are ranked among the Top 20 in both lists. Five U.S. institutions which are in the Top 20 Lifetime list do not appear in the Top 20 Five Year list. Where we might have expected to see these five institutions in the Five Year list, we see instead the University of British Columbia, the University of Melbourne, and Imperial College (London), none of whom make the Top 20 Lifetime list. But more impressive is the ascent of two Chinese universities, Tsinghua University (LIfetime rank: 128) and Zhejiang University (Lifetime rank: 190) into the Top 20 Five Year list at Five Year ranks of 8 and 19, respectively.
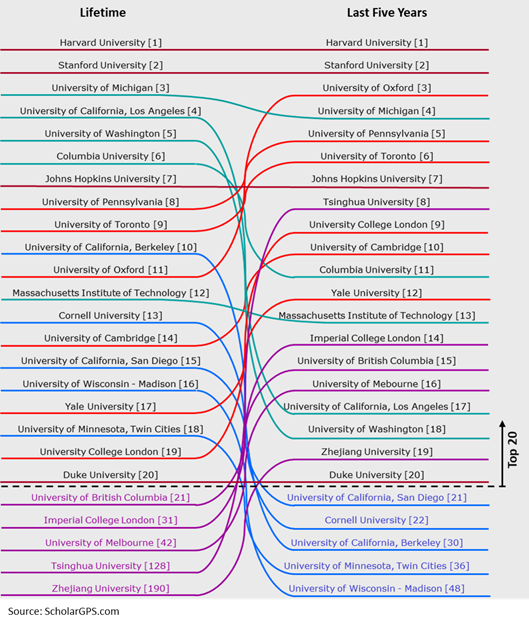
Fig. 1. Top 20 academic institutions for All Fields (Overall) and their rankings on Lifetime [R∞] and Five Year [R5] bases. Institutions that appear in the Top 20 on both lists and have ascended in rank, R5 < R∞, are identified with red underlines. In contrast, Top 20 institutions that have dropped in the rankings with R5 > R∞ ≥ 21 have green underlines. Institutions that have fallen from the Top 20 in the Five Years, R5 ≥ 21, have blue underlines. Institutions that have entered the Top 20 in the Five Years, R∞ ≥ 21, have purple underlines. Institutions with R5 = R∞ are shown with brown underlines.
Academic institutions ranked in the Top 20 (Lifetime and/or Five Year) in the Field of Medicine are shown in Fig. 2. For the most part, institutions have simply changed positions within the two Top 20 lists with the exceptions of (i) Johns Hopkins University and New York University that hold the same position in both lists, (ii) Stanford University which moved up to the top rank in the Five Year list from the 4th Lifetime position, and Harvard University, which moved down to 3rd in the Five Year list from the top position in the Lifetime list, (iii) King's College London that appears in the Top 20 Five Year list from a lower Lifetime ranking and (iv) the University of California, Los Angeles that appears in the Top 20 Lifetime list but not in the Top 20 Five Year list. Nonetheless, it is evident that U.S. institutions dominate both the Top 20 Lifetime and Five Year rankings in the Field of Medicine.
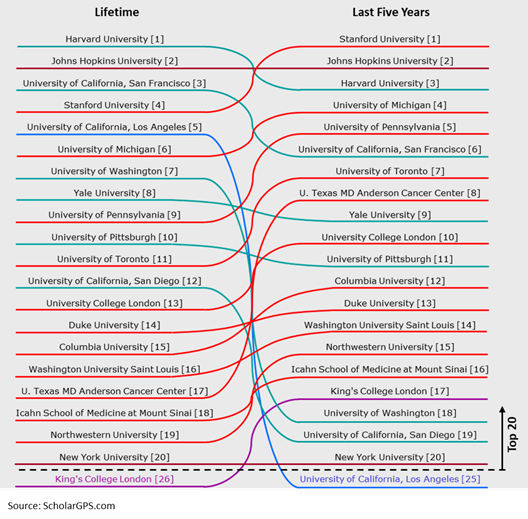
Fig. 2. Top 20 academic institutions in Medicine and their rankings on Lifetime [R∞] and Five Year [R5] bases. Institutions that appear in the Top 20 on both lists and have ascended in rank, R5 < R∞, are shown with red underlines. In contrast, Top 20 institutions that have dropped in the rankings with R5 > R∞ ≥ 21 have green underlines. The institution that has fallen from the Top 20 in the Five Years, R5 ≥ 21, has a blue underline. The institution that has entered the Top 20 in the Five Years, R∞ ≥ 21, has a purple underline. Institutions with R5 = R∞ are shown with brown underlines.
In contrast to the modest reordering of institutional rankings over the Lifetime and Five Year ranking intervals associated with All Fields (Fig. 1) and with Medicine (Fig. 2), it is apparent that the Top 20 rankings in Engineering, shown in Fig. 3, demonstrate a profound change relative to these ranking periods. MIT and Stanford University shift from their Lifetime first and second place positions to second and twelfth, respectively, in the Five Year rankings. Meanwhile, Tsinghua University ascended to the top spot in the Five Year rankings from its Lifetime position at 37th. Only 6 institutions appear in both the Lifetime and Five Year lists. Fourteen institutions, including 12 from the U.S. and one each from Canada and Israel, appear in the Top 20 Lifetime list but (perhaps surprisingly) do not appear in the Top 20 Five Year list. On the other hand, of the 14 institutions which are not in the Top 20 Lifetime list but are in the Top 20 Five Year list, 13 are from China and Hong Kong, and one is Australian.
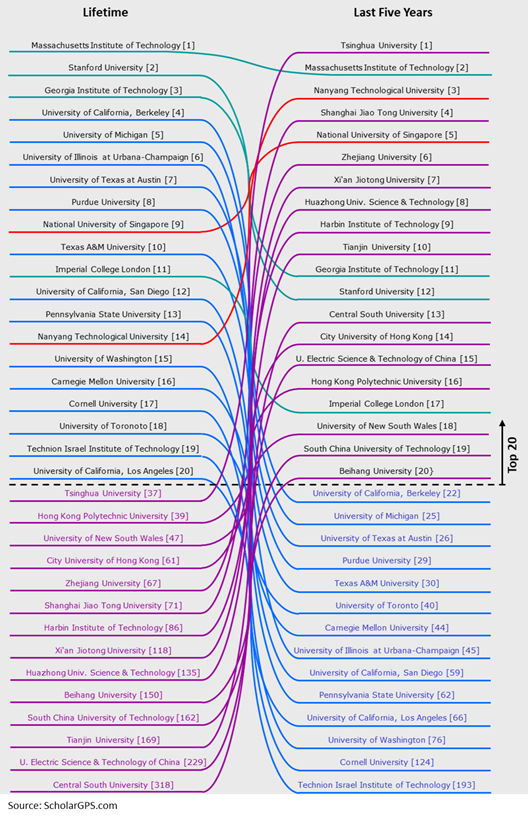
Fig. 3. Top 20 academic institutions in Engineering and their rankings on Lifetime [R∞] and Five Year [R5] bases. Institutions that are in the Top 20 on both lists and have ascended in rank, R5 < R∞, are shown with red underlines. In contrast, Top 20 institutions with R5 > R∞ ≥ 21 have green underlines. Institutions that have fallen from the Top 20 in the Five Years, R5 ≥ 21, have blue underlines. Institutions that have entered the Top 20 in the Five Years, R∞ ≥ 21, have purple underlines.
Highly Ranked Scholars™ (HRS) by ScholarGPS are exceptional researchers and the most productive authors (by number of publications) whose works are of profound impact (by total citations) and of the utmost quality (h-index). HRS are in the top 0.05 percent of all scholars evaluated at the levels of all Fields ("Overall"), or across 14 broad Fields (such as Medicine, Engineering, or Humanities), 177 Disciplines (such as Surgery, Computer Science, or History), or even over 350,000 highly focused Specialties (such as Cancer, Artificial Intelligence, or Ethics) in which the scholars are active. See Ranking Terminology and Methodology for details of the scholar ranking methodology. ScholarGPS provides free access to all HRS in all levels by country/region among over 30 million scholars from 120,000 institutions in over 200 countries via the link Highly Ranked Scholars™.
Here, we report the numbers of HRS in the top 10 countries/regions who are the most highly ranked over all Fields (Overall), or who are associated with the two Fields having the most scholars i.e., (i) Medicine and (ii) Engineering. We examine the number of HRS with respect to two kinds of time intervals: the interval spanning a scholar's Lifetime of work ("Lifetime"), and a scholar's output in the specific time period January 2017-December 2021 ("Five Year"). The HRS criteria described above is applied to the universe of scholars with respect to those time intervals to determine HRS status.
The 10 countries/regions that were found to have the largest numbers of HRS over all Fields (Overall) on either the Five Year or Lifetime basis are identified in Fig. 1. As is evident, the U.S. and Canada, along with various countries in Europe and Japan have fewer HRS over the Five Year interval than over the Lifetime interval, while China and Hong Kong, India, and Iran are among the top 10 countries with the most HRS (Lifetime) who also show large increases in their HRS numbers in the Five Year interval. Australia has little change in its number of HRS.
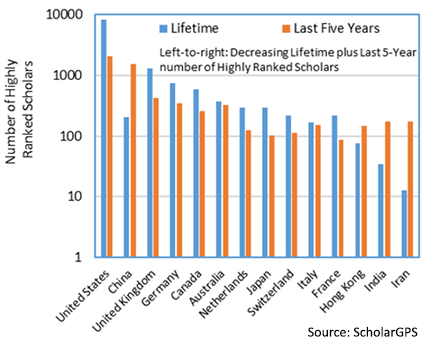
Fig. 1. Countries/regions with the largest numbers of Highly Ranked Scholars™ (Lifetime and Five Years) for All Fields (Overall). Numbers are shown for the top 10 countries/regions of either category (Five Years, N5, or Lifetime, N∞). Countries/regions are shown in order of decreasing N5 + N∞.
The same methodology shows trends associated with the specific Fields of Medicine and Engineering. As in the Overall case above, the analysis of the Field of Medicine (Fig. 2) reveals that the top-ranked U.S. has retained its lead over the second-ranked country in the Five Year interval, but by a reduced margin relative to the Lifetime lead. In general, the U.S. and Canada, several European countries, and Japan have experienced reductions in the numbers of HRS in Medicine. Italy and Spain have increased their numbers of HRS in Medicine. The strong performance of China in Medicine, as shown by the HRS data for the FIve Year interval, is evident.
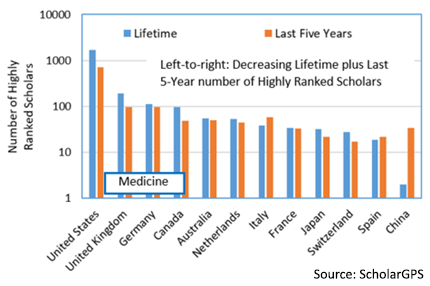
Fig. 2. Countries/regions with the most Highly Ranked Scholars™ (Lifetime and Five Years) in Medicine. Numbers are shown for the top 10 countries/regions of either category (Five Years, N5, or Lifetime, N∞). Countries/regions are shown in order of decreasing N5 + N∞.
In contrast to the results for the Overall (all Fields) category (Fig. 1) and Medicine (Fig. 2) (categories where the U.S. has retained its lead in recent years), inspection of Fig. 3 shows that China has surpassed the U.S. in the numbers of HRS in Engineering in the Five Year interval. Significant recent decreases in numbers of HRS have also been experienced by Canada, Japan, and several European countries in the Five Year interval relative to the Lifetime interval. In contrast, India and Iran show increases in their numbers of HRS in the Five Year interval relative to the Lifetime interval. Australia, Hong Kong, South Korea, and Singapore exhibit the same behavior. The Five Year performance of Iran in Engineering (Fig. 3) is remarkable.
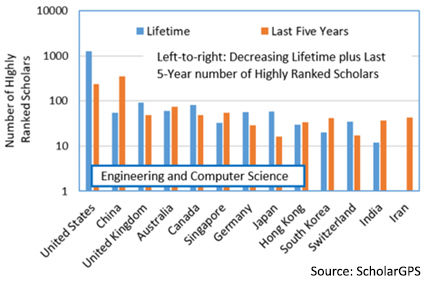
Fig. 3. Countries/regions with the most Highly Ranked Scholars™ (Lifetime and Five Years) in Engineering. Numbers are shown for the top 10 countries/regions of either category (Five Years, N5, or Lifetime, N∞). Countries/regions are shown in order of decreasing N5 + N∞.


