

Ponder’s (ongoing) journey to 100,000 events per second
Since the very first commit nearly three years ago, Ponder has been focused on delivering peak performance.
In recent months, we’ve made significant progress towards our longstanding goal of processing 100,000 events per second across diverse indexing workloads.
In this post, we'll share a few of the key optimizations that make Ponder fast and some insights we’ve gathered along the way.
Performance is very important for a framework like Ponder, because it allows developers to rapidly and freely iterate, focusing on their business logic instead of restraints introduced by the tool. Over time, this creates faster feedback loops and better end user experiences.
We use end-to-end benchmarks, unit benchmarks, flamegraphs, and real-world user metrics to identify performance bottlenecks and measure the impact of our changes.
Ponder's architecture
Ponder is essentially an ETL framework – it extracts data from an Ethereum node through the JSON-RPC API, transforms the data with user-defined indexing functions, and loads the results into Postgres.
Internally, a Ponder app has two main phases. The historical backfill indexes events from the designated "start" of the app up to the current point in time. Then, the realtime phase indexes newly produced blocks, processing them immediately.
An “event” is a unit of onchain data that triggers an indexing function – blocks, transactions, logs, and traces can all be events depending on the project configuration. The simplified goal of our performance work is to increase the number of events processed per second across a diverse range of user workloads.
Performance optimizations
We want to highlight three key performance optimizations from Ponder's transform step. The key bottlenecks in this step are 1) blocking database queries and 2) blocking RPC requests.
In-memory database
The transform step runs user-defined indexing functions, such as the one from our ERC20 example below. Indexing functions typically make one or many database function calls to write application ready data to the database.
import { ponder } from "ponder:registry";
import { allowance, approvalEvent } from "ponder:schema";
ponder.on("ERC20:Approval", async ({ event, context }) => {
// upsert "allowance".
await context.db
.insert(allowance)
.values({
spender: event.args.spender,
owner: event.args.owner,
amount: event.args.amount,
})
.onConflictDoUpdate({ amount: event.args.amount });
// add row to "approval_event".
await context.db.insert(approvalEvent).values({
id: event.id,
amount: event.args.amount,
timestamp: Number(event.block.timestamp),
owner: event.args.owner,
spender: event.args.spender,
});
});In early versions of Ponder, these store API methods – find(), insert(), update(), and delete() – each made one database query. This approach was simple and easy to maintain.
But – because Ponder processes events one-by-one – each database query blocks the entire indexing process. For systems with even a few milliseconds of latency between Ponder and the database, performance suffered.
In version 0.4.37, we introduced an in-memory buffer for database writes. With this design, the store API typically just adds a row to the in-memory cache, which is very fast. Behind the scenes, Ponder periodically flushes the buffer to the database in large batches using COPY.
This optimization makes it practical to use Ponder despite database latencies up to ~100ms.
In certain cases, the in-memory buffer can also serve reads (e.g. find and insert with onConflictDoUpdate) which further reduces the frequency of blocking database queries.
│ Event │ Count │ Duration (ms) │
├────────────────┼───────┼───────────────┤
│ ERC20:Transfer │ 13332 │ 0.008 │
│ ERC20:Approval │ 4274 │ 0.005 │The key trade-off with this design is higher memory usage, which requires careful management to avoid out-of-memory errors in large apps. More on that later.
Delayed errors
Let's take a deep dive into the db.insert() method.
This function throws an error if a row with the same primary key value already exists in the database (a unique constraint violation). To reliably throw this error, we have to query the database (and the in-memory buffer) to see if the target row is already there.
Unfortunately, this introduces a blocking database query for simple inserts (the most common database operation!). It’s especially bad when you consider that this query is almost always wasted work – only a tiny fraction of apps have logical errors that would cause a unique key constraint.
We released our solution in 0.9.20. To avoid the blocking queries, we simply wait to detect & report the unique constraint error until the row gets flushed to the database. If we get an error, we have a mechanism to figure out exactly which indexing function was responsible, and we use that information to construct a useful error message.
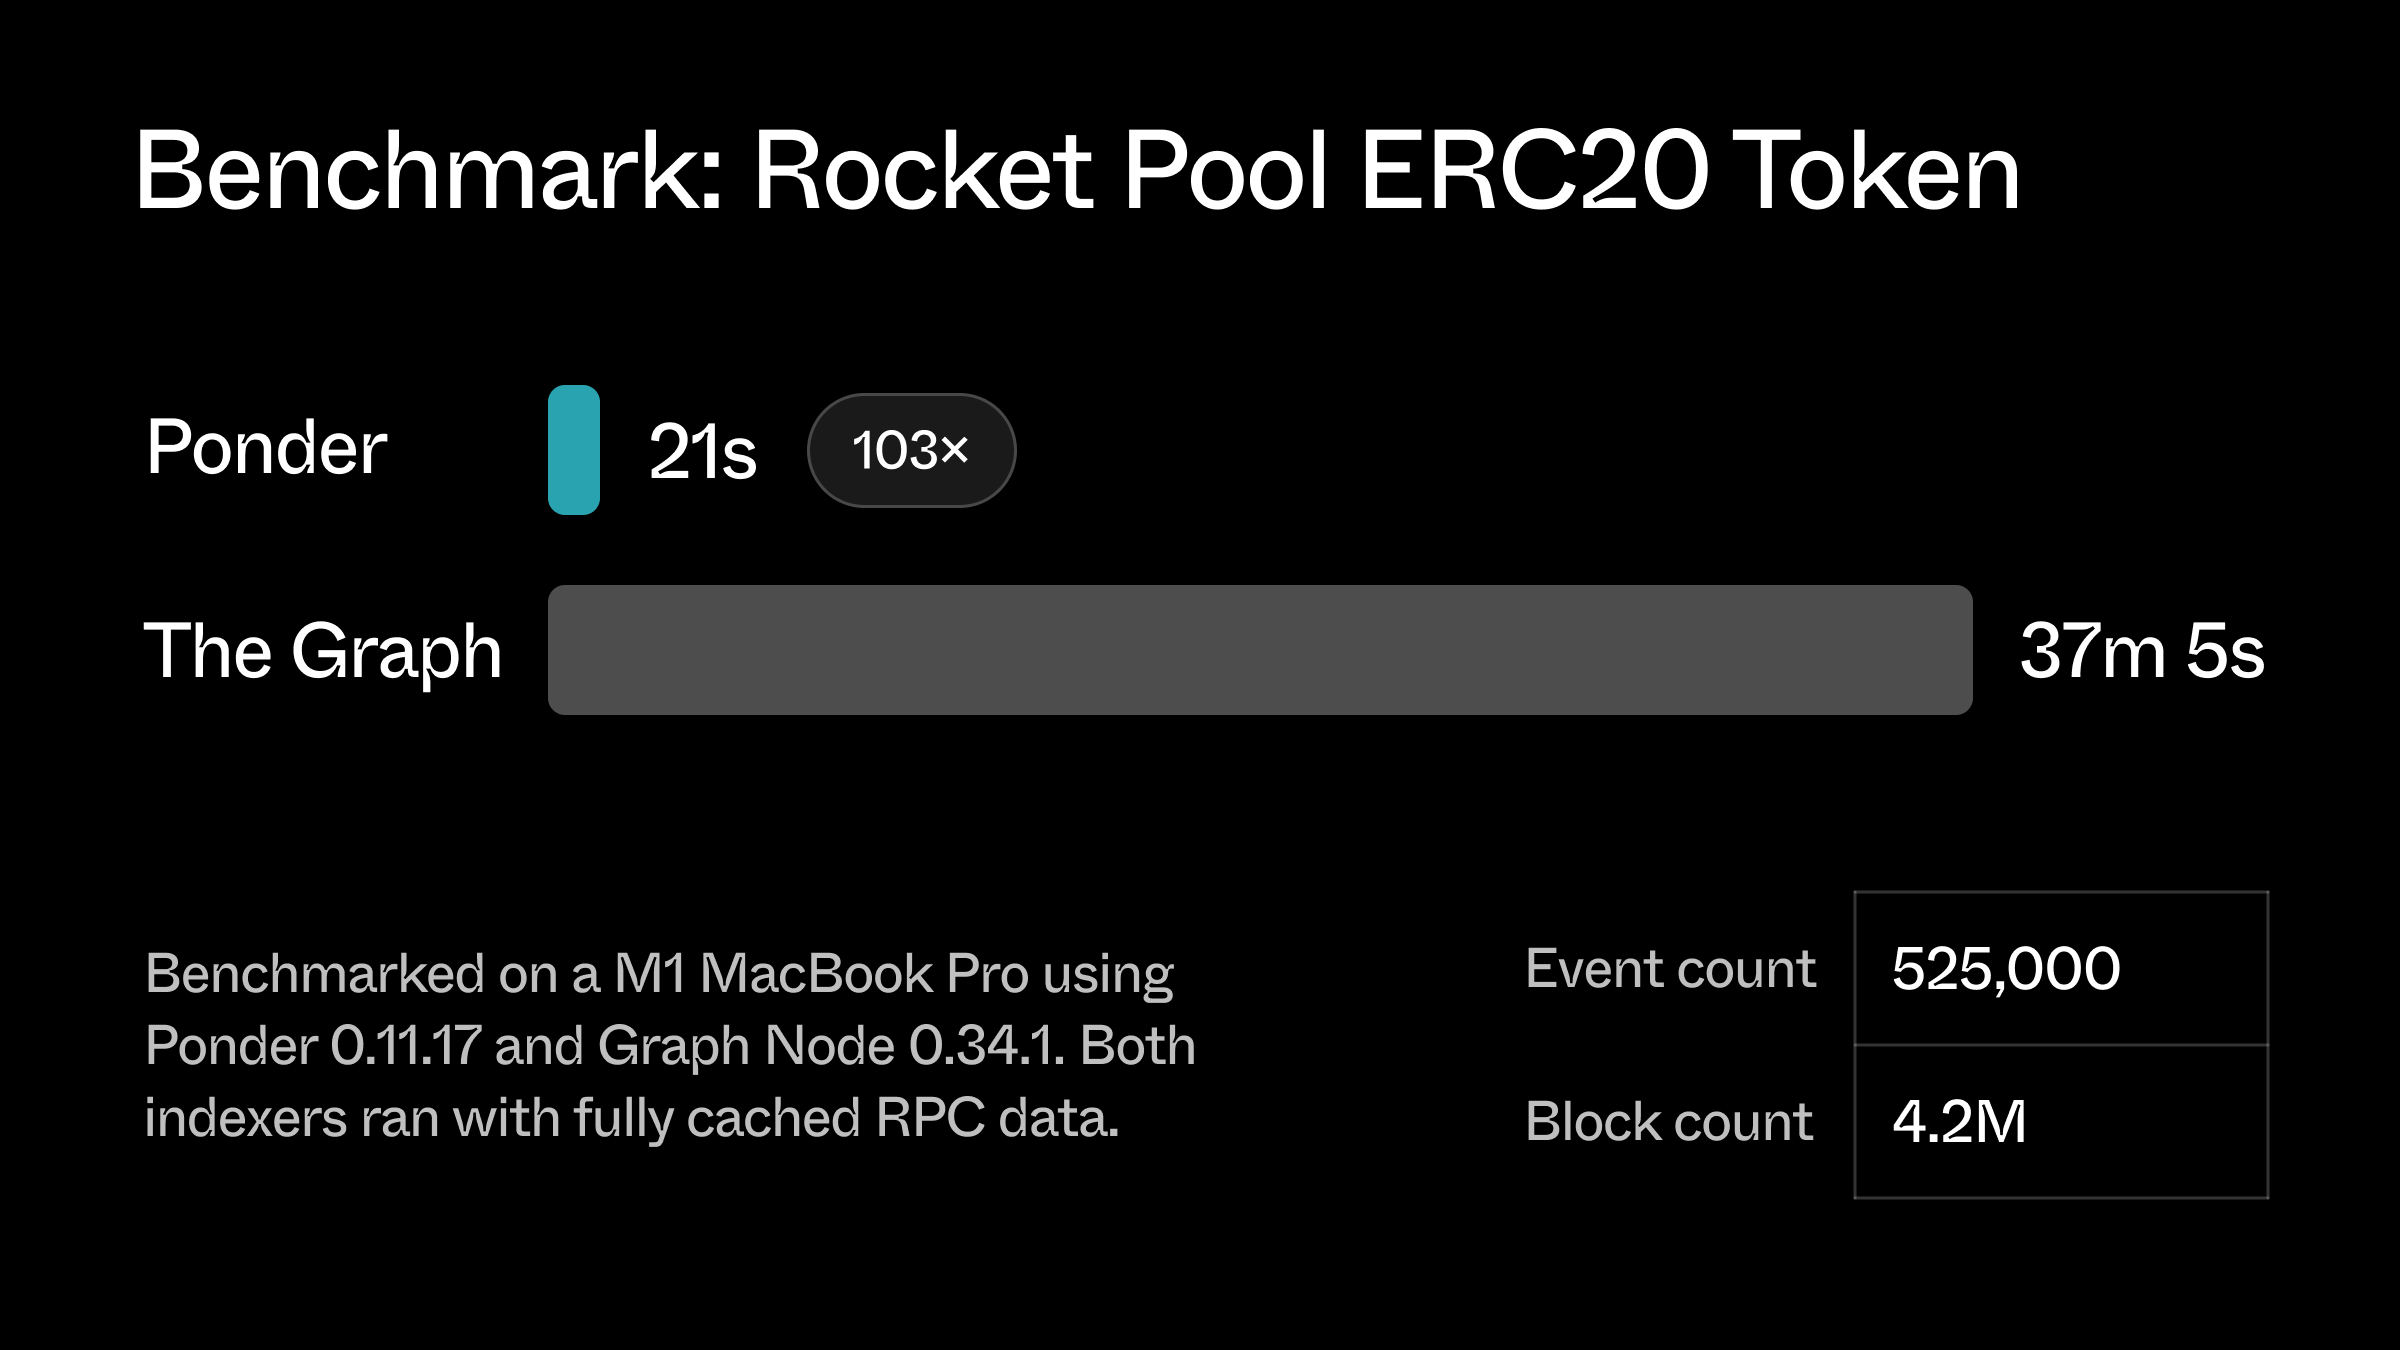
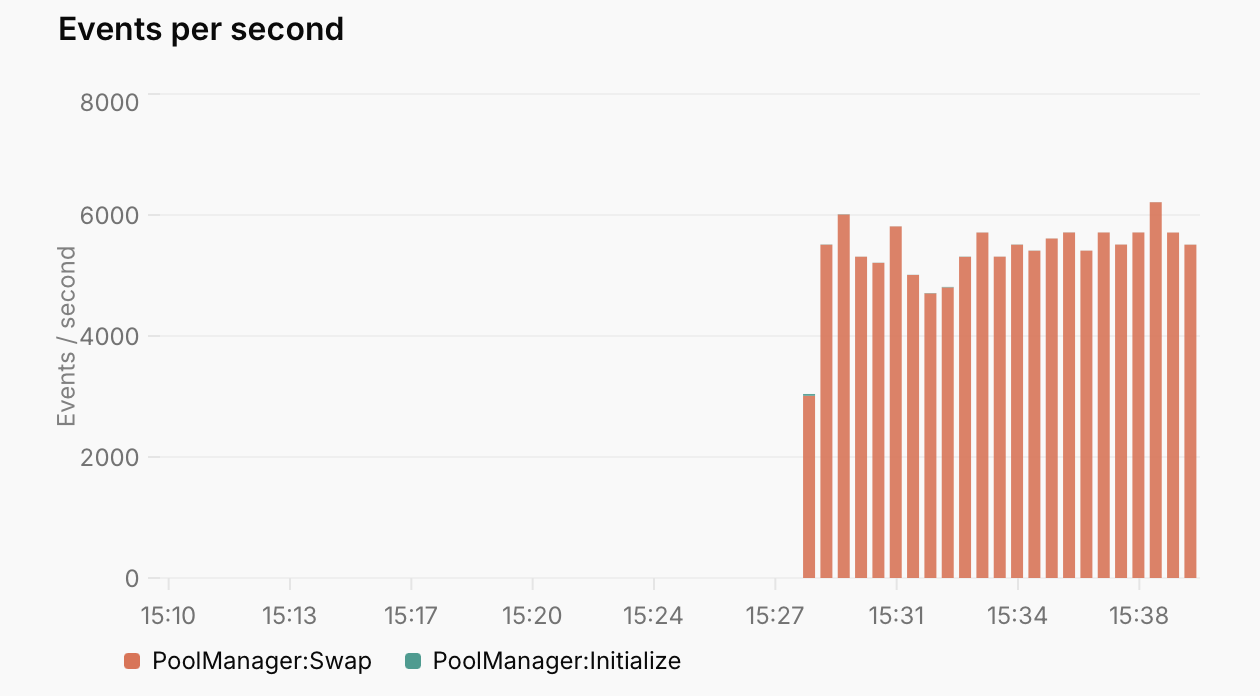
This optimization sped up our Uniswap V4 benchmark project by ~10x.
Speculation
What happens when the in-memory buffer gets too large? At first, we used a simple LRU algorithm to periodically evict rows from the cache that hadn’t been accessed in recent indexing functions. To our surprise, we saw very low cache hit rates with this approach. It turns out that recency is not a strong predictor for most indexing workloads.
Instead, we noticed that the best predictor for which database rows a specific indexing function would access is the event body itself. Ponder apps often use event properties like block.timestamp, log.address, and decoded log arguments as primary key values.
ponder.on(“ERC20:Transfer”, async ({ event, context }) => {
// Ponder profiles the database query and prefetches the result
const sender = context.db.find(accounts, { address: event.args.from });
});This direction proved fruitful. Drawing inspiration from JavaScript engines, we designed a pre-fetching algorithm that works like this:
- Profile: Continuously profile indexing function logic to record statistics about which database rows get accessed. The profiling data encodes concepts like: The
ERC20:Transferindexing function always runs a query whereaccount.address = event.args.from. - Predict: For each new batch of events, use the profiling data to predict which database rows will be accessed while processing each event.
- Prefetch: Send batch queries to the database to fetch all the predicted rows, and insert them into the in-memory cache.
The profiling step also handles compound primary keys and static/constant primary key values.
As a bonus, it turns out that the same approach works well to pre-fetch RPC requests made with context.client. If the profiling data indicates with >80% confidence that an indexing function will make a specific RPC request, Ponder kicks it off ahead of time.
ponder.on(“Erc20:Transfer”, async ({ event, context }) => {
// Ponder profiles the RPC request and prefetches the result
const data = await context.client.readContract({
abi: erc20Abi,
functionName: “balanceOf”,
address: event.log.address,
args: [event.args.from],
});
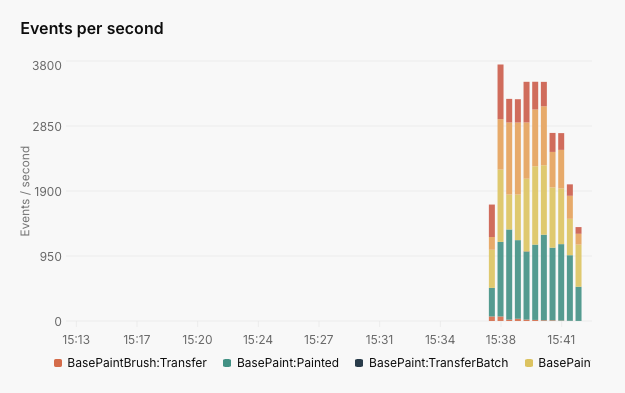
})We released speculation in 0.10.8, and it was a major performance win for most apps – our BasePaint example project got 6x faster.
What didn't work
It's also important to consider what didn't work and what can be learned from it. From versions 0.2 to 0.4, we implemented a static analysis feature to parse user code and extract the tables that each function reads and writes to. Ponder would use this information to run indexing functions out of order, sometimes multiple at a time.
While theoretically this would be faster than a single stream of events, it was very complex and fragile. We had many regressions and the dynamic, concurrent nature made it very difficult to debug. Luckily, we were able to take a step back and realize we were not getting the results that we wanted and ended up removing the feature entirely. The main takeaway from this is safe and simple fallback mechanisms are important when dealing with diverse and unknown user code.
Future optimizations
We haven’t yet achieved our goal of 100,000 events per second. There are still many ways to make Ponder even faster. Some ideas are:
- Multi-threading: NodeJS is single-threaded. Today’s fastest apps – particularly where speculation is working well – are often bottlenecked by the CPU.
- Better pipelining: Each step of the ETL can be performed at the same time. Only the slowest step should be the overall bottleneck.
- Column selection: Most data (
block.logsBloom,transaction.input) passed to indexing functions never gets used. - Node-API: Computationally expensive functions such as
checksumAddresscan benefit from native code.
If any of these ideas excite you, please check out our GitHub or reach out to [email protected].