Dashboard logs and troubleshooting
Discover logging and troubleshooting information available in the Plaid Dashboard
Logs for webhooks, Link, and API requests
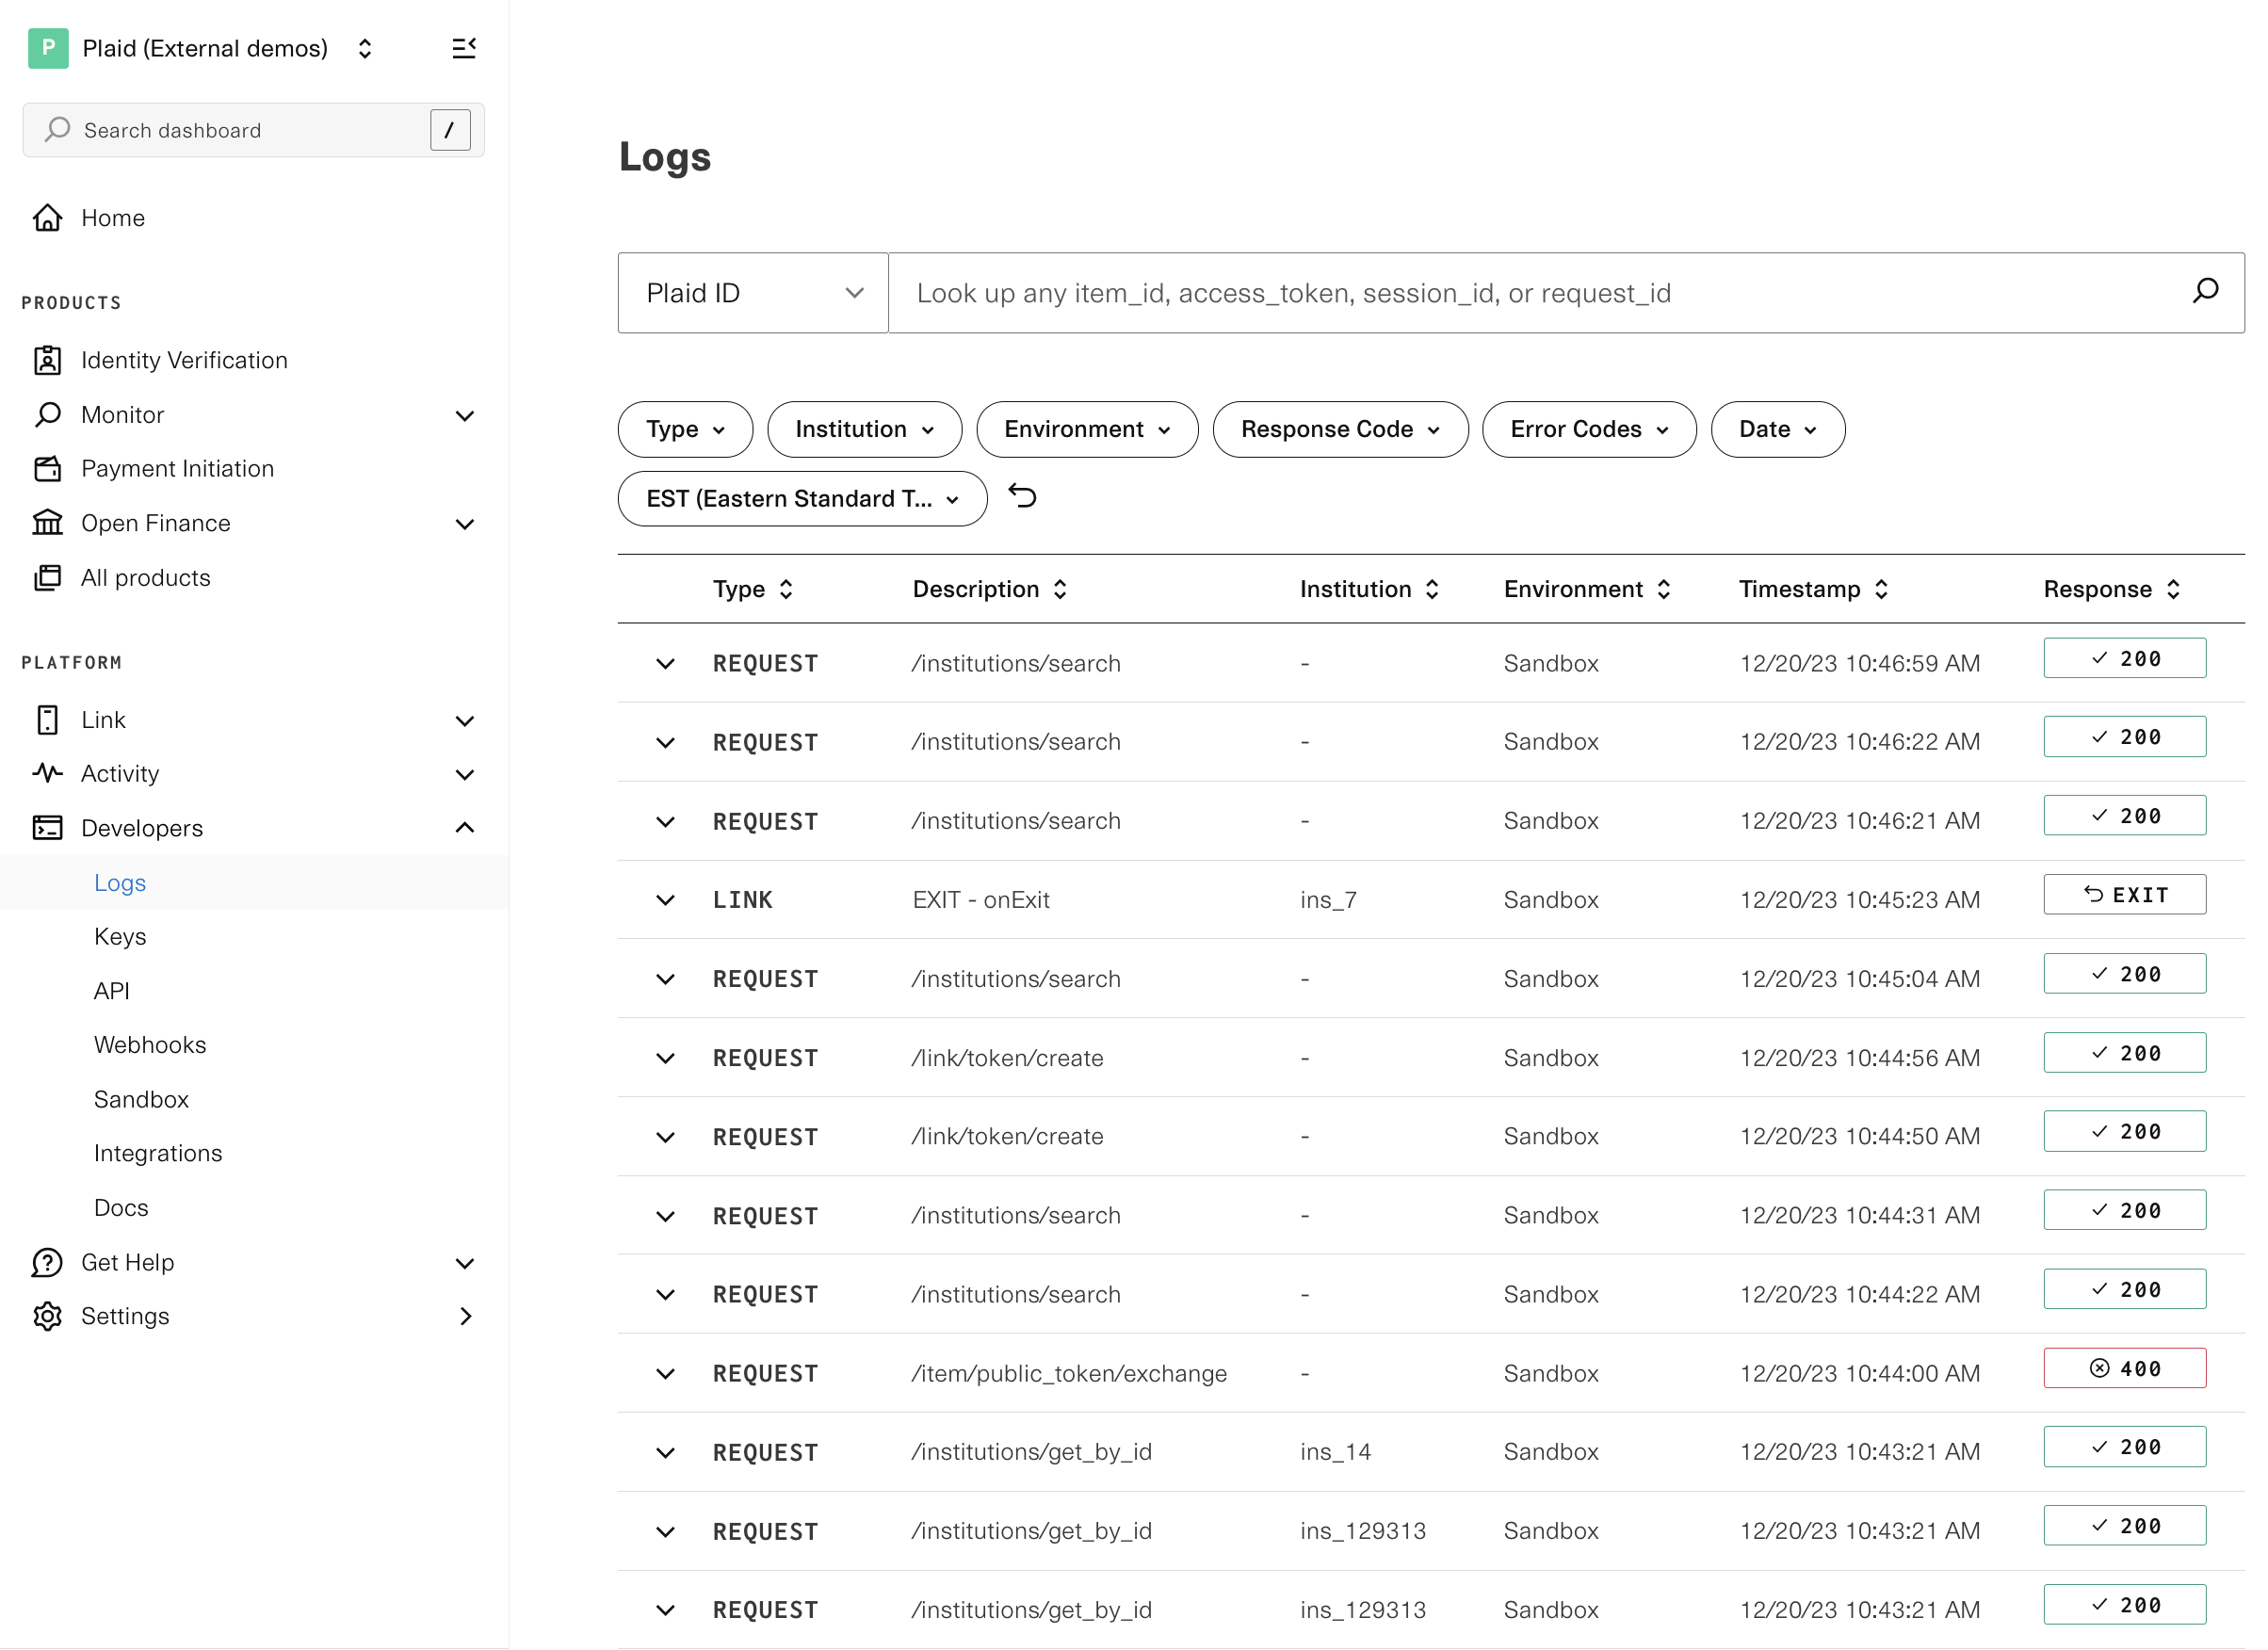
The Plaid Dashboard Logs page shows the past 14 days of API activity. Using the dashboard, you can see a record of all requests and responses, as well as all webhooks sent by the Plaid API, and all Link events.
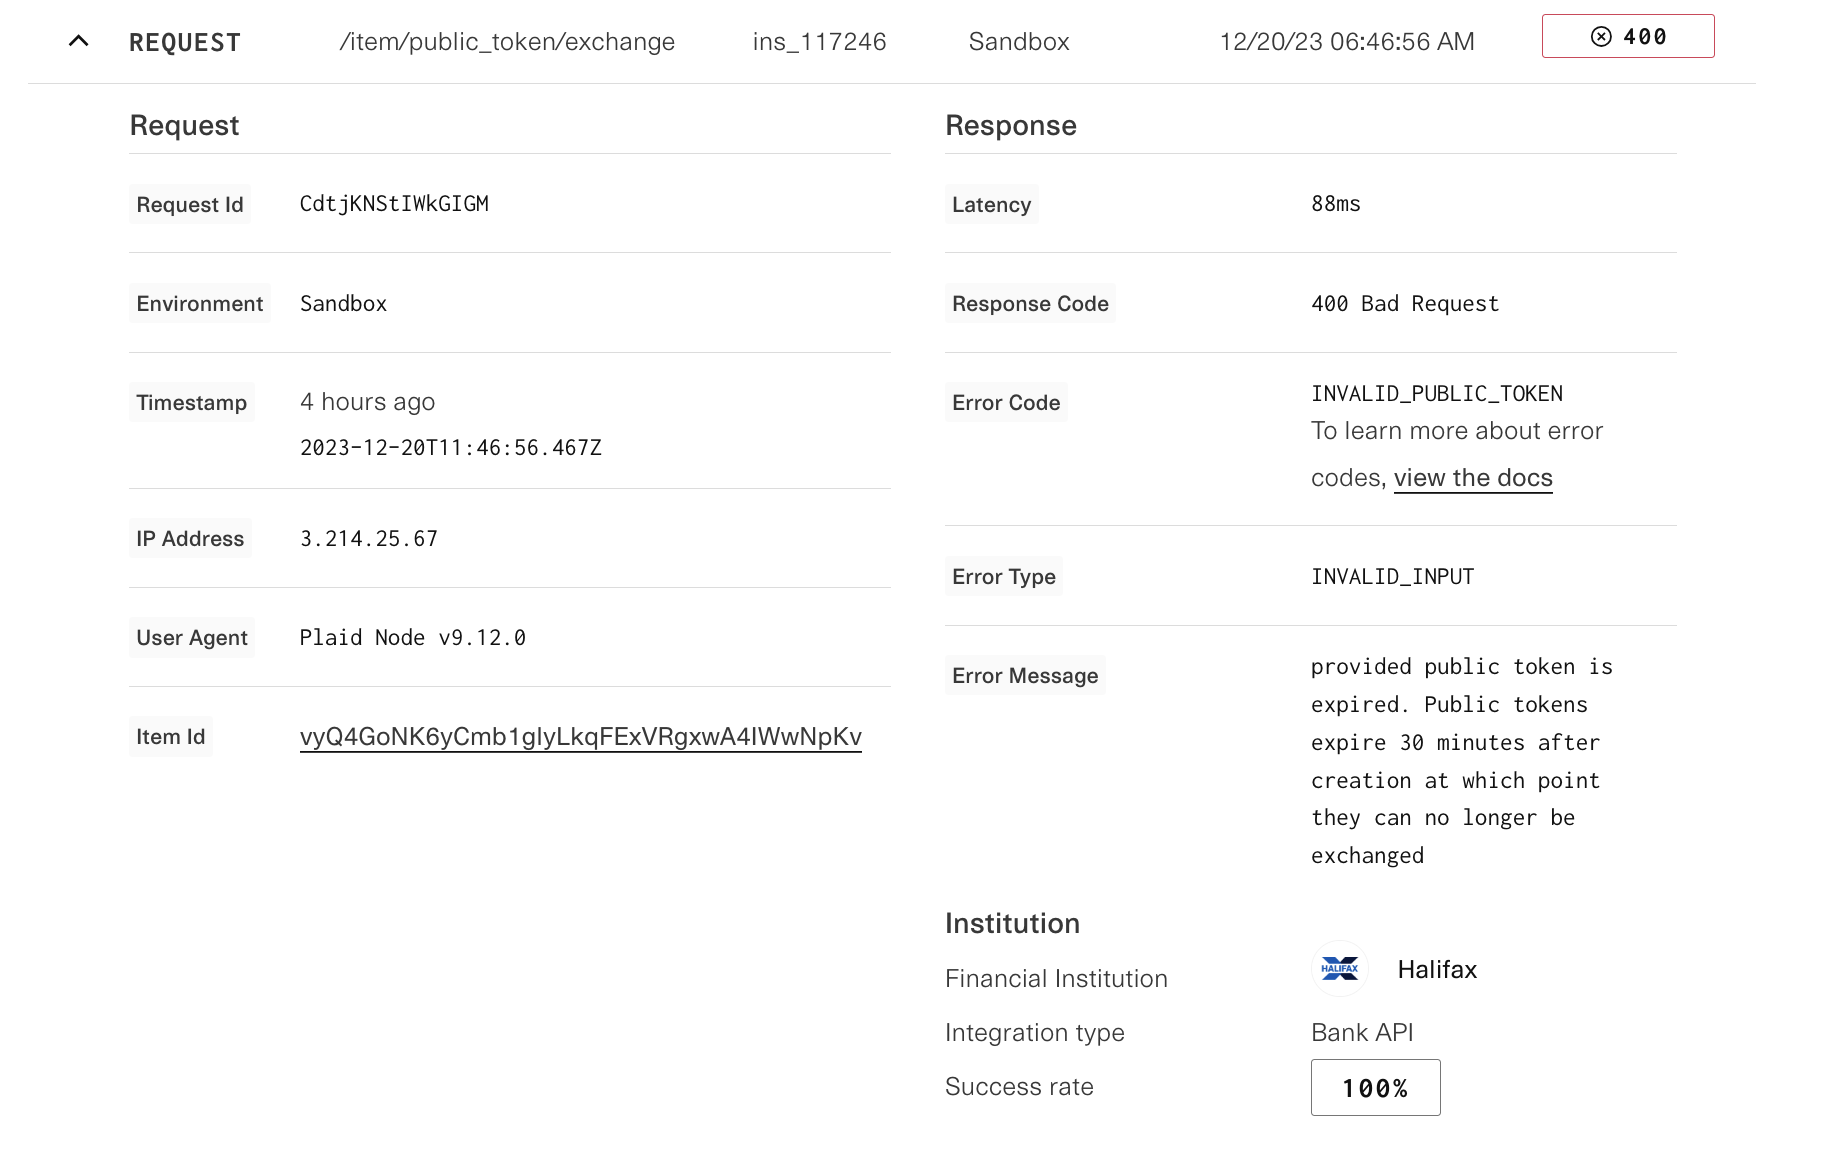
You can view the details of any request, response, webhook, or event, and view error information for any failed API request.
Link analytics
The Link analytics page in the Dashboard shows a summary of Link conversion, along with top Link errors your users are experiencing and recommendations for increasing conversion. For more details, see Link conversion.
Logs for billable activity
The Plaid Dashboard Usage Page shows billable API usage for most Plaid products. Usage data is also available via the Plaid MCP server, allowing you to interact with this data via chat or an LLM agent. For more details, see the blog post on the Plaid Dashboard MCP server and the Plaid Dashboard MCP server documentation.
Logs for Payment Initiation, Transfer, and Signal
The Payment Initiation (UK and Europe), Transfer, and Signal products also have their own logs in the Plaid Dashboard. If you are enabled for these products, links to view activity will appear in the Products menu within the dashboard. Using these logs, you can view the status and history of payment and transfer attempts, returns, and other product-specific information. For Payment Initiation and Transfer, this information is also available via the API; for more details, see the API documentation for Payment Initiation and Transfer.
Audit logs
Audit logs of activity occurring in the Dashboard are available to admins on teams with Premium Support Packages. To learn more about upgrading to a Premium Support Package, contact your account manager.
Dashboard audit logs include user identity, action type, IP address, and timestamps for core Dashboard actions. Audit log support for actions on product-specific Dashboard pages is not yet available.
Troubleshooting institution insights
The Plaid Dashboard contains an Institutions page, which allows you to view details and stats about institution connectivity over the past two weeks, as well as any recent downtime or special notes about the institution. Most of this information is also available via the API; for more information on programmatically retrieving institution insights, see Institutions API endpoints.
Because institution insights are based on your team's Production user activity, the Institutions page is only available to teams with Production access.
You can search the Institutions page by institution name, institution ID, Item ID, request ID, or Link token.
Institution details
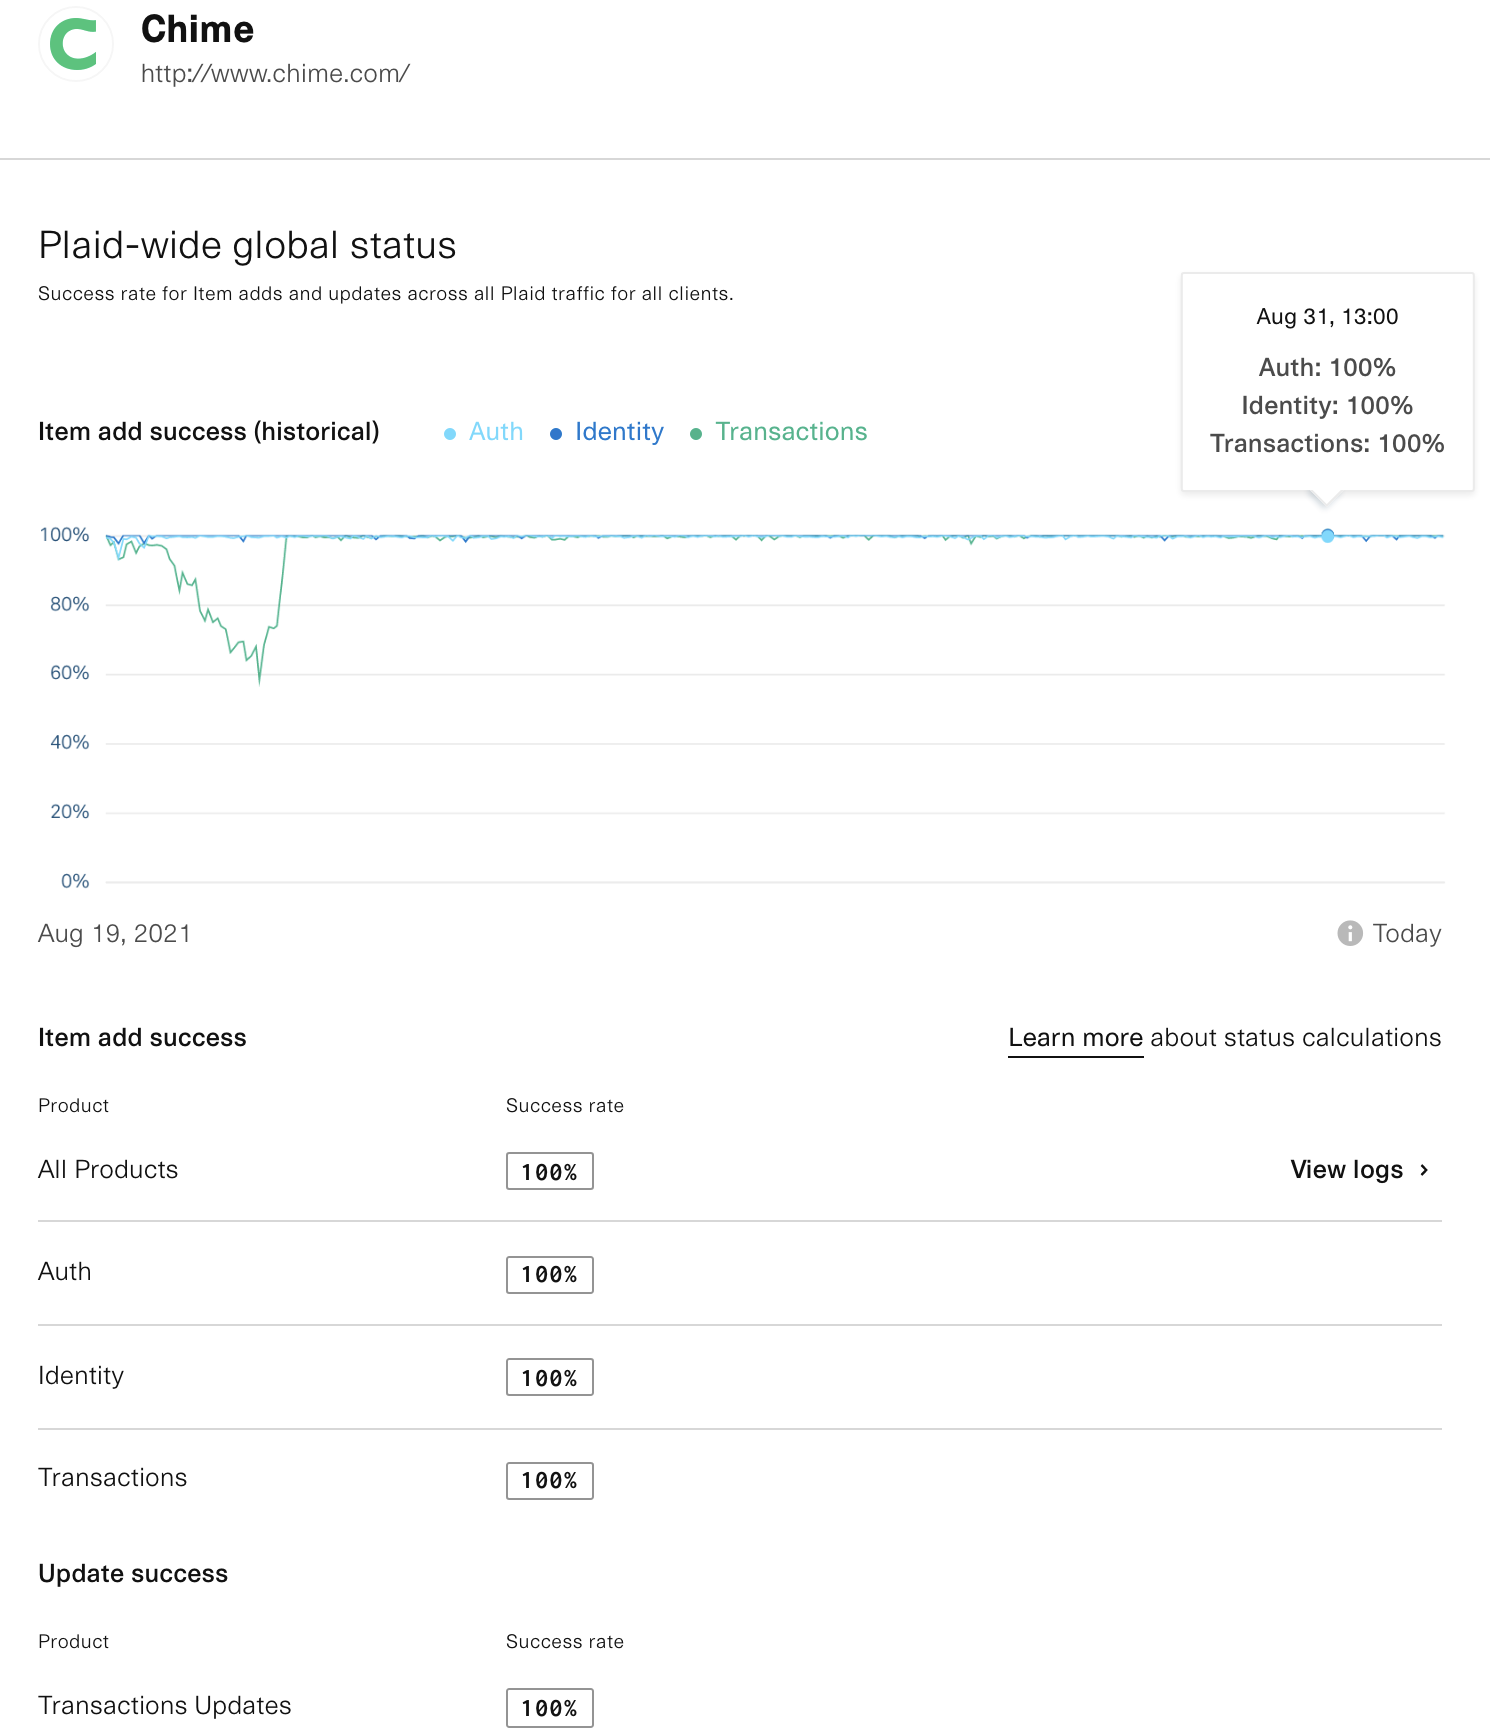
Plaid displays both New connections success rates (success adding new Items) and Existing connection updates success rates (success refreshing data for existing Items).
All success rates reflect the percentage of successful attempts to retrieve data. Plaid errors, institution errors, and user errors (e.g. failing to enter a correct password) are all combined when calculating the percentage of unsuccessful attempts.
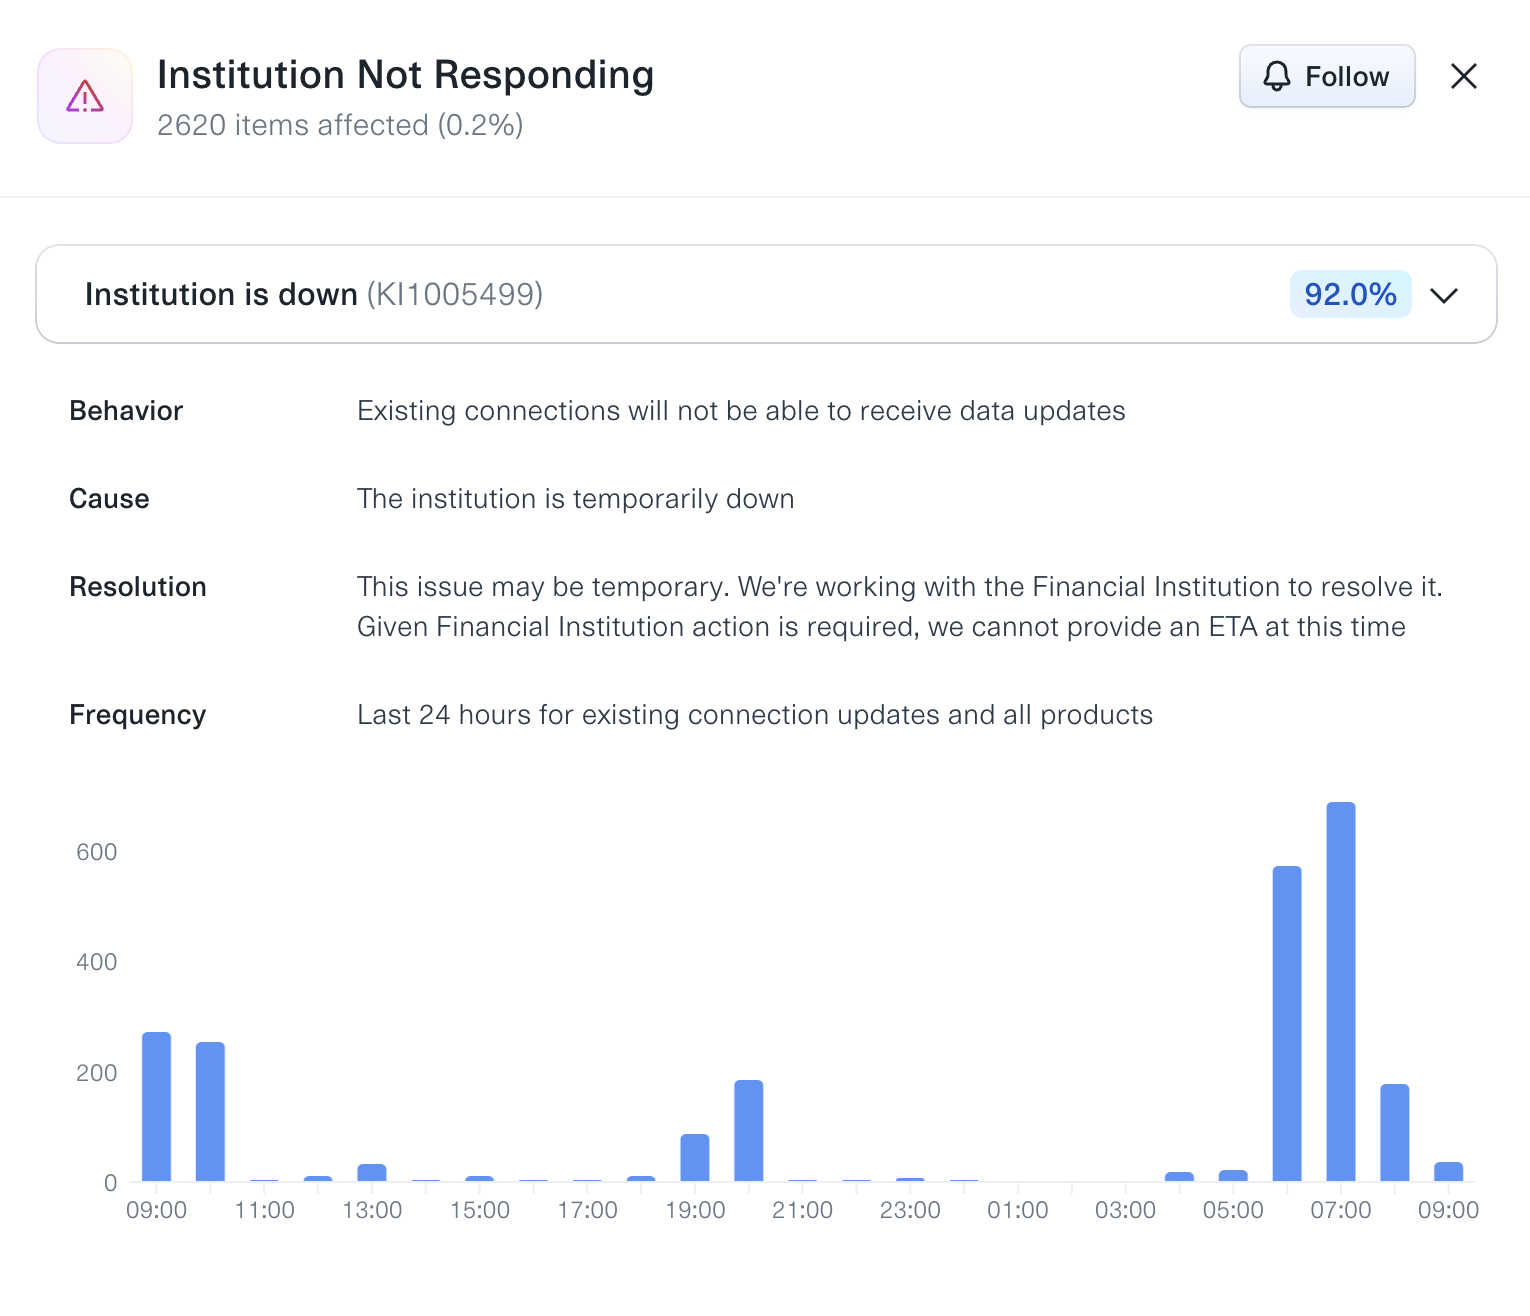
When viewing an institution, you can also see a breakdown of errors, including the number of your Items that the error impacts, as well as a list of all known issues related to that error. To subscribe to an issue and receive updates when it is resolved, click the "Follow" button on the upper right. Note that some known issues represent genuine user errors and cannot be resolved by Plaid.
Alerting
You can set up alerts to be notified of changes to the global Item add success rate of any institution. Alerts can be created directly from the institution's status page. You can also create and manage alerts from Settings > Team Settings > Communications; open the "Status alerts" tab to create an alert. If you choose webhook-based alerting, the webhook that will be sent is the INSTITUTION_STATUS_ALERT_TRIGGERED webhook.
Institution migration status
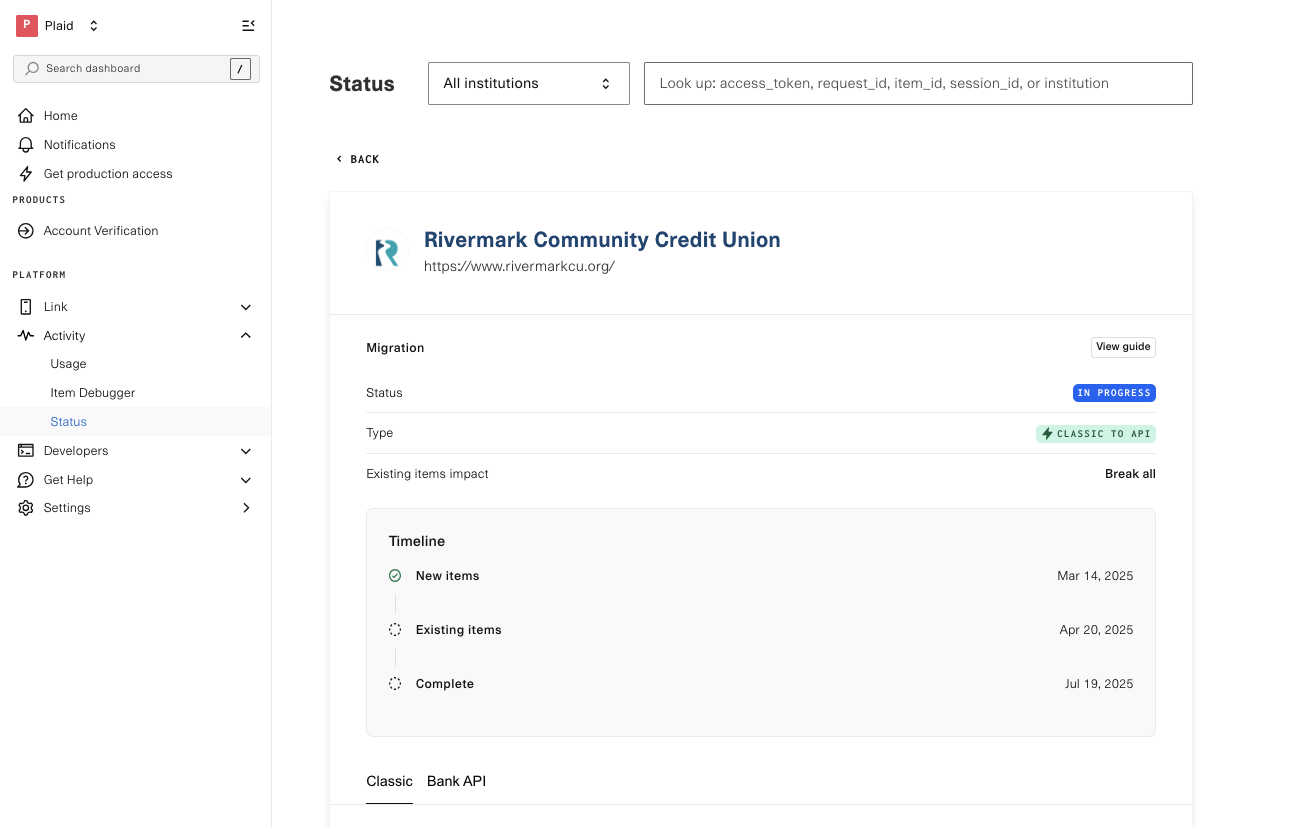
Within the Institutions page, you can use the Migrations tab to view the status of OAuth migrations. The Migrations tab shows all institutions with planned or current migrations and allows you to drill in to see the migration timeline and the impact on existing Items.
Troubleshooting with Item Debugger
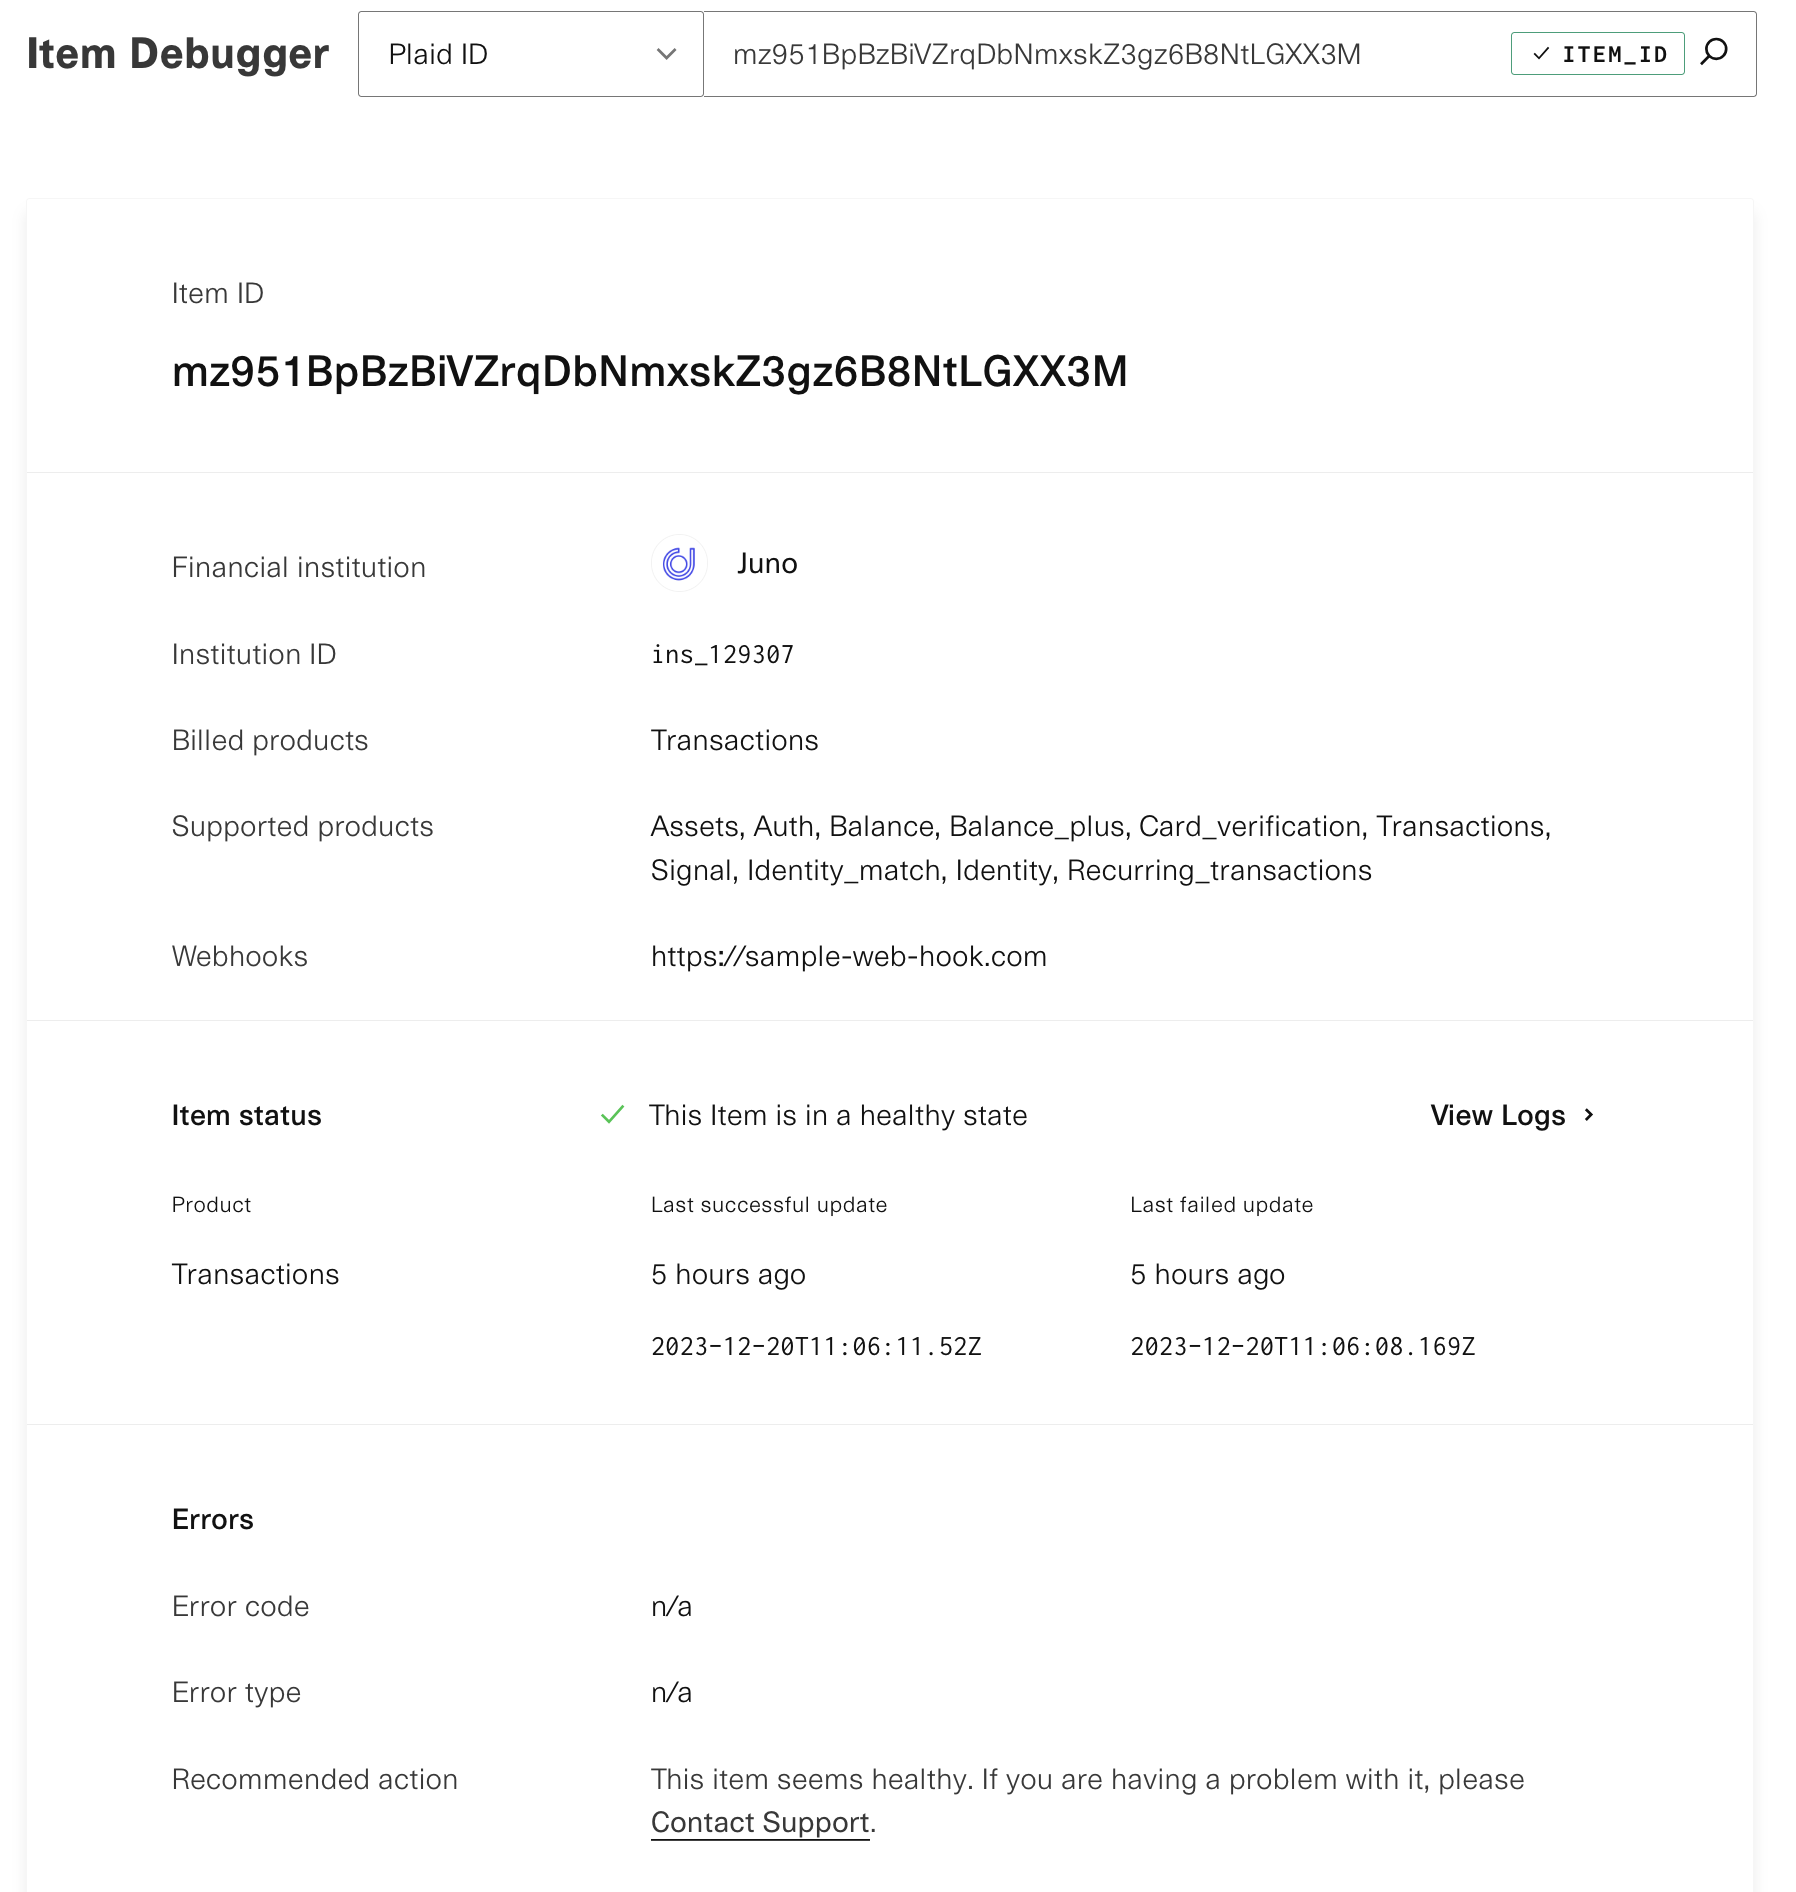
To view the status of a specific Item or Link session in the dashboard, you can use the Item Debugger. You can look up Items and Link sessions by client_user_id, item_id, access_token, link_token, or link_session_id. Troubleshooting information available includes error codes and suggested troubleshooting steps you can take to resolve any errors.
Access to the Item Debugger is also available via Plaid's Dashboard MCP server, allowing you to troubleshoot Item details via LLM chat or an agent. For more details, see the blog post on the Plaid Dashboard MCP server and the Plaid Dashboard MCP server documentation.