Cottonwood Fire Chars Utah

Jul. 8th, 2026 04:01 am
[syndicated profile] earthobservatory_iod_feed

Posted by Michala Garrison

June 5
June 29
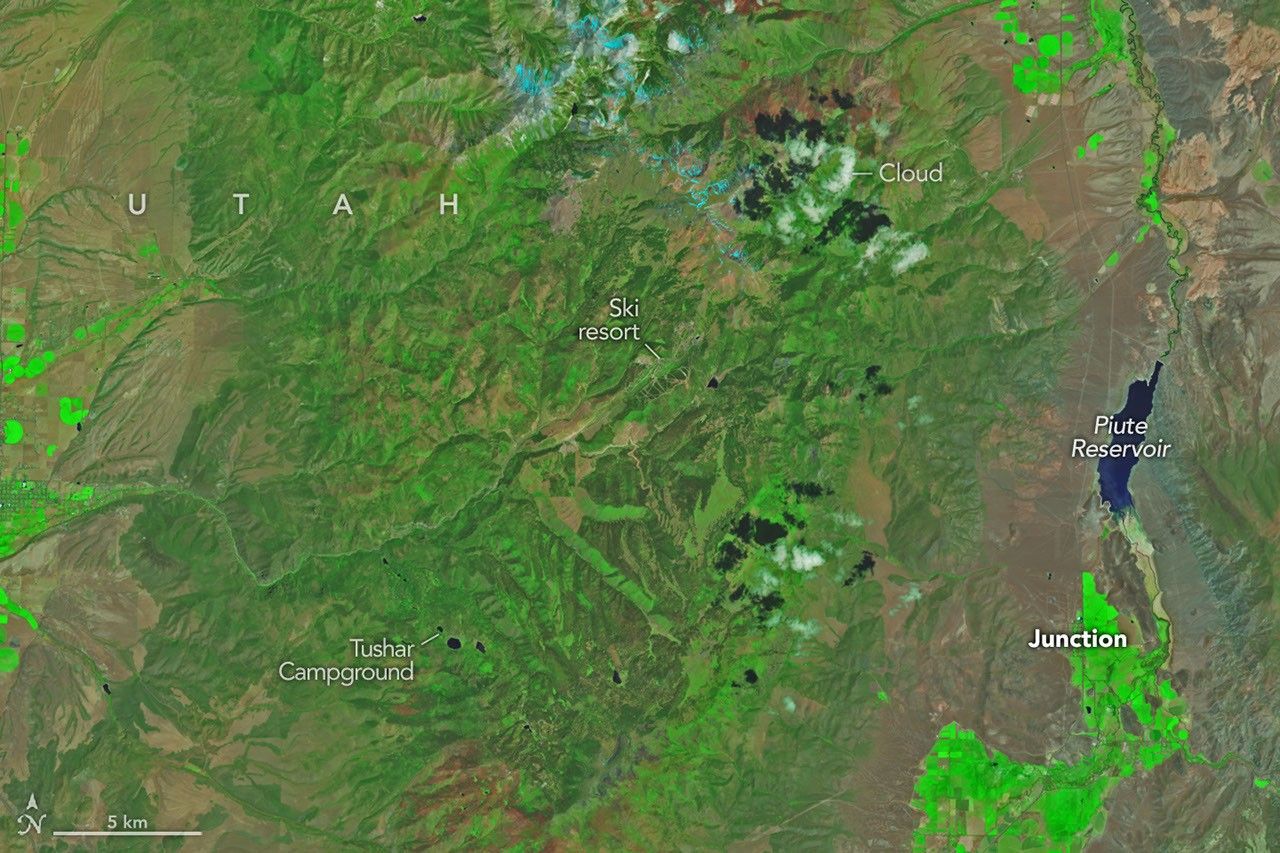
Mountainous landscapes appear green and untouched by fire in a satellite image acquired on June 5, 2026.
NASA Earth Observatory/Michala Garrison
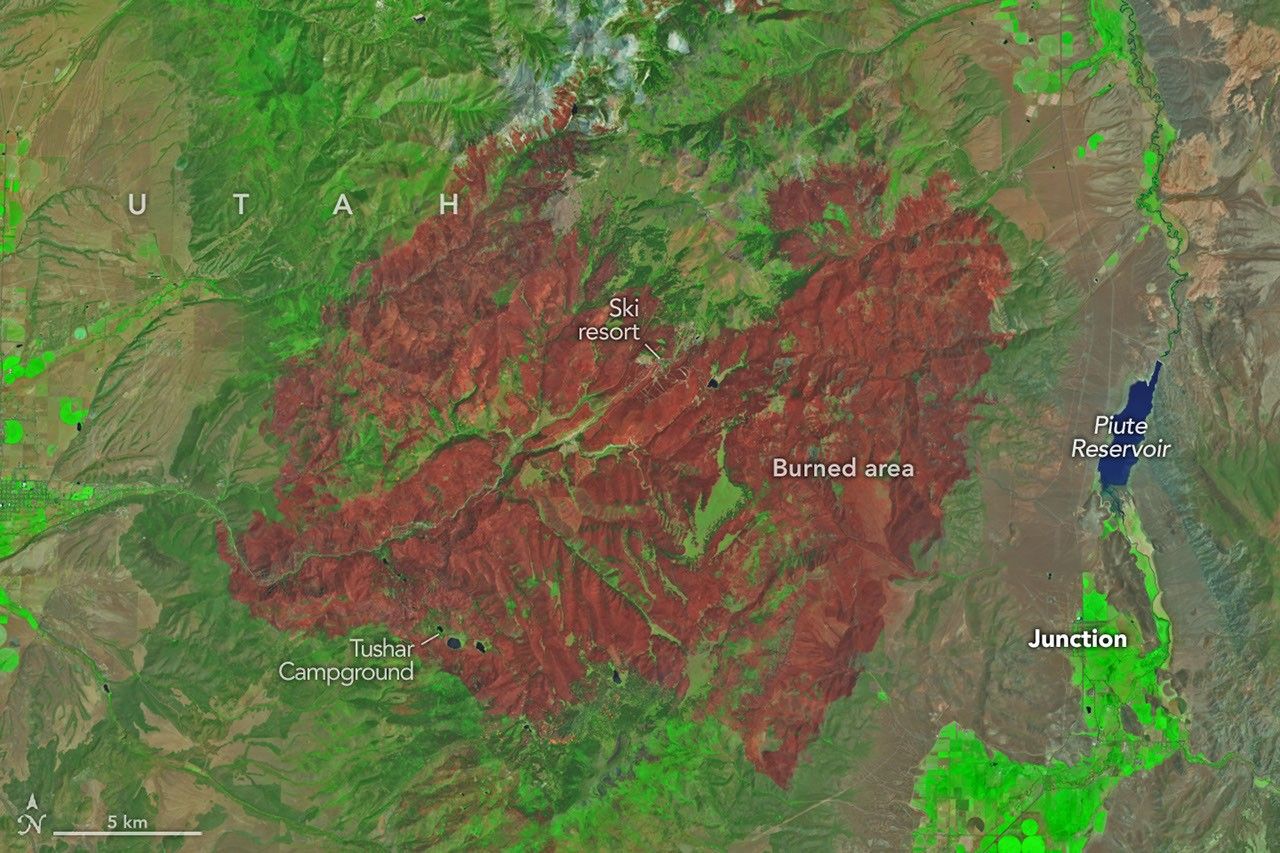
An image of the same area shows a large brown patch spanning much of the image in an image acquired after the fire on June 29, 2026.
NASA Earth Observatory/Michala Garrison
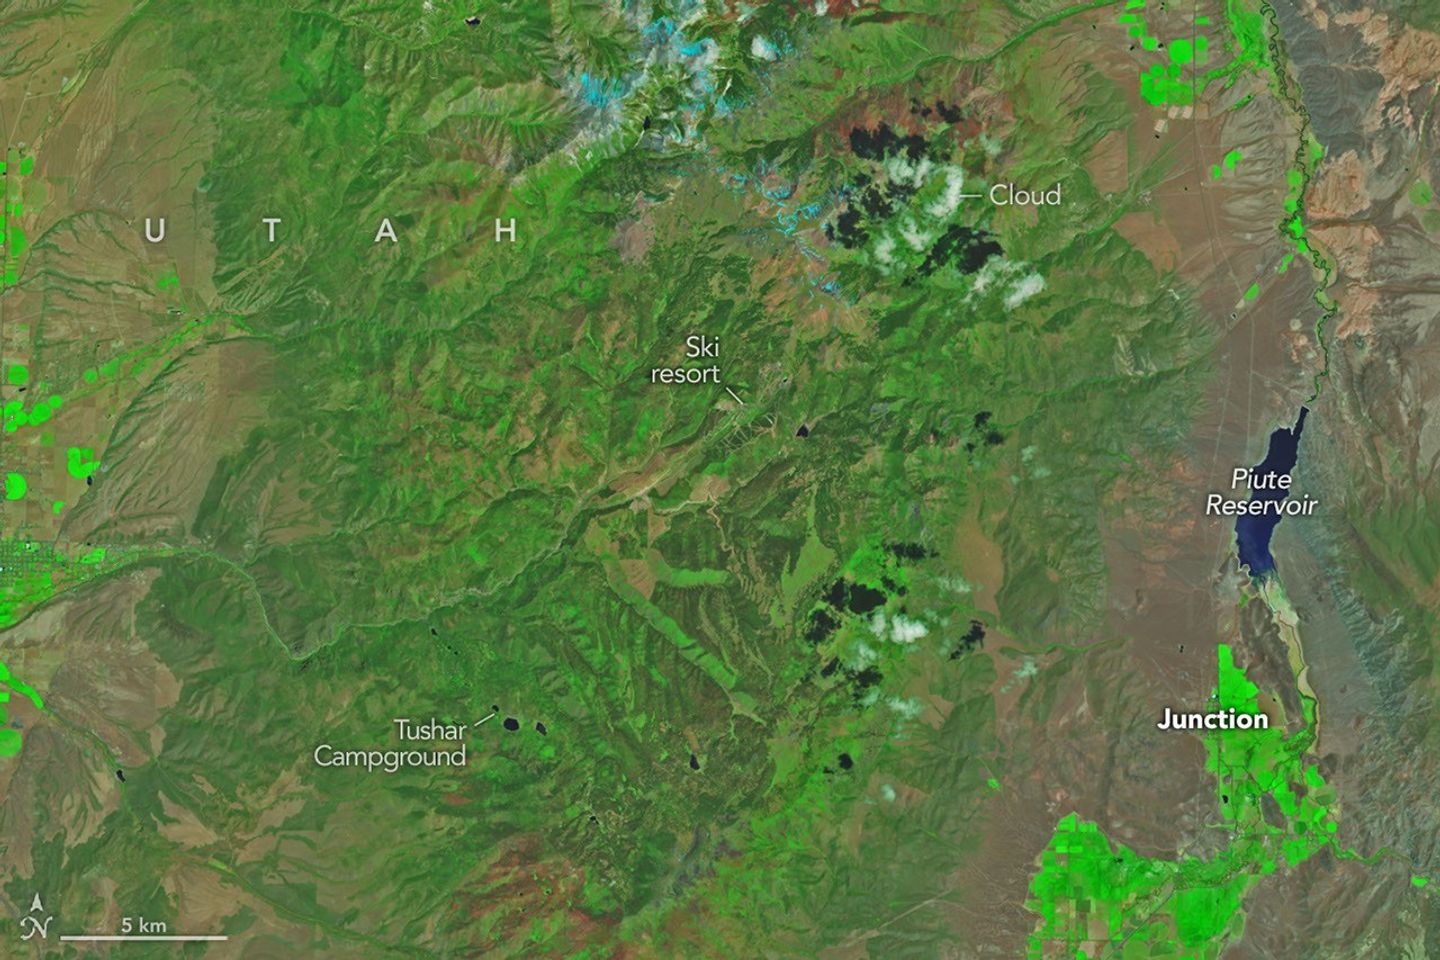
Mountainous landscapes appear green and untouched by fire in a satellite image acquired on June 5, 2026.
NASA Earth Observatory/Michala Garrison
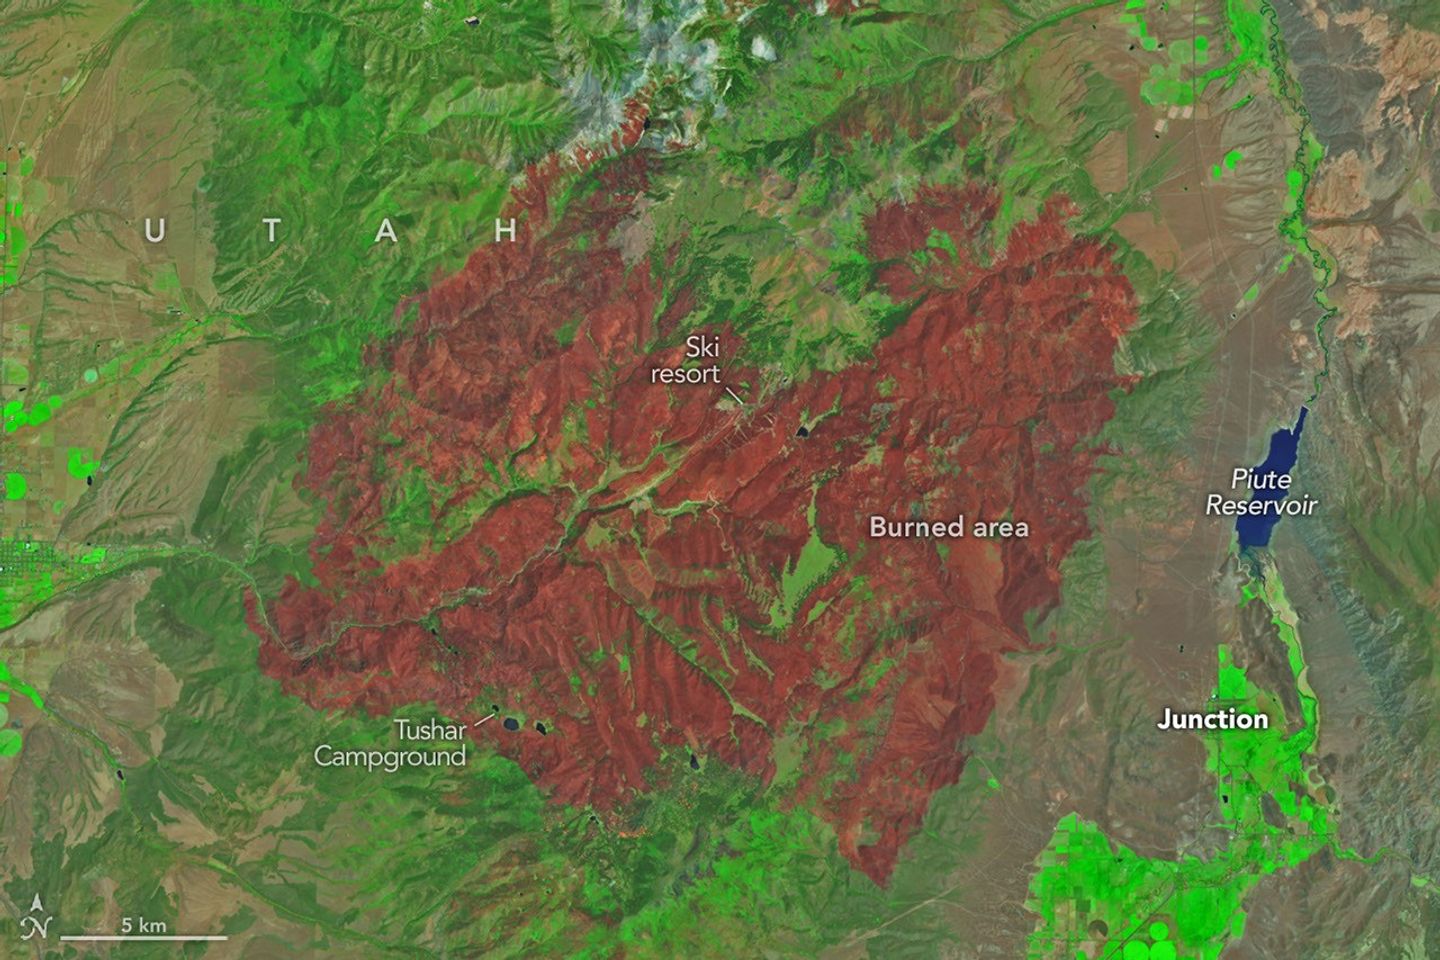
An image of the same area shows a large brown patch spanning much of the image in an image acquired after the fire on June 29, 2026.
NASA Earth Observatory/Michala Garrison
June 5
June 29
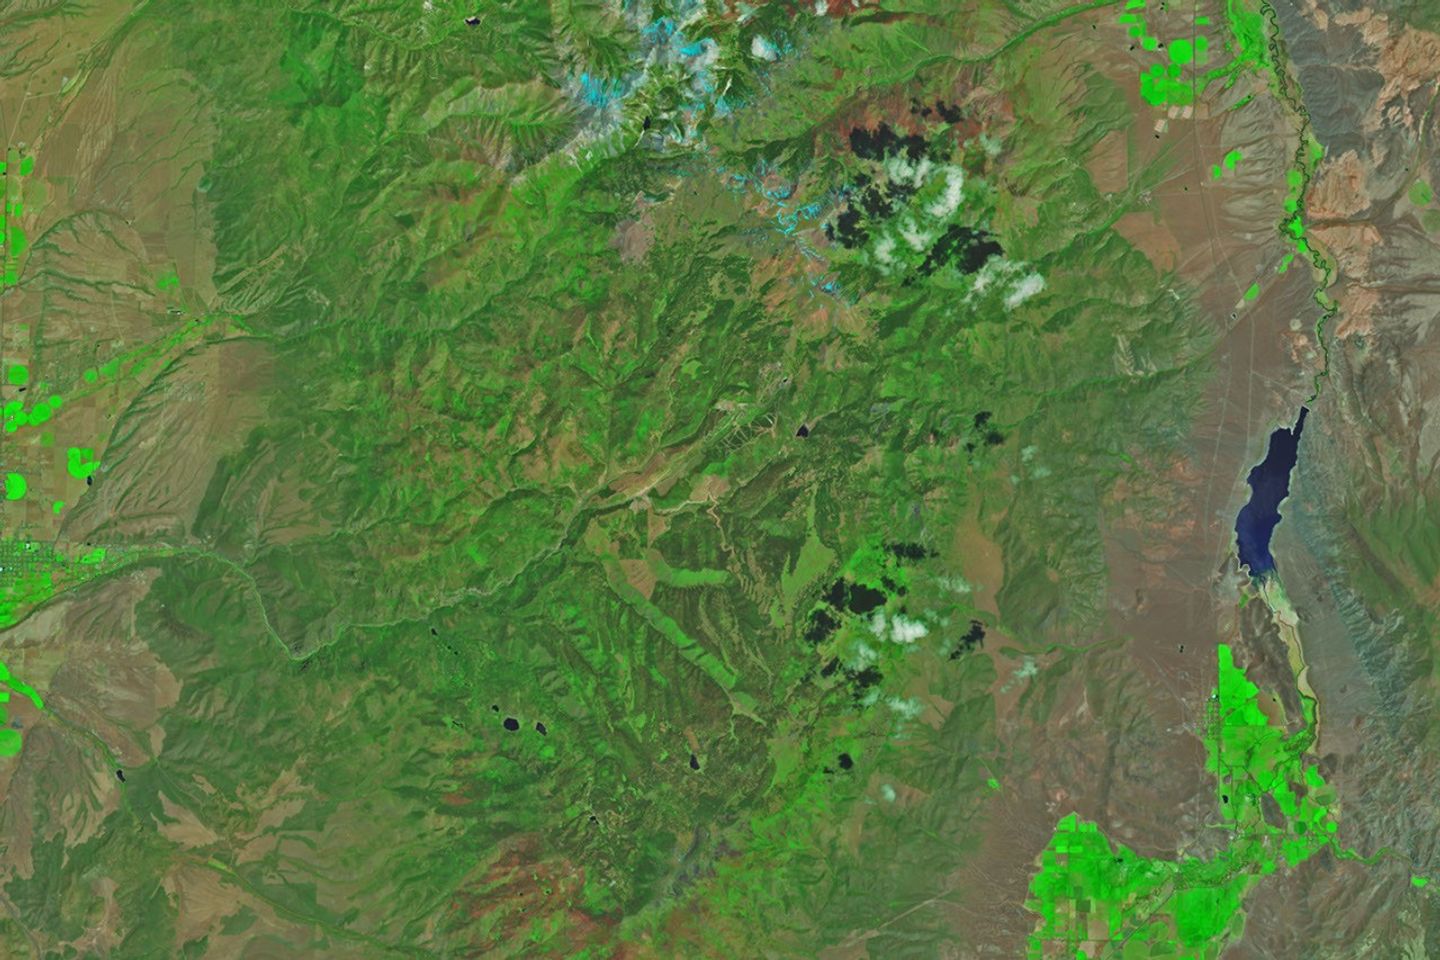
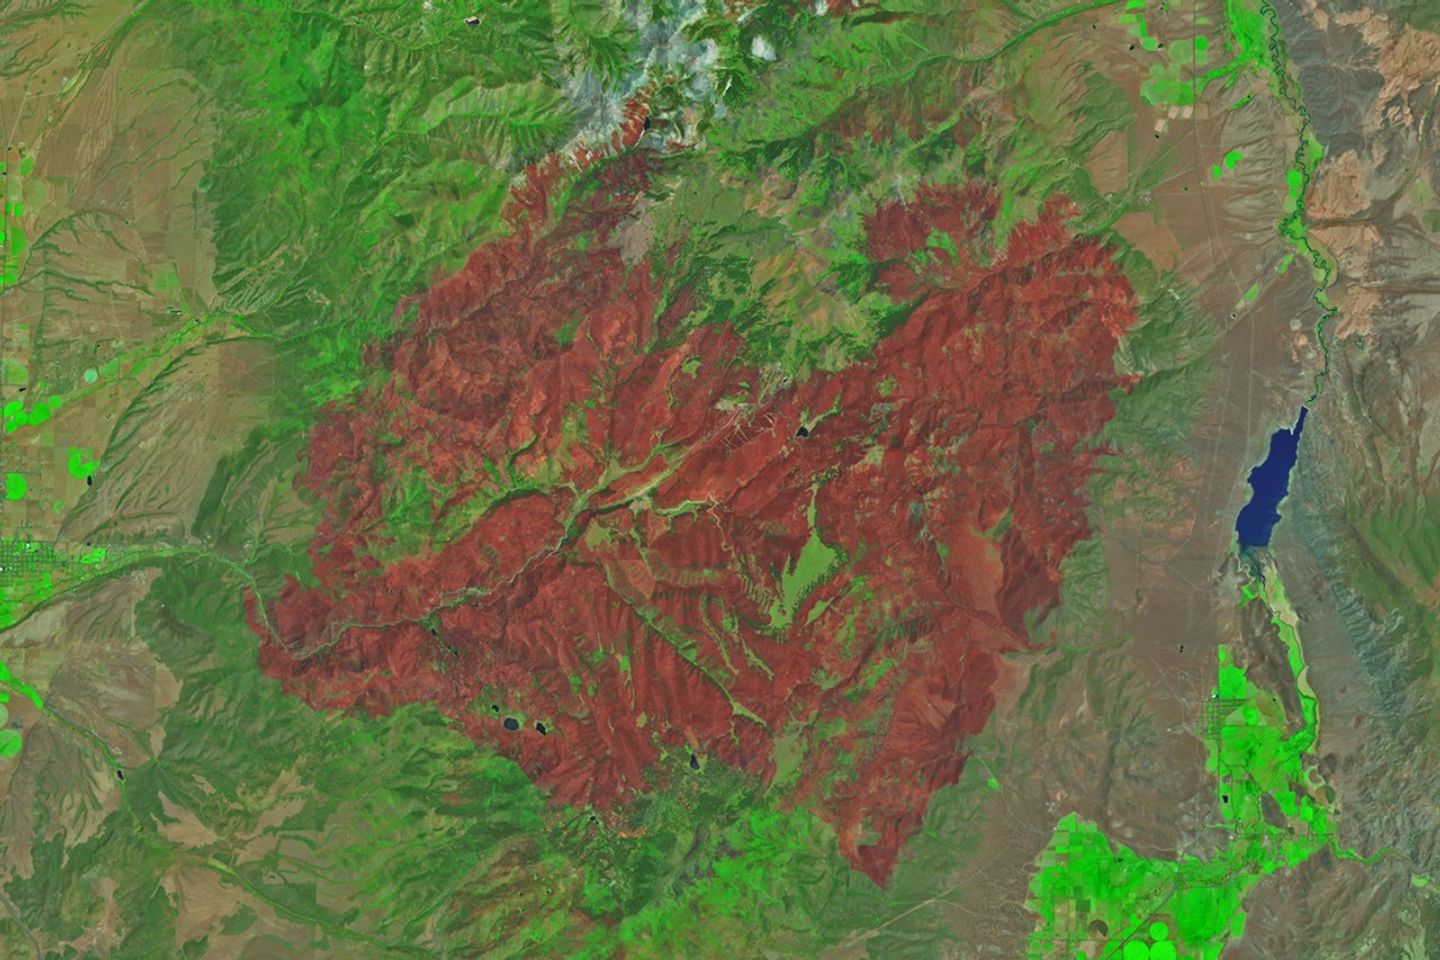
A burned landscape spans more than 150 square miles (390 square kilometers) of rugged terrain northwest of Junction, Utah, as seen in this pair of images captured by the OLI (Operational Land Imager) on Landsat 8 and Landsat 9 on June 5, 2026 (left) and June 29, 2026 (right). NASA Earth Observatory images by Michala Garrison.

After a winter of below-average snowpack and an unusually warm and dry start to summer, the National Interagency Fire Center warned that the Great Basin and parts of the Rockies faced an elevated risk of wildfires in July 2026.

The warning proved accurate. By July 7, firefighters labored to contain nearly three dozen large, early-season wildland fires that raced through forests in several parts of the western U.S. Utah was among the most active states, with fires having charred 558 square miles (1,445 square kilometers) and four major fires that were not fully contained still burning.

The Cottonwood fire ranked as one of Utah’s—and the country’s—largest and most destructive fires of the year so far. As of July 7, it had burned 150 square miles (390 square kilometers), just shy of the Babylon fire in eastern Utah. Landsat 9 captured the false-color image (bands 7-5-4) above (right) on June 29, 2026, when blackened vegetation spanned a large patch of rugged terrain along the Beaver River. The image on the left shows the same area on June 5, a few weeks before the fire ignited. In this band combination of shortwave infrared, near infrared, and visible light, unburned vegetation appears bright green, snow is blue, and clouds are white.

Ponderosa pine, oak, sagebrush, and grasses were among the vegetation types that burned. Officials with the state’s forestry division told news media that the Cottonwood fire had destroyed up to 150 structures. Eagle Point Ski Resort, which lost more than 100 condos and 30 cabins, also reported damage to four of its five chairlifts.

The damage to forests was extensive, though isolated patches survived largely unscathed, remaining as green oases within the broader burned area. Among them were the forests around Tushar Campground, the site of a 4-H summer camp. Beaver County officials credited years of forest treatments, such as clearing brush and trimming branches, with helping save the campground and surrounding forests.

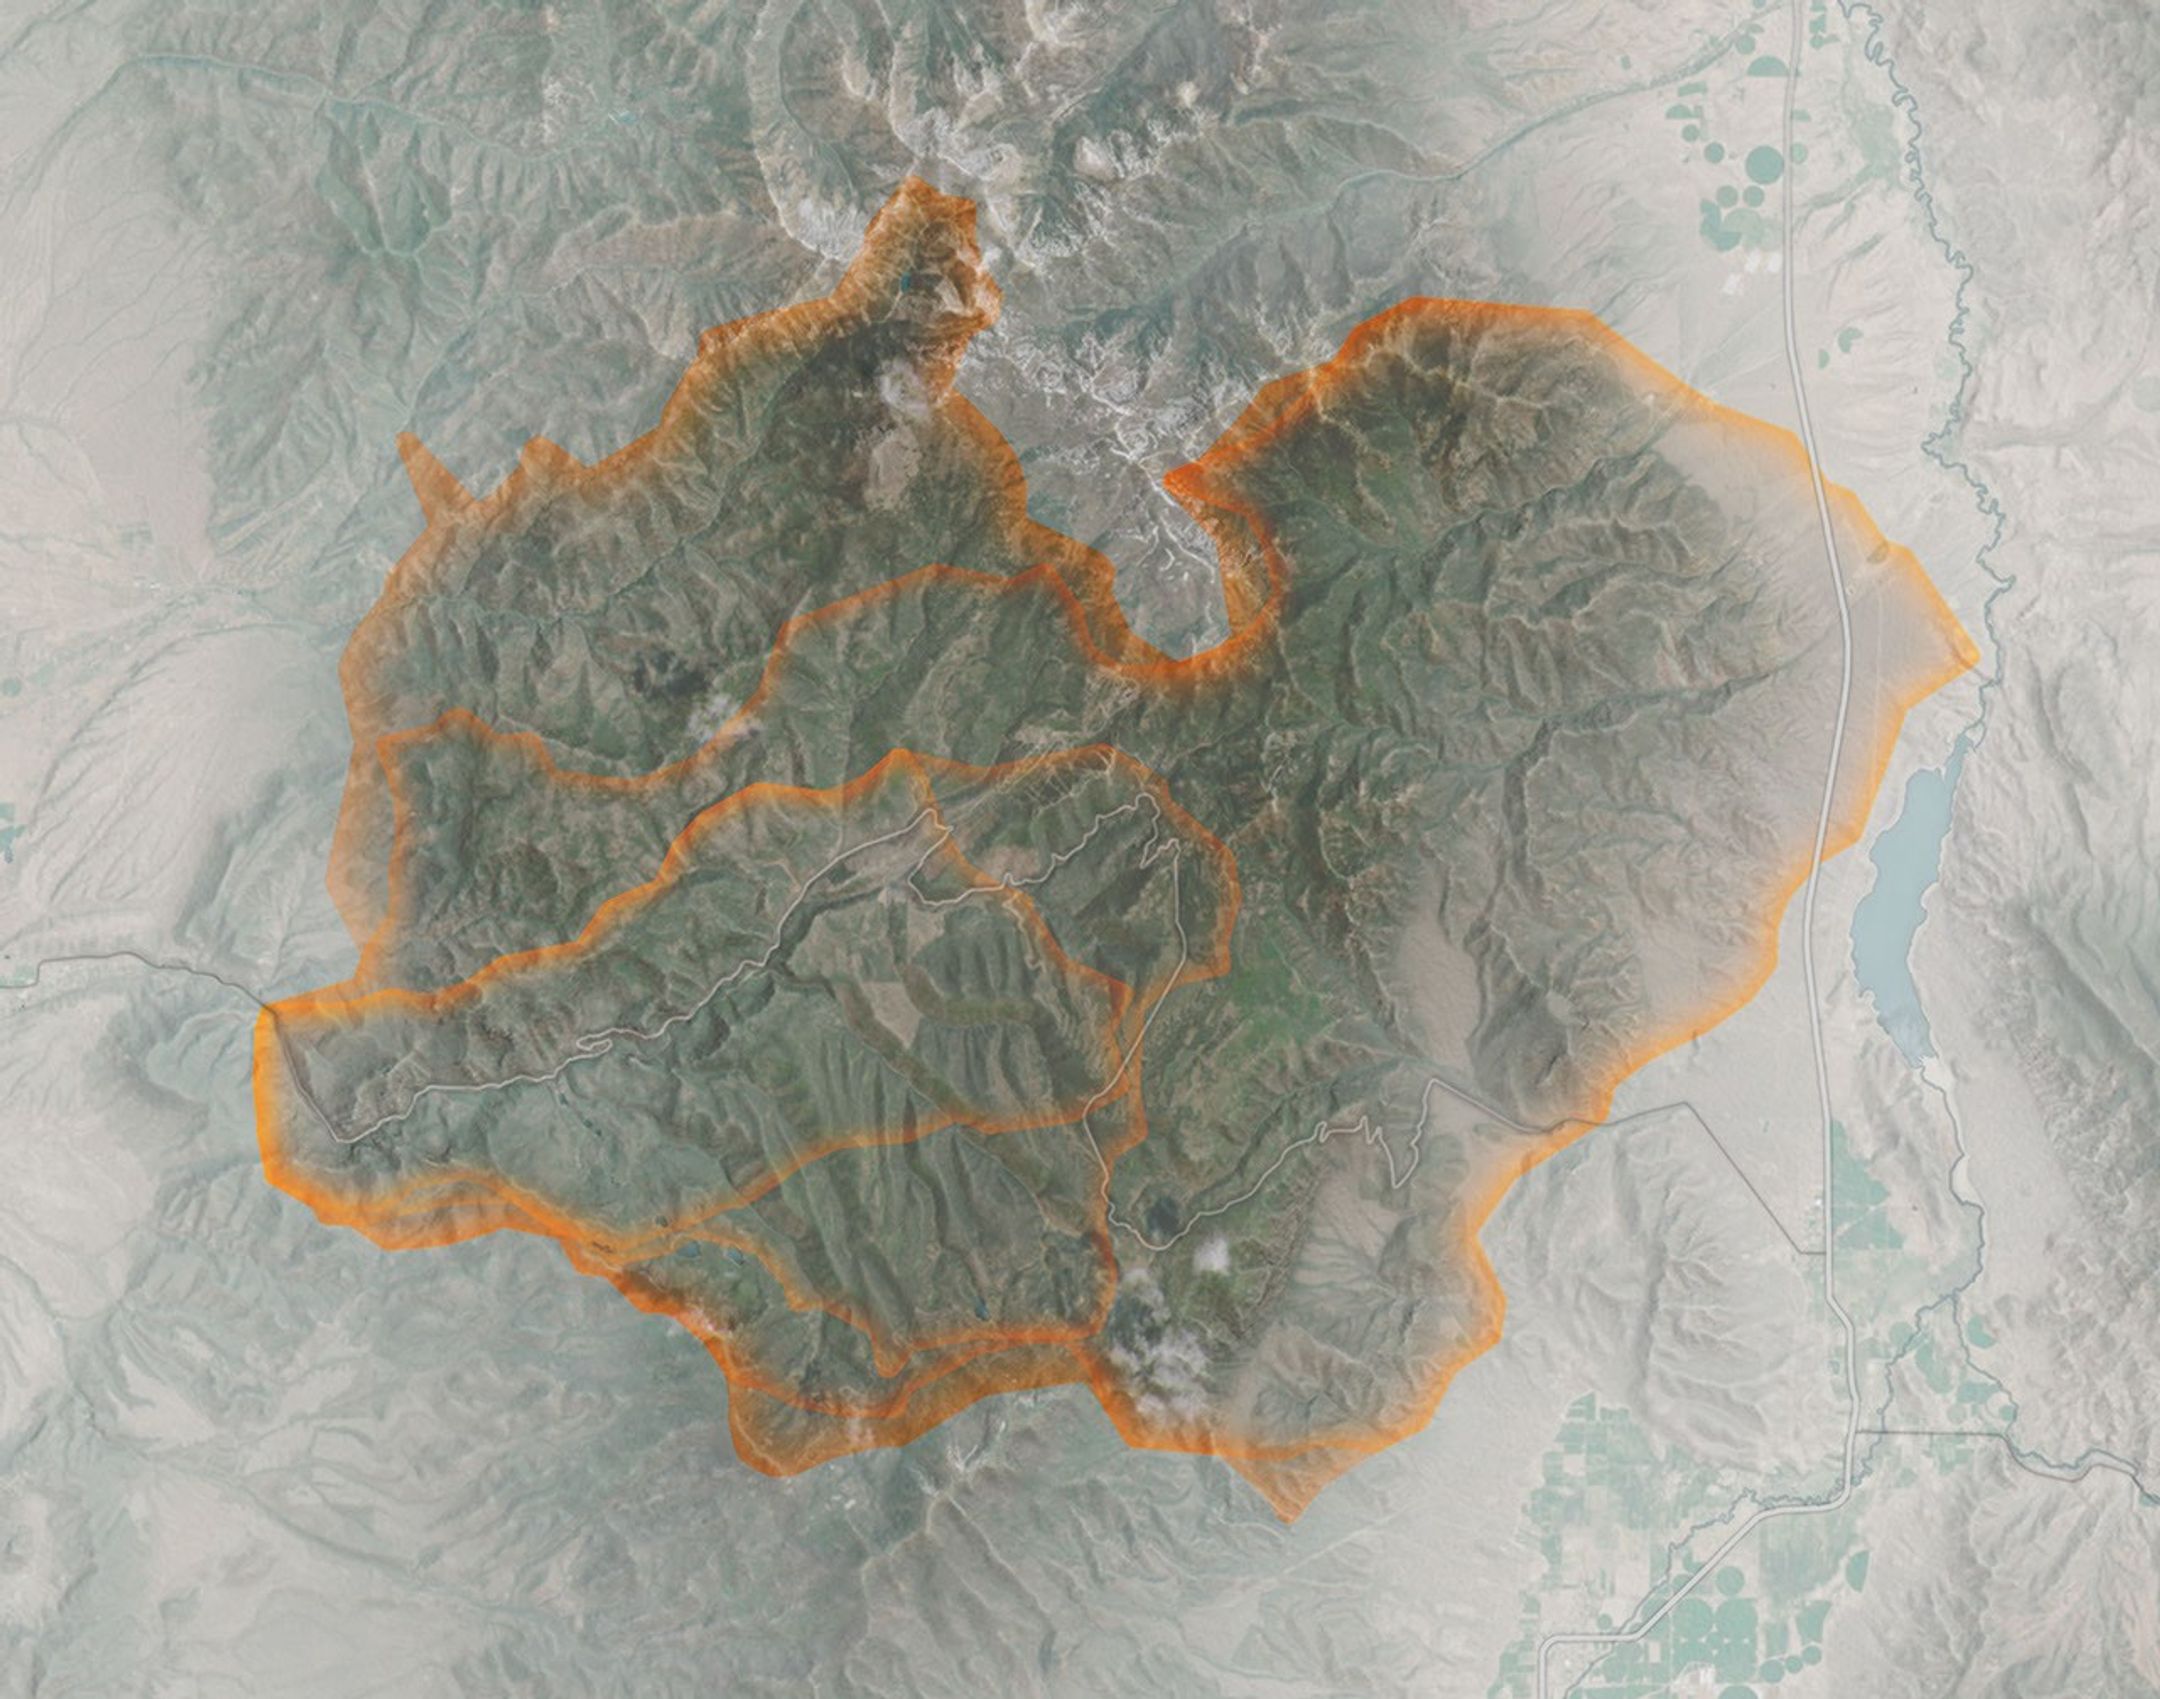
The fire spreads especially rapidly on June 23 and June 26. The fire perimeters in this visualization are based on data from NASA’s Fire Events Data Suite.
NASA Earth Observatory/Michala Garrison

As the fire spread, NASA’s Fire Events Data Suite (FEDS) tracked its progression and rate of growth. The visualization above, based on the FEDS system, shows the fire surging on June 23 and tripling in size over 12 hours that day as it spread to the north, east, and south. It also grew rapidly on June 26, when it made a run to the north. FEDS draws on data from the VIIRS (Visible Infrared Imaging Radiometer Suite) sensors aboard the Suomi NPP, NOAA-20, and NOAA-21 satellites, which detect active fires day and night by their thermal infrared signature.

FEDS is one of several tools available to firefighters and emergency management officials when responding to fires. First responders often rely on higher-resolution airborne imagers or on firefighters walking fire edges to map perimeters. FEDS offers a different advantage: consistent, easily accessible data that do not need to be specially requested, according to Tempest McCabe, a University of Maryland scientist based at NASA’s Goddard Space Flight Center who helped develop the tool. As a result, FEDS often detects a fire’s start earlier than other sources and tracks blazes for their full duration. To capitalize on strengths like these, the FEDS team is working closely with operational fire behavior analysts, with support from NASA’s FireSense program, to better understand and anticipate periods of rapid fire spread.

A total of 1,289 firefighters have been deployed to the Cottonwood fire, according to InciWeb, a website managed by the National Interagency Fire Center. As of July 7, the fire was 56 percent contained, but forecasters expect a hot, dry weather pattern to persist in the coming days, with fire behavior likely to be “very active to extreme” over the next 72 hours.

Government satellite data are part of a global system of observations used to track fire behavior and analyze emerging trends. Among the real-time wildfire monitoring tools that NASA makes available are FIRMS (Fire Information for Resource Management System), the Worldview browser, and the Fire Event Explorer.

As of July 7, 2026, fires had burned 5,265 square miles (13,636 square kilometers) across the United States, according to the National Interagency Fire Center. That’s 46 percent more than the 10-year average (2016-2025) for that point in the season.

NASA Earth Observatory images by Michala Garrison, using Landsat data from the U.S. Geological Survey and fire perimeter data from the Fire Events Data Suite. Story by Adam Voiland.
References & Resources

You may also be interested in:

Stay up-to-date with the latest content from NASA as we explore the universe and discover more about our home planet.
Fires Tear Through Nebraska Grasslands
3 min read

Dry, warm, and windy conditions across the U.S. Great Plains led to extreme fire activity in March 2026.
Article
Fire’s Footprint on Santa Rosa Island
3 min read

A wildland fire charred grassland, coastal sage scrub, and chaparral across one-third of the island, the second largest of the…

Article
Smoke Rises Over Big Cypress National Preserve
2 min read

The National fire has burned tens of thousands of acres within the Florida preserve, fueled by vegetation dried by prolonged…

Article

The post Cottonwood Fire Chars Utah appeared first on NASA Science.

Coins!

Jul. 7th, 2026 09:19 pm
billroper: (Default)
[personal profile] billroper
I ordered an uncirculated set from the mint (and paid a really extortionate price for it), because I wanted the 250th anniversary special designs. They are really nice. The standout piece, which I wish was on a denomination that circulated more, is the half-dollar. The Statue of Liberty motif is really well executed and it is one of the prettiest coins that the mint has put out in years.

The World Cup From 250 Miles Up

Jul. 7th, 2026 04:00 am
[syndicated profile] earthobservatory_iod_feed

Posted by Lauren Dauphin

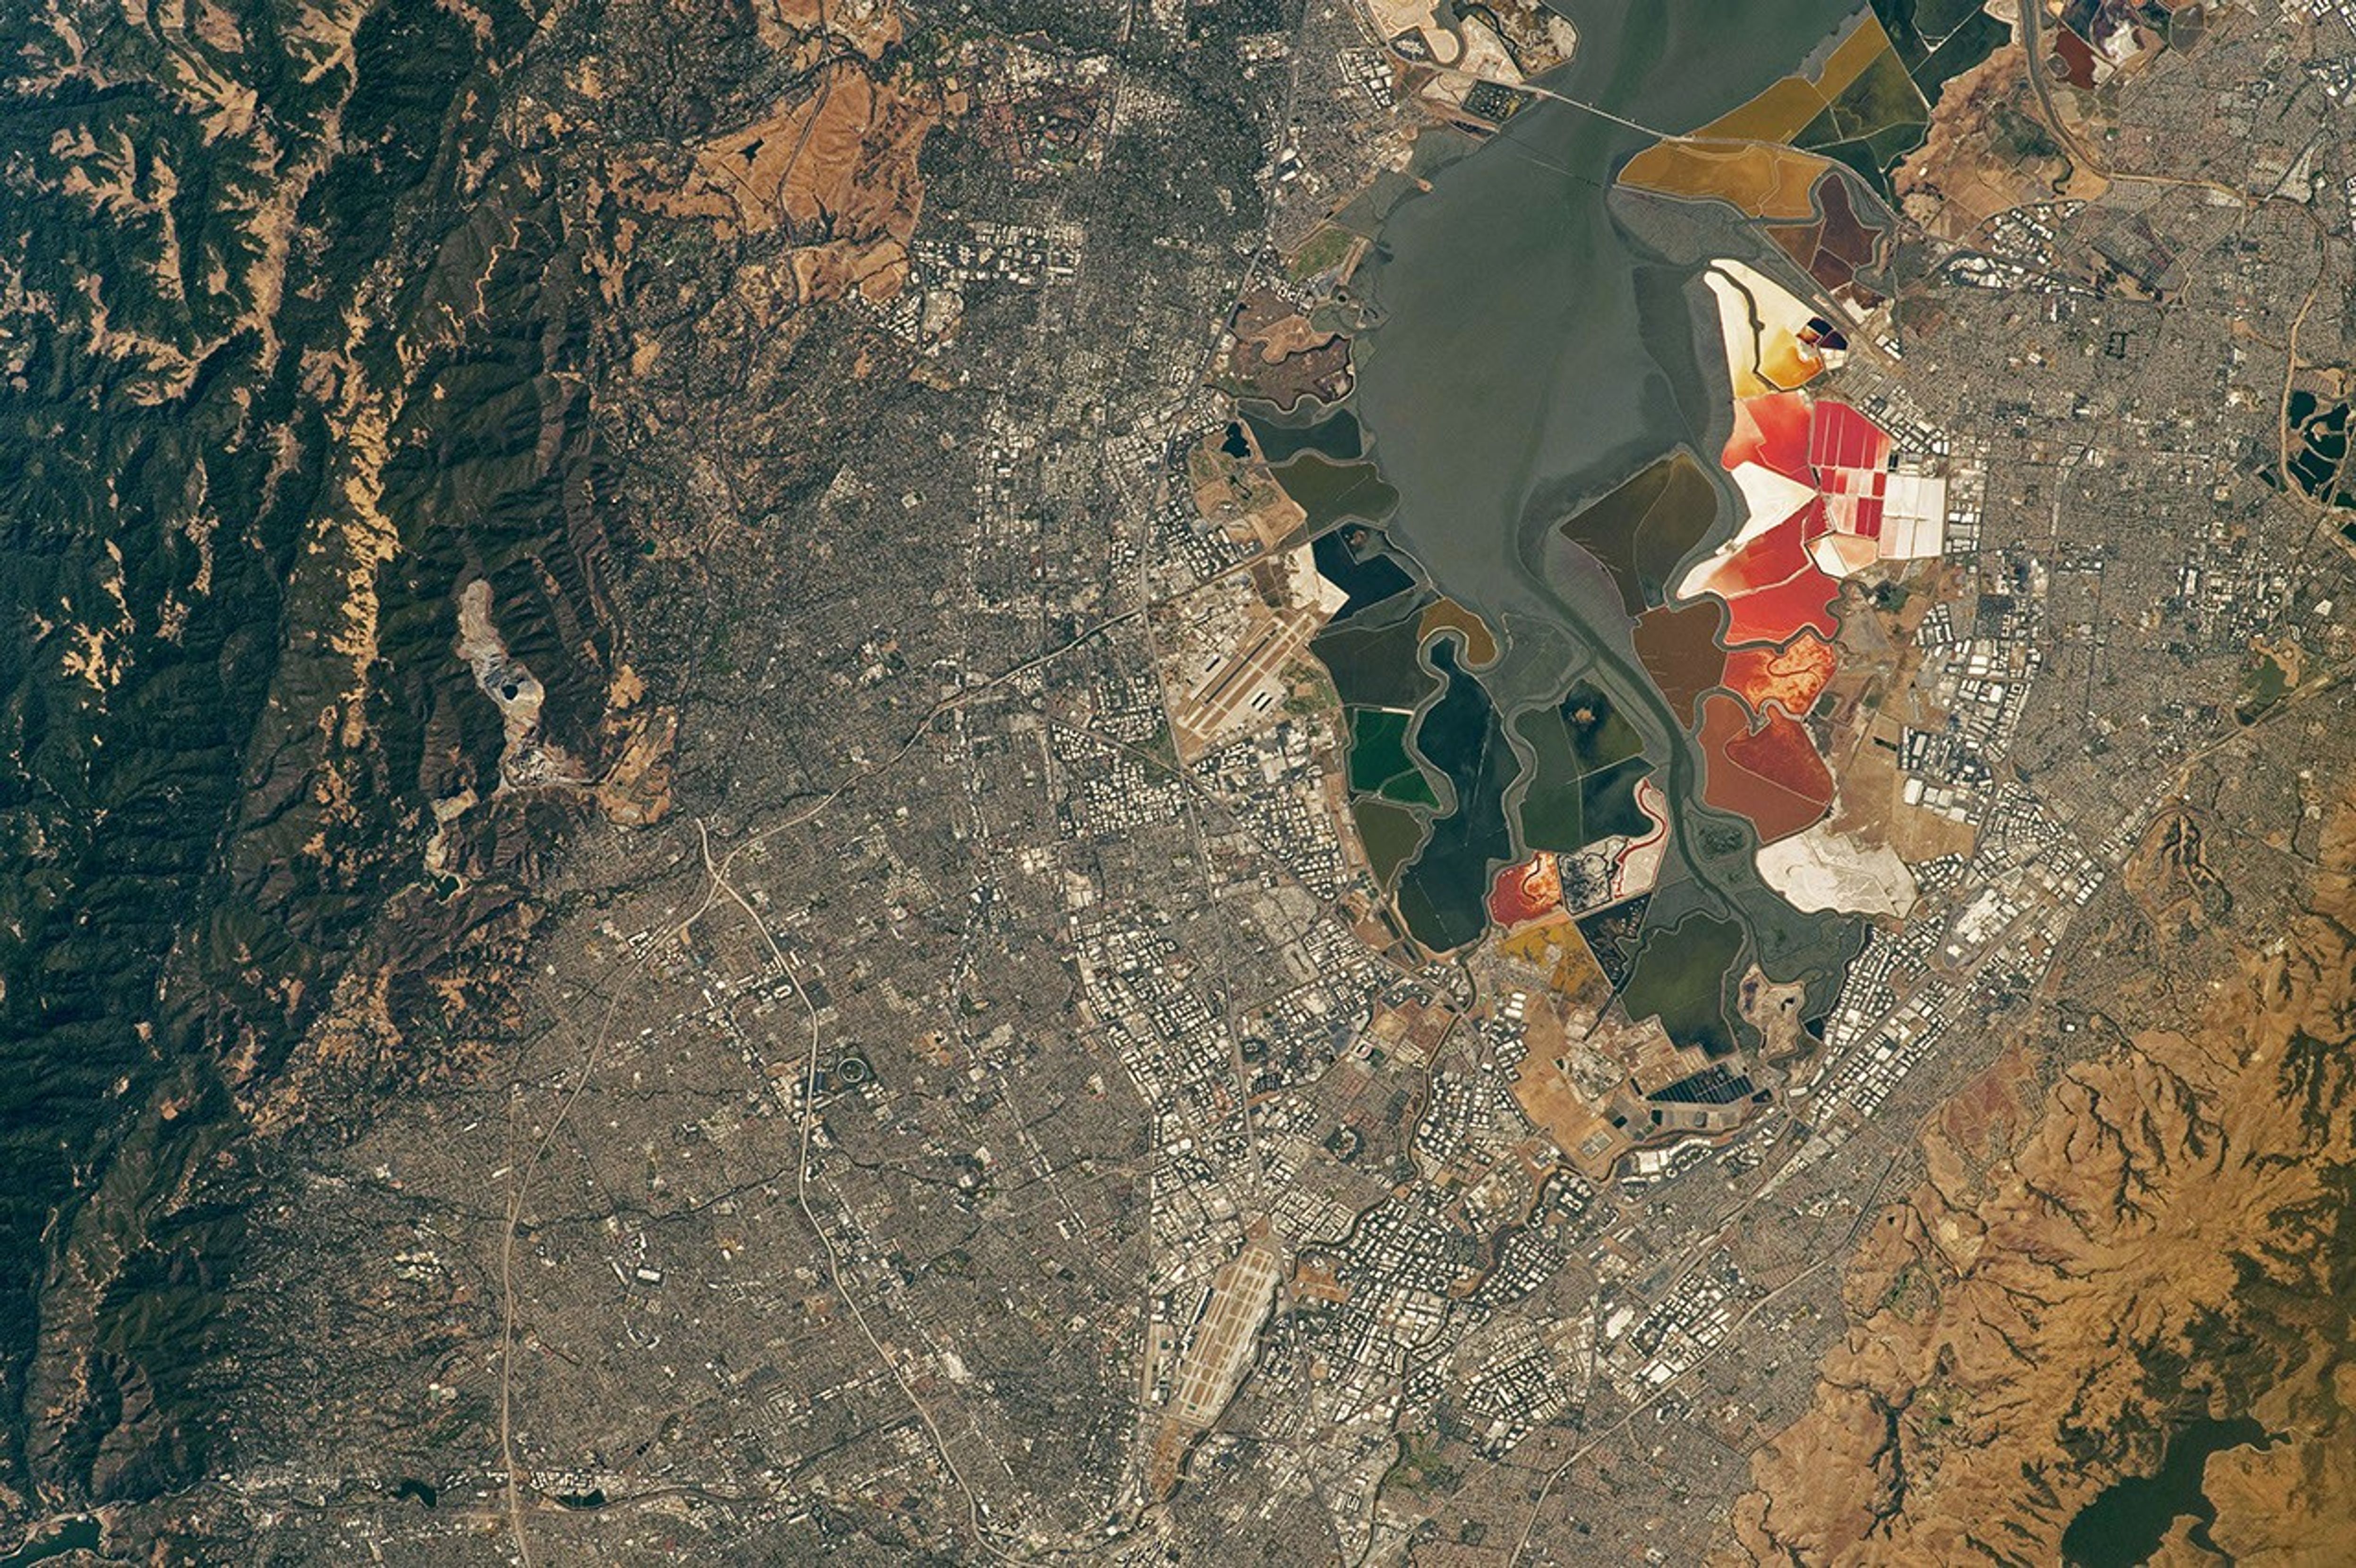
An aerial view of the San Francisco Bay Area Stadium, middle-left, is surrounded by urban infrastructure. Colorful ponds of the southern San Francisco Bay are visible toward the top.
July 26, 2022

In summer 2026, sixteen stadiums across North America hosted matches as part of the FIFA World Cup. Over the years, astronauts aboard the International Space Station have captured a top-down view of the infrastructure, landscapes, and ecosystems surrounding many of these venues.  

Six of the matches were played at the San Francisco Bay Area Stadium, beginning on June 13 with a match-up between Qatar and Switzerland. This stadium (also called Levi’s Stadium) is located in Santa Clara, California, adjacent to San Jose and around 40 miles (64 kilometers) south of San Francisco. An astronaut aboard the International Space Station took this photo (above) on July 26, 2022.

The stadium, completed in 2014, is surrounded by a mix of recreational, housing, and business infrastructure. The scene includes the southern part of San Francisco Bay, which is 23 years into a 50-year effort to restore up to 90 percent of the region’s salt ponds to tidal wetlands and marshlands, while retaining some of its salt-making heritage.

The Bay Area hosted its sixth and final World Cup match on July 1, when the U.S. faced off against Bosnia and Herzegovina in a knockout match. The U.S. advanced to the round of 16 following a 2-0 win.

An aerial view of the San Francisco Bay Area Stadium, middle-left, is surrounded by urban infrastructure. Colorful ponds of the southern San Francisco Bay are visible toward the top.
April 17, 2022

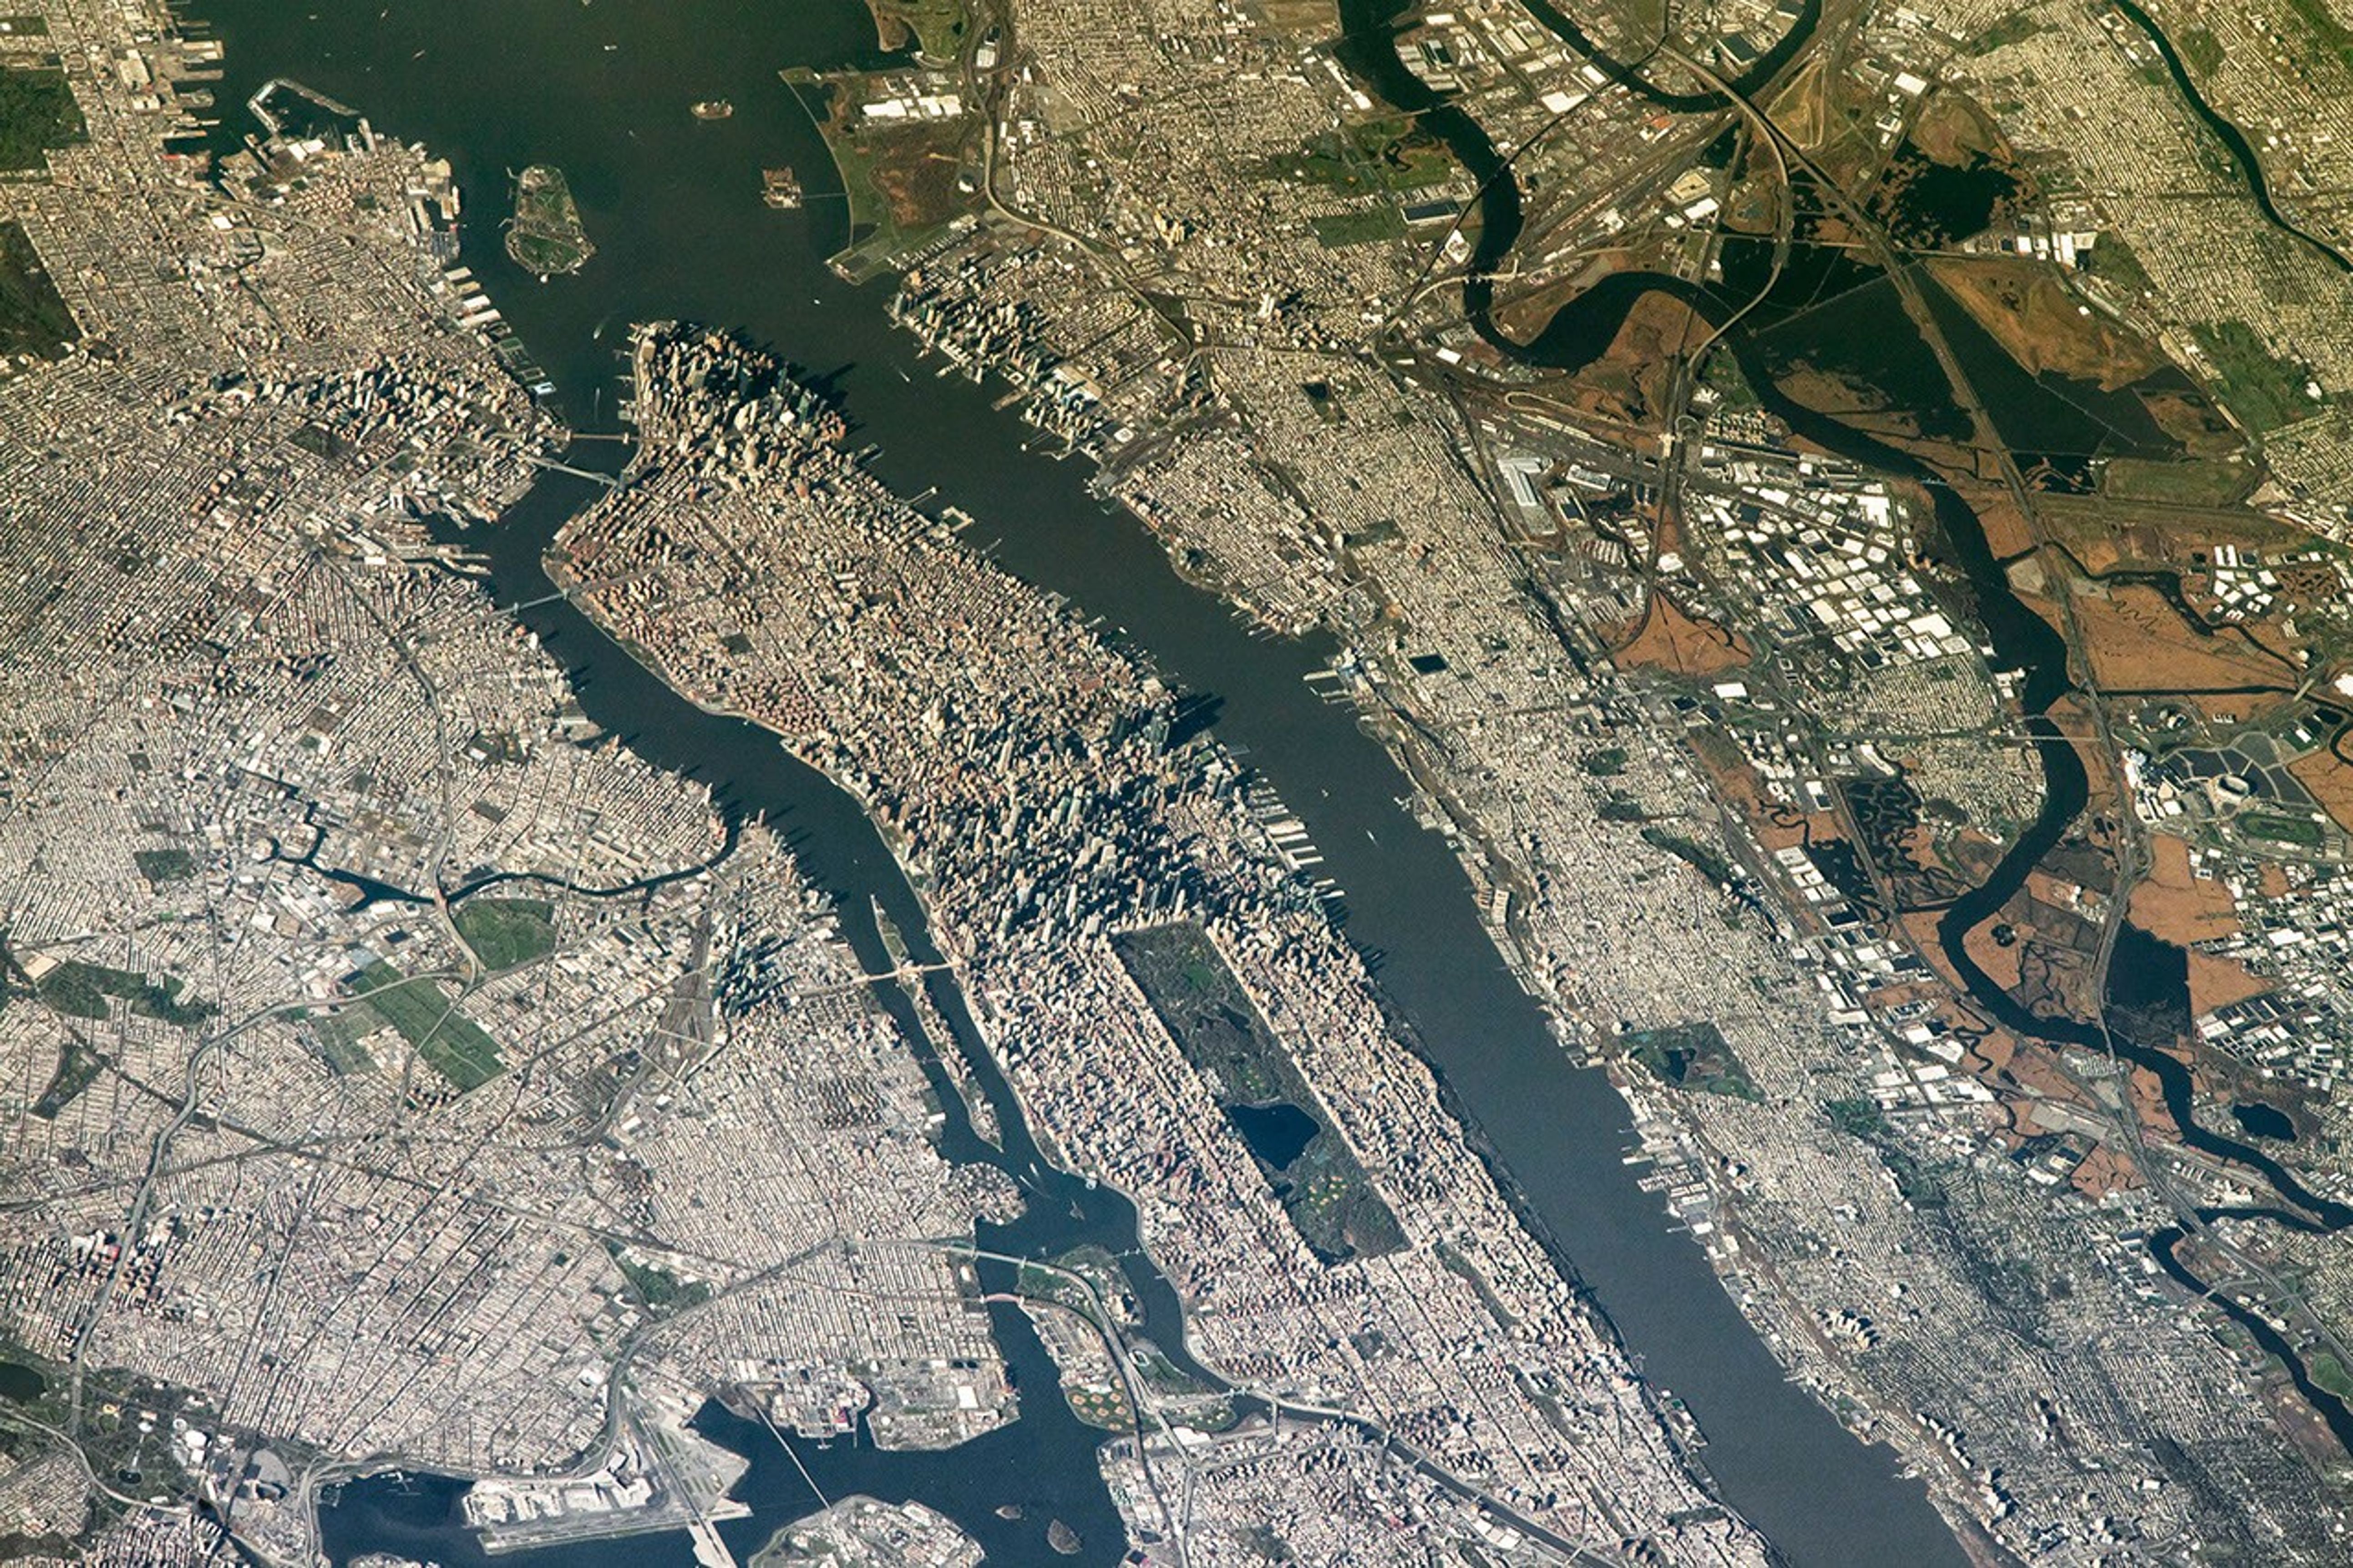
The FIFA World Cup final is scheduled for July 19 at New York New Jersey Stadium, part of the Meadowlands Sports Complex, in East Rutherford, New Jersey. The stadium (also called MetLife Stadium) sits along the New Jersey Turnpike, west of Midtown Manhattan. Note that north is toward the bottom-right of this photo, captured by an astronaut on April 17, 2022.

The area has seen centuries of human impact. Colonists cleared wetlands and cedar forest for settlements, and development for a range of economic and industrial uses followed. In the 20th century, it became an unregulated dumping ground. In recent decades, though, wetland restoration efforts have occurred alongside the development of the sports and entertainment complex.

Other World Cup host cities have also appeared in astronaut photography and satellite imagery. Guadalajara Stadium (Estadio Akron), Los Angeles Stadium (SoFi Stadium), Houston Stadium (NRG Stadium/Reliant Stadium), and BC Place Vancouver (BC Place) are among the venues that have been observed from above.

Astronaut photograph ISS067-E-202213 was acquired on July 26, 2022, with a Nikon D5 digital camera using a focal length of 400 millimeters, and astronaut photograph ISS067-E-18580 was acquired on April 17, 2022, with a Nikon D5 digital camera using a focal length of 1150 millimeters. They are provided by the ISS Crew Earth Observations Facility and the Earth Science and Remote Sensing Unit at NASA Johnson Space Center. The images were taken by a member of the Expedition 67 crew. The images have been cropped and enhanced to improve contrast, and lens artifacts have been removed. The International Space Station Program supports the laboratory as part of the ISS National Lab to help astronauts take pictures of Earth that will be of the greatest value to scientists and the public, and to make those images freely available on the Internet. Additional images taken by astronauts and cosmonauts can be viewed at the NASA/JSC Gateway to Astronaut Photography of Earth. Story by Kathryn Hansen.

References & Resources

You may also be interested in:

Stay up-to-date with the latest content from NASA as we explore the universe and discover more about our home planet.

Great Balls of Fire
4 min read

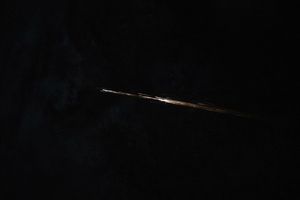
An astronaut on the International Space Station was surprised to photograph a shower of light streaking through the darkness while…

Article
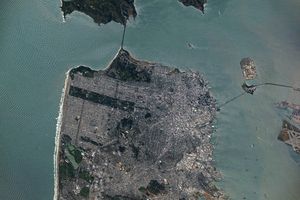
San Francisco’s Metropolitan Mosaic
3 min read

Urban development, green spaces, and maritime activity converge in this Northern California city.

Article
A Moonlit Earth as Seen From Artemis II
4 min read

An astronaut’s photo, taken en route to the Moon, reveals our planet and its place in space in a novel…

Article

The post The World Cup From 250 Miles Up appeared first on NASA Science.
Tell Me True

Jul. 6th, 2026 06:23 pm
billroper: (Default)
[personal profile] billroper
I heard about the FAWM sprint (5 songs in 9 days) from Jen when she passed through here around Filkconbobulated and figured that I could probably handle this (maybe) being retired now (pretty definitely). Of course, it started on July 4th and I was busy then and yesterday, so it is now 5 songs in *7* days which is moving up the challenging list and which meant that I should get started.

Happily, I have a lot of song cues lying around here...

I haven't figured out how to upload stuff to FAWM yet (and have cleverly asked for help), but I *have* now finished one song. Four to go!

I hope you like it.
Lyrics inside... )

Examining Algal Blooms in Blue Mesa

Jul. 6th, 2026 04:01 am
[syndicated profile] earthobservatory_iod_feed

Posted by Lauren Dauphin

November 15, 2017
November 17, 2021
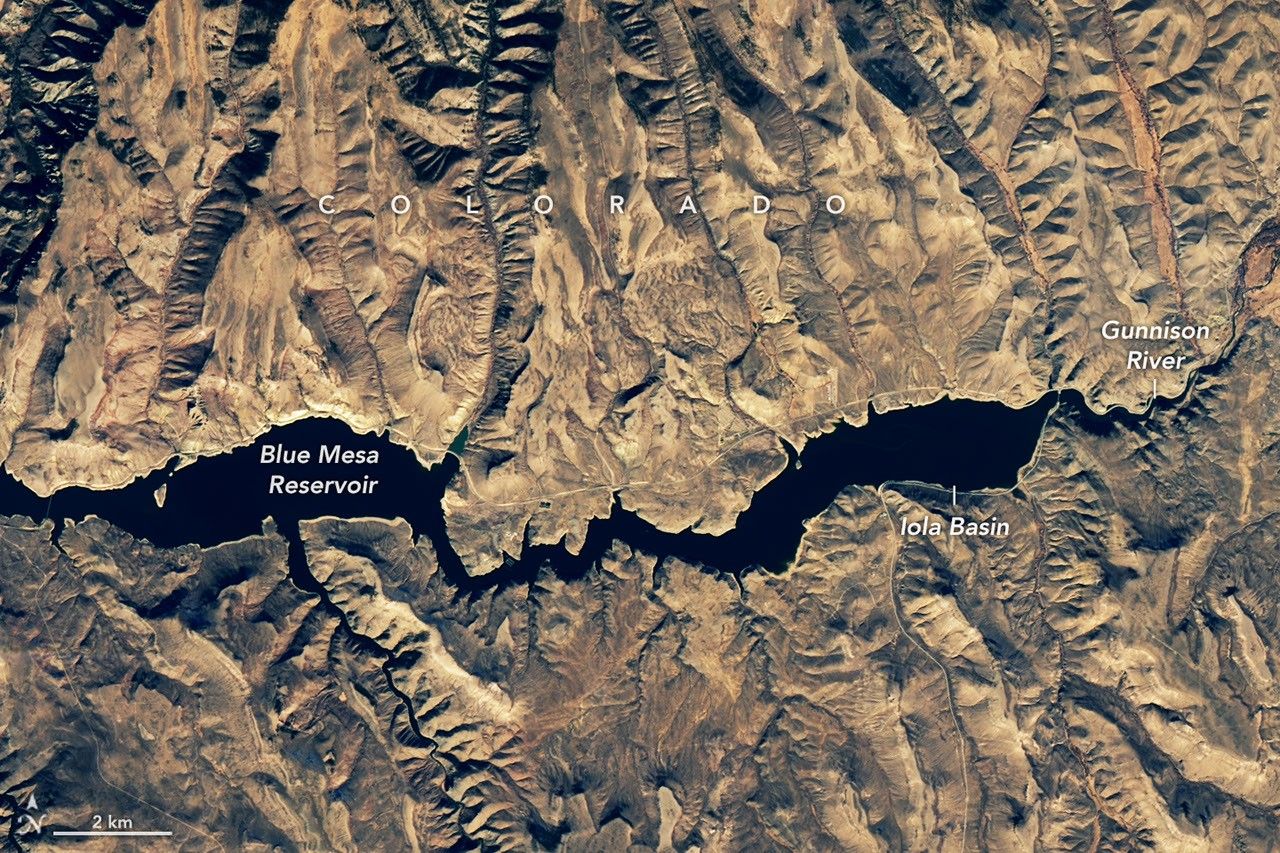
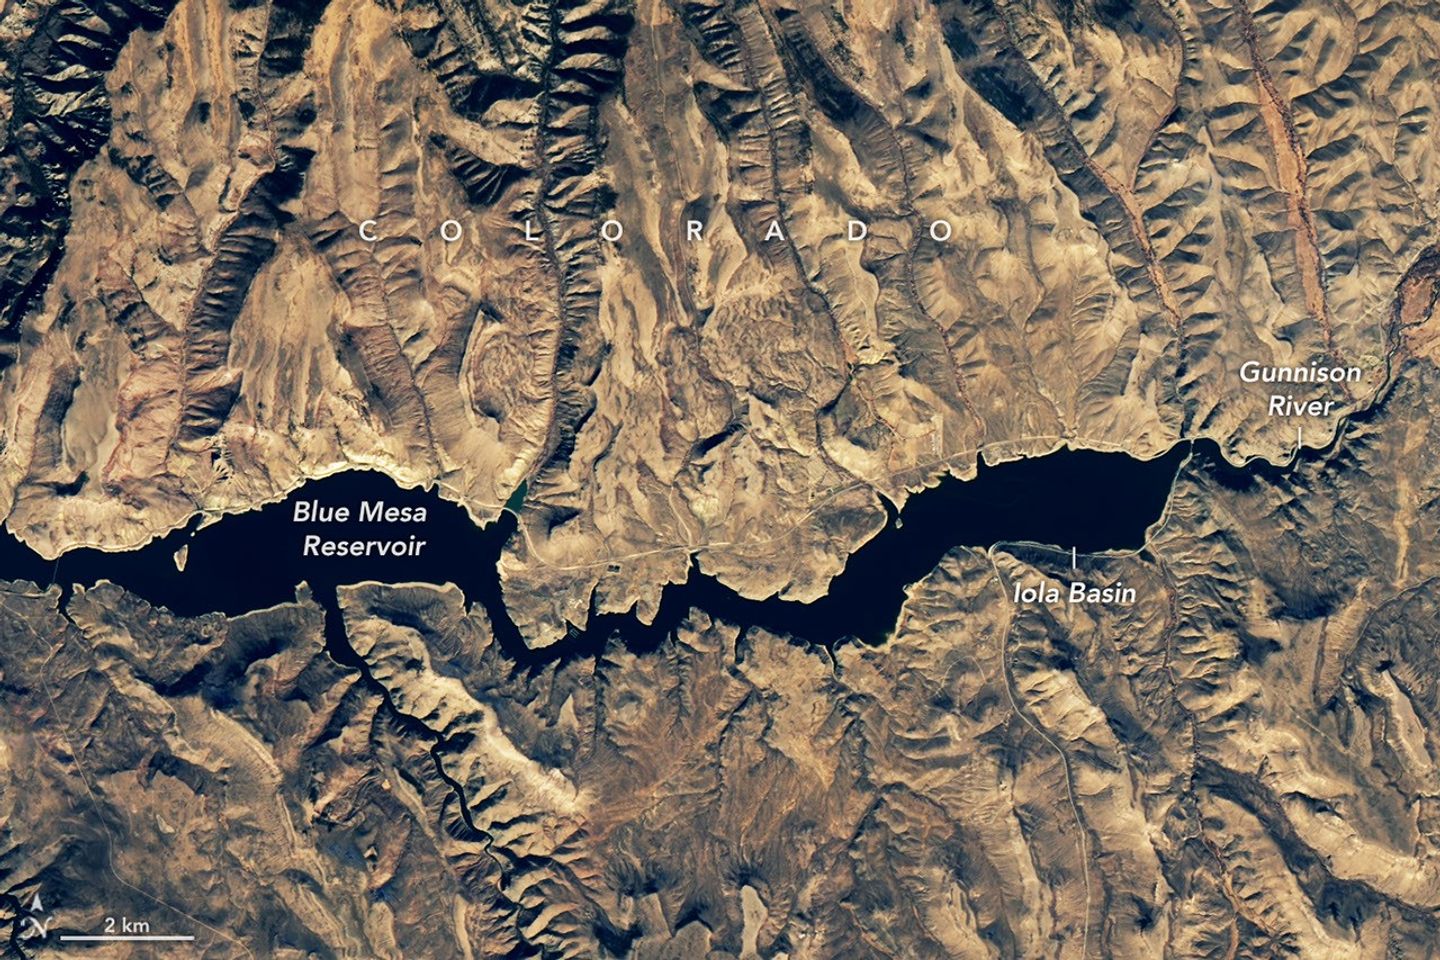
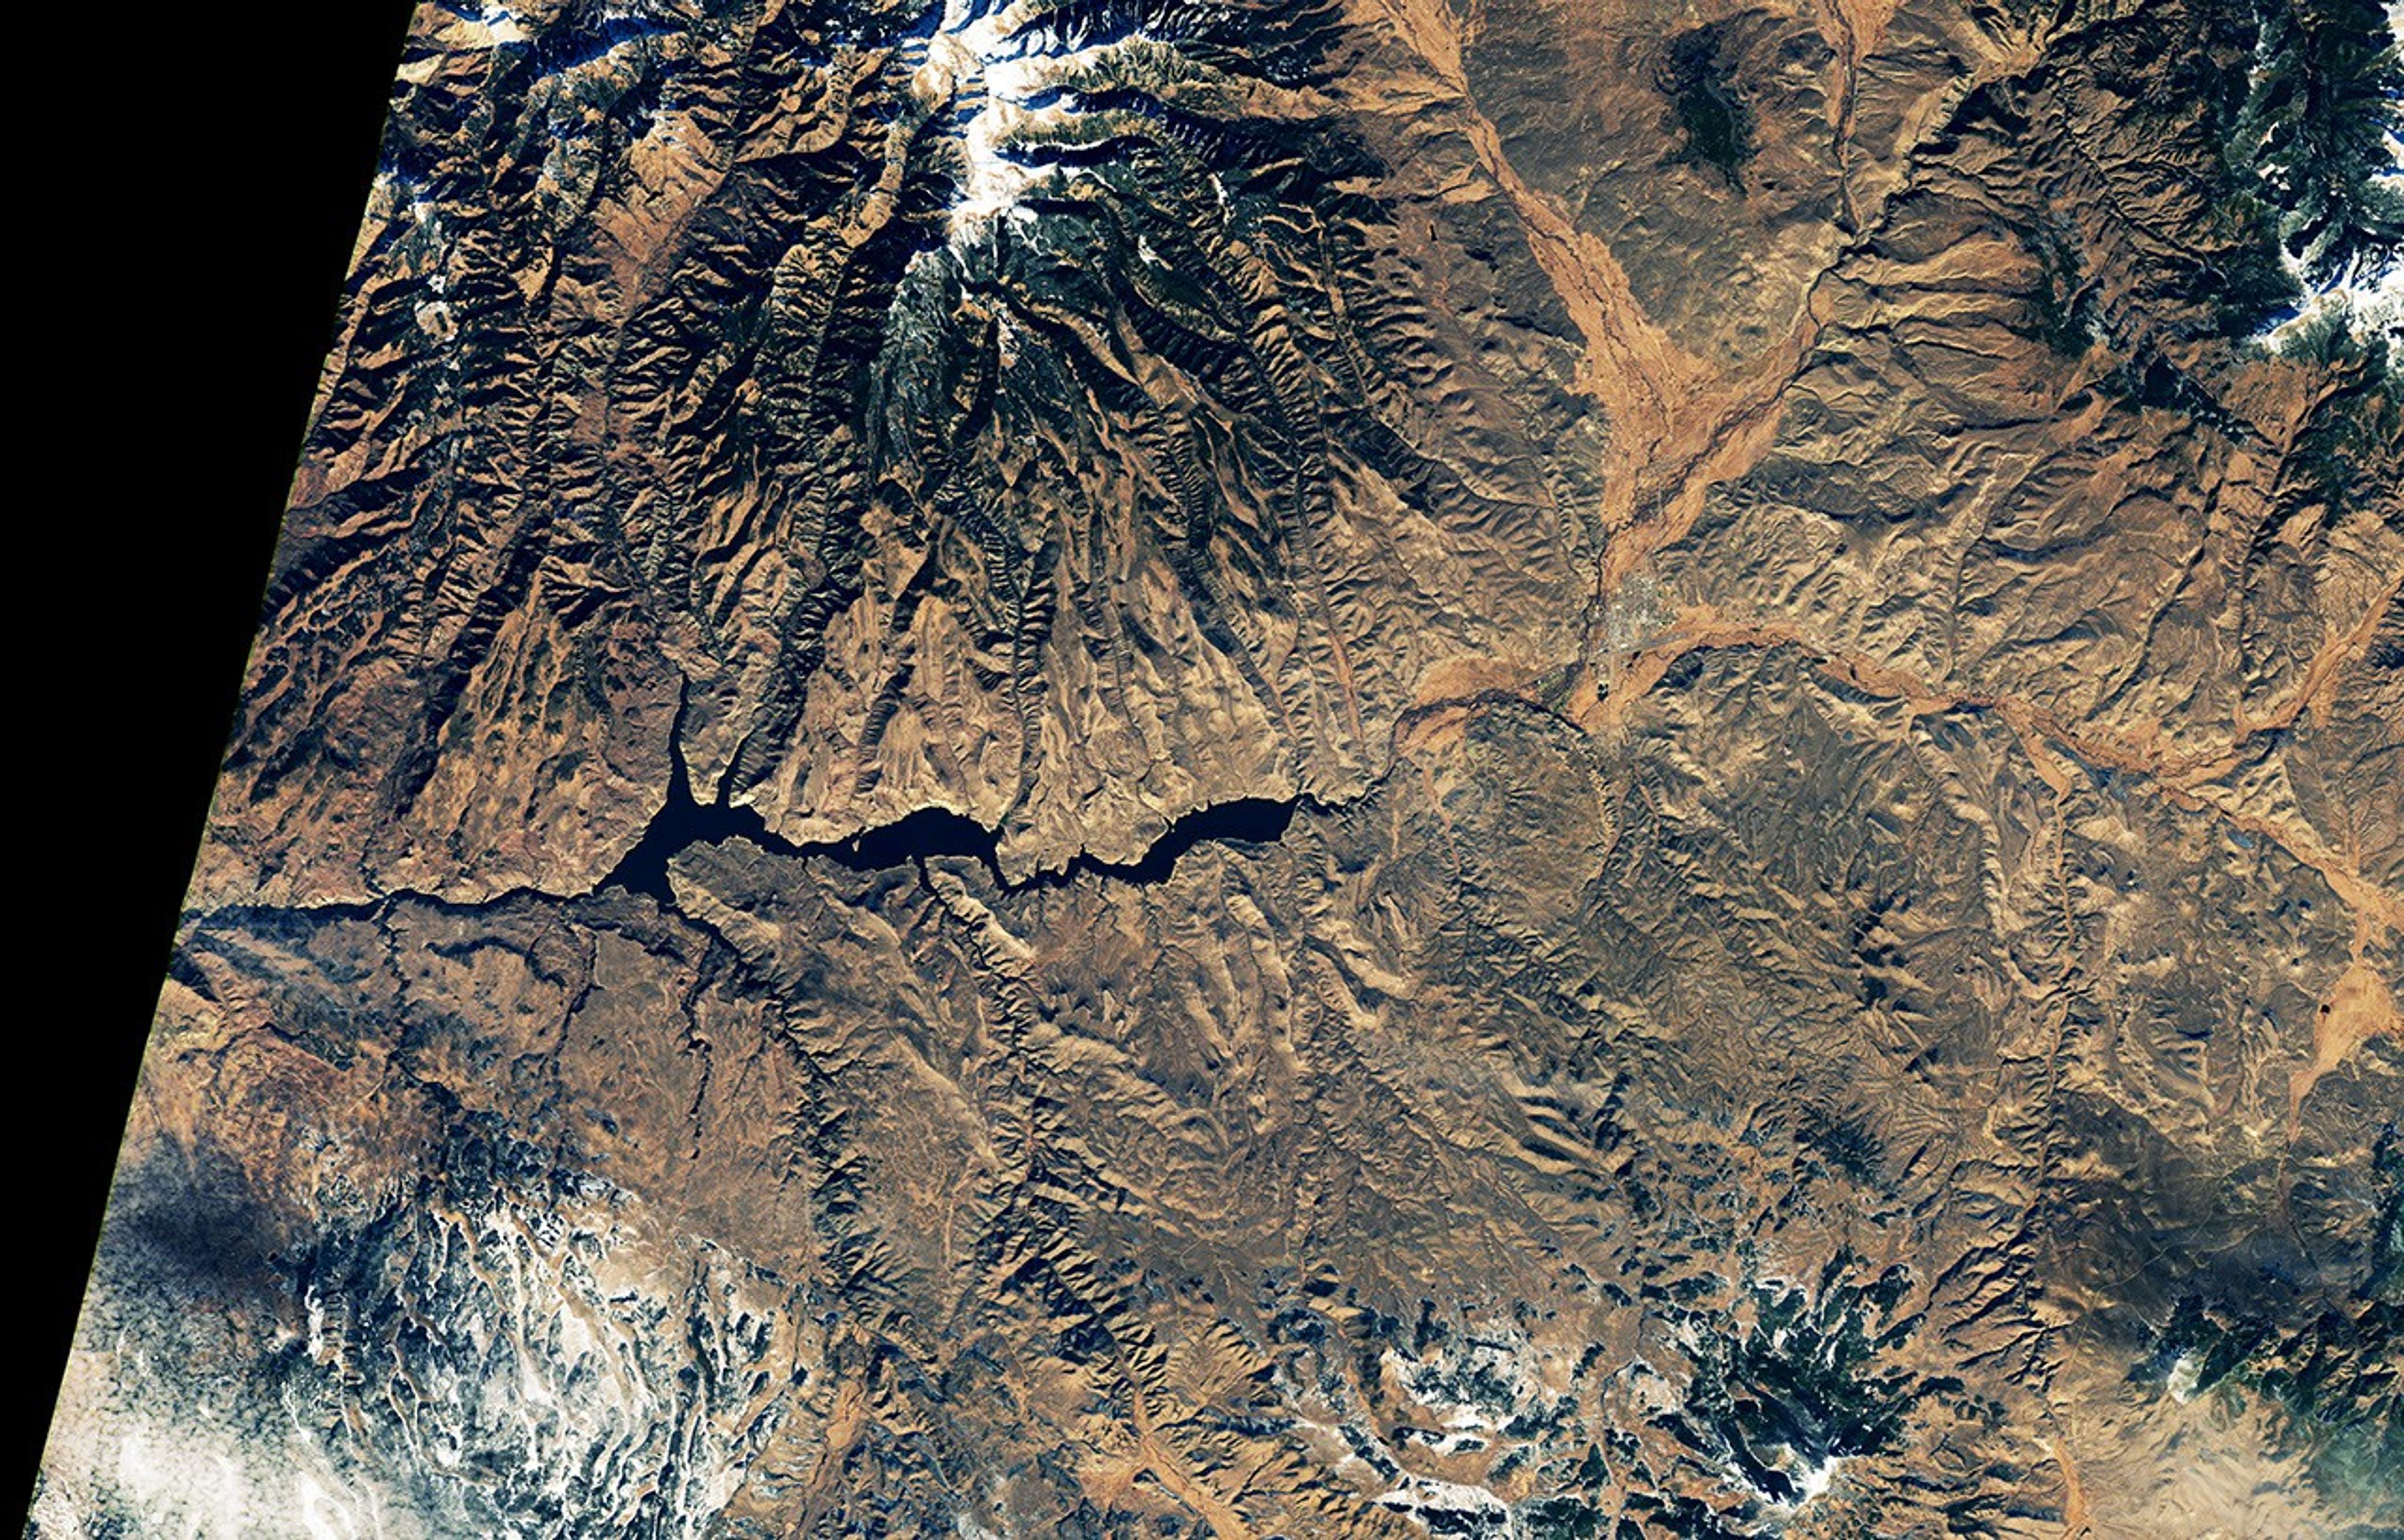
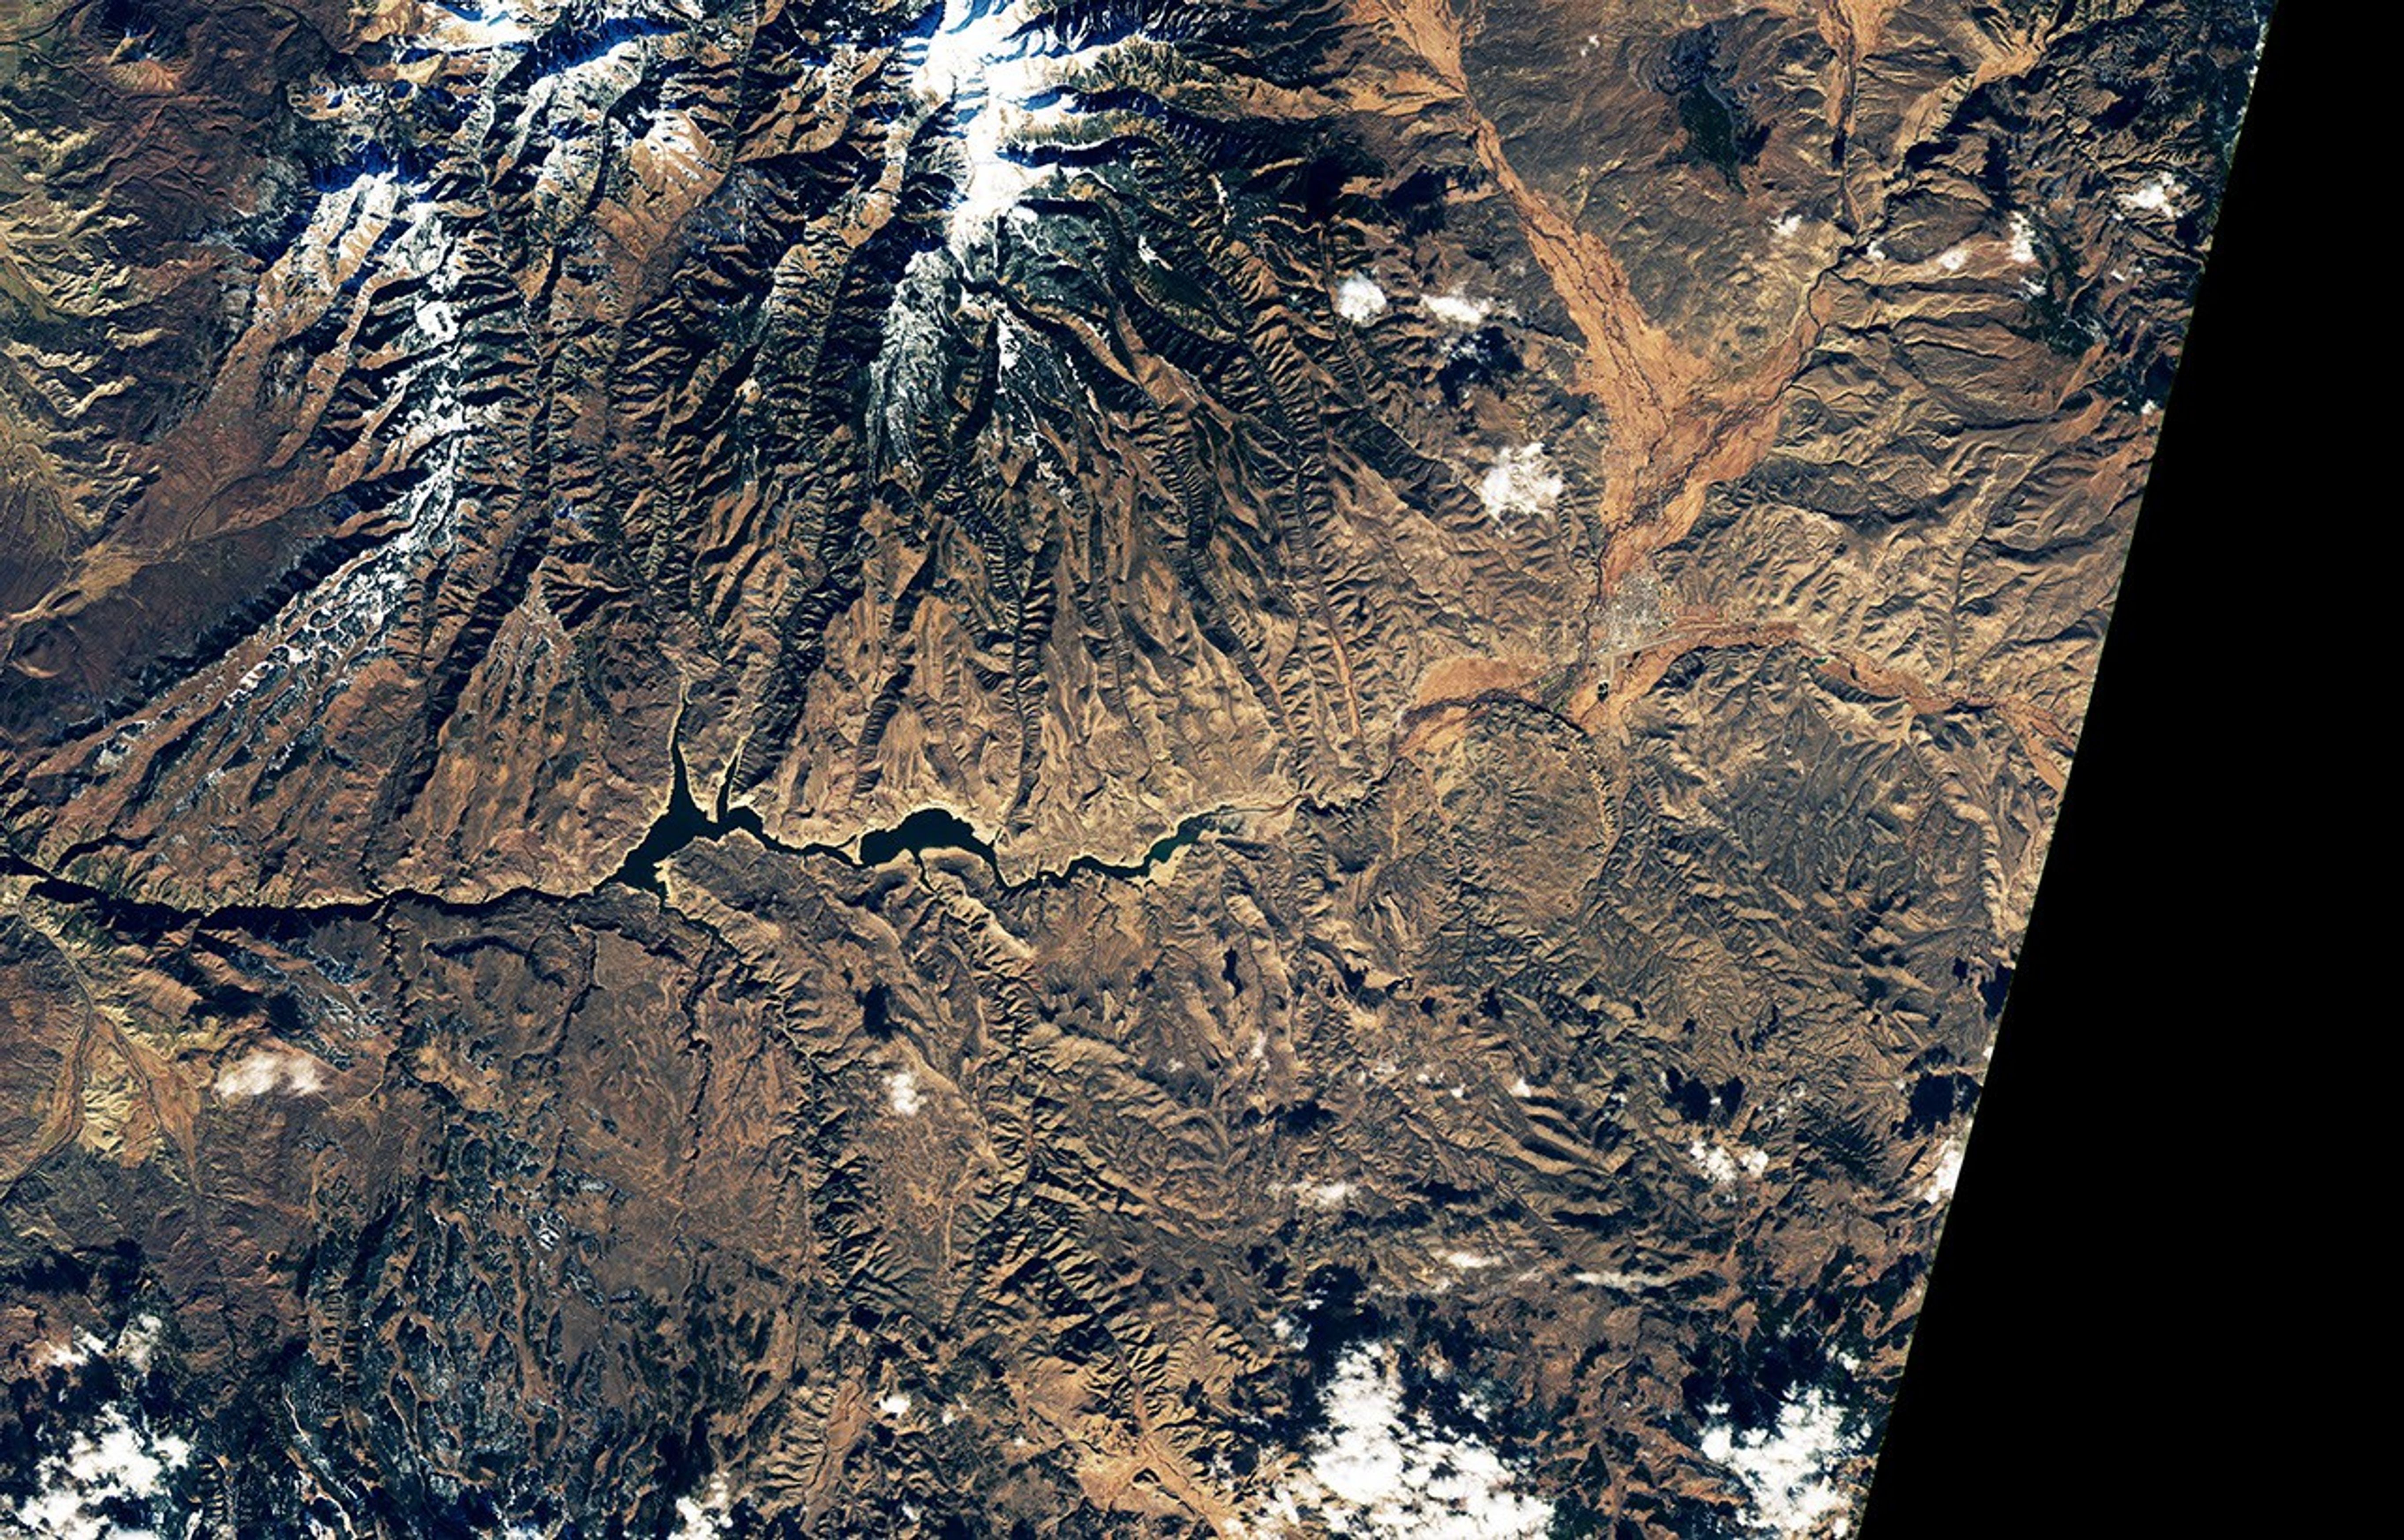
The first of a pair of satellite images shows the reservoir in November 2017, when water levels were relatively high and its color was mostly blue.
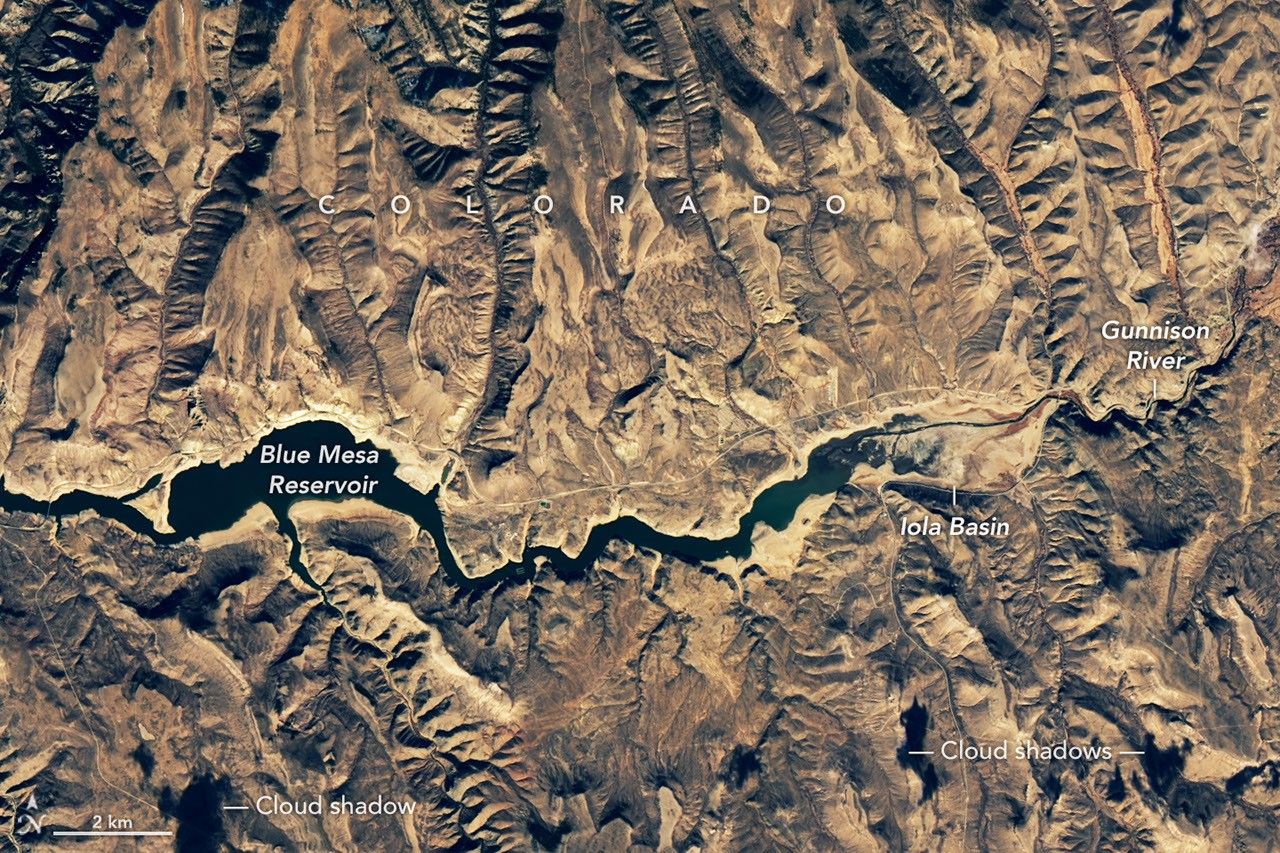
Cyanobacteria blooms turned Blue Mesa Reservoir green from September through November 2021, when water levels were among the lowest on record. The OLI (Operational Land Imager) on Landsat 8 captured this image (right) of a bloom on November 17, 2021, when the water was near its lowest level; the left image shows the same area on November 15, 2017, when water levels were closer to normal.
NASA Earth Observatory / Lauren Dauphin
The second image in the pair shows the same part of the reservoir in November 2021, when water levels were much lower and its color was much greener.
Cyanobacteria blooms turned Blue Mesa Reservoir green from September through November 2021, when water levels were among the lowest on record. The OLI (Operational Land Imager) on Landsat 8 captured this image (right) of a bloom on November 17, 2021, when the water was near its lowest level; the left image shows the same area on November 15, 2017, when water levels were closer to normal.
NASA Earth Observatory / Lauren Dauphin
The first of a pair of satellite images shows the reservoir in November 2017, when water levels were relatively high and its color was mostly blue.
Cyanobacteria blooms turned Blue Mesa Reservoir green from September through November 2021, when water levels were among the lowest on record. The OLI (Operational Land Imager) on Landsat 8 captured this image (right) of a bloom on November 17, 2021, when the water was near its lowest level; the left image shows the same area on November 15, 2017, when water levels were closer to normal.
NASA Earth Observatory / Lauren Dauphin
The second image in the pair shows the same part of the reservoir in November 2021, when water levels were much lower and its color was much greener.
Cyanobacteria blooms turned Blue Mesa Reservoir green from September through November 2021, when water levels were among the lowest on record. The OLI (Operational Land Imager) on Landsat 8 captured this image (right) of a bloom on November 17, 2021, when the water was near its lowest level; the left image shows the same area on November 15, 2017, when water levels were closer to normal.
NASA Earth Observatory / Lauren Dauphin
November 15, 2017
November 17, 2021
Cyanobacteria blooms turned Blue Mesa Reservoir green from September through November 2021, when water levels were among the lowest on record. The OLI (Operational Land Imager) on Landsat 8 captured this image (right) of a bloom on November 17, 2021, when the water was near its lowest level; the left image shows the same area on November 15, 2017, when water levels were closer to normal.

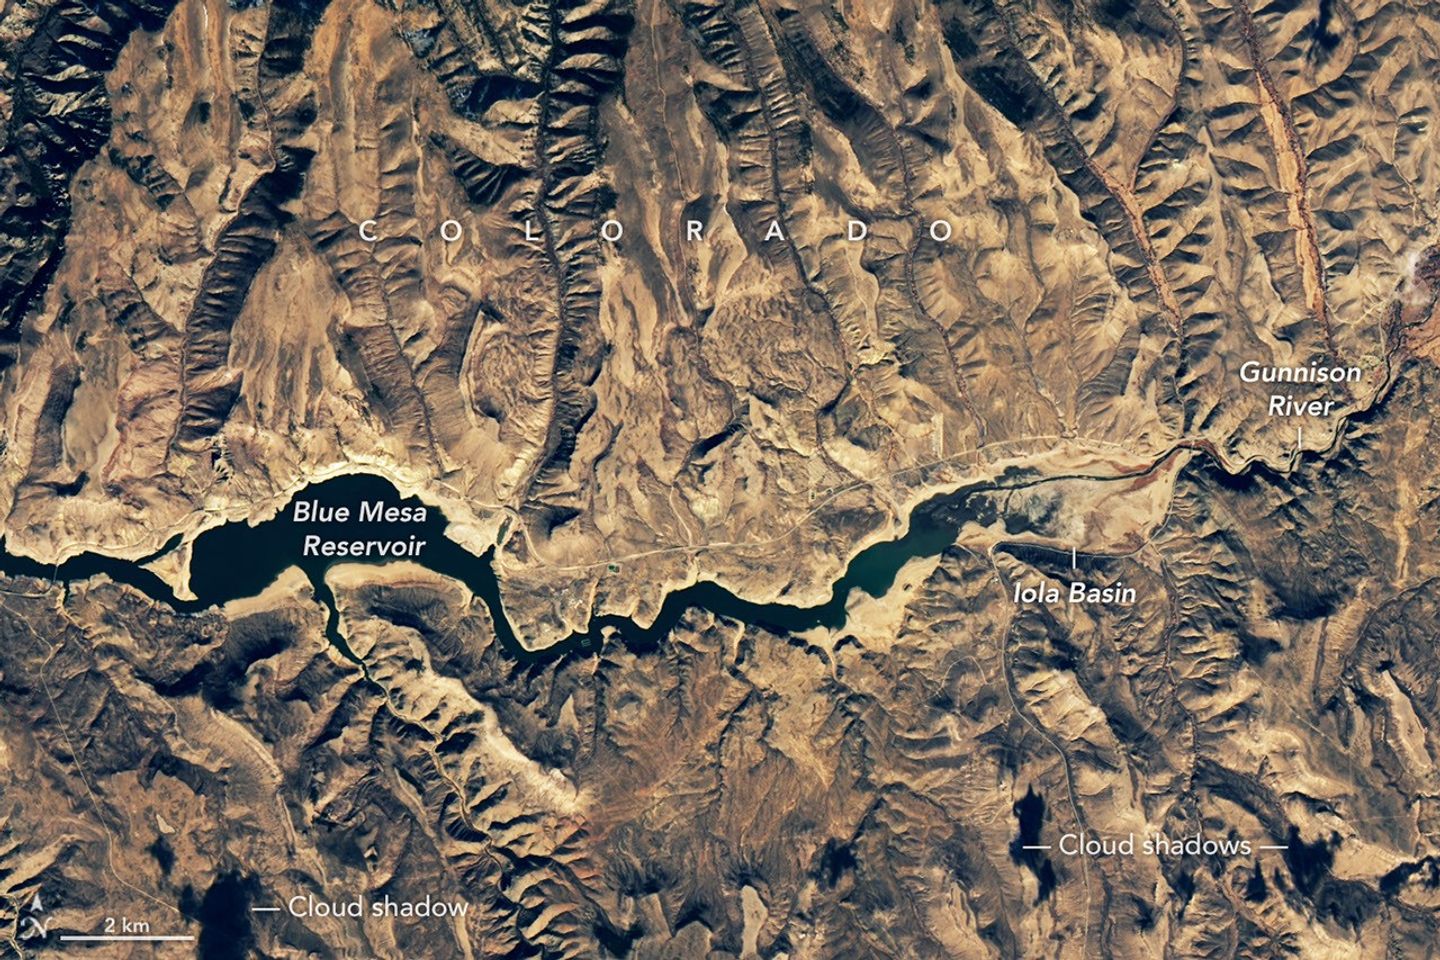
The summers of 2021 and 2022 were tough seasons for Colorado’s Blue Mesa Reservoir. A severe drought gripped much of the western U.S., prompting emergency water releases that brought the reservoir to its lowest level since 1984. Marinas and boat ramps closed, remnants of a ghost town emerged from the muck, and parts of the reservoir turned greenish and swirled with toxic cyanobacteria blooms.

Research conducted by scientists at the U.S. Geological Survey and the National Park Service analyzed decades of Blue Mesa Reservoir data and found a connection between low water levels, warm water temperatures, and harmful blooms.

“Algal blooms were more common when water levels were below 7,470 feet and water temperatures were above approximately 19.5 degrees Celsius (67.1 degrees Fahrenheit),” said Tyler King, a research hydrologist with U.S. Geological Survey. Water levels that low are relatively common and have occurred every few years in recent decades.  

While some cyanobacteria, also called blue-green algae, are always present in the reservoir in small numbers, problems occur when certain types proliferate. Aphanizomenon, Dolichospermum, and Woronichinia, for instance, thrive when the reservoir’s waters become warm and stagnant, releasing a toxin called microcystin that can cause skin and eye irritation, respiratory problems, and liver damage. Children and pets are particularly vulnerable to microcystin poisoning because of their size and tendency to ingest more water than adults.

King and colleagues analyzed in situ water samples and satellite observations from the European Space Agency’s Sentinel-2 mission and the NASA/U.S. Geological Survey Landsat satellites. A Sentinel-2 sensor that detects the light-harvesting pigment chlorophyll was particularly useful for mapping the blooms, while Landsat sensors were used to map water temperatures over time.

The National Park Service and U.S. Geological Survey launched the project in 2021 after anecdotal reports and water sampling suggested elevated cyanobacteria concentrations, King said. The scientists collected water samples but also turned to historical records and satellite data—”like a time machine,” he said—to examine conditions before regular water sampling had begun. Their analysis included satellite records of chlorophyll levels that extended back to 2016 and temperature records that reached back to 2000. The research team also studied in situ data on water levels dating to the 1970s.

A photograph taken from a rocky shoreline along the Iola Basin show mats of green growth coating the surface of the water.
A cyanobacteria bloom turned the water surface of Iola Basin green on September 8, 2021. Photo by Nicole Gibney/National Park Service.

The satellite data showed that blooms typically start in the eastern end of the reservoir, an area known as Iola Basin. The basin, where the Gunnison River flows into the reservoir, is the shallowest part of the reservoir. Occasionally, the satellite data showed, blooms spread westward into other parts of the reservoir, sometimes moving about two-thirds of the way across. However, concentrations of toxins rarely reached levels that posed health concerns beyond Iola Basin.

The same dynamics that caused challenges for Blue Mesa in 2021 and 2022 are present in 2026, said King. Drought again plagues much of the western U.S., the mountains hold little snow, and water levels in Blue Mesa are low. On June 27, 2026, the reservoir stored about 43 percent of the water it typically does on that date, the lowest value observed for that day in the past 30 years. Water levels are expected to continue dropping until October, according to U.S. Bureau of Reclamation projections

If cyanobacteria blooms emerge in 2026, the researchers expect that satellites will help scientists track them. The researchers use the U.S. Geological Survey’s WaterMAP (Water Monitoring Above the Planet) tool to monitor for potential bloom conditions within hours of satellite overpasses. NASA’s STREAM (Satellite-based Tool for Rapid Evaluation of Aquatic Environments) project also uses data from Landsat and Sentinel-2 to map potential blooms within hours of a satellite overpass, and the multi-agency CyAN (Cyanobacteria Assessment Network) project collects daily data from other satellites to map blooms in larger water bodies.

“It’s amazing that we can use satellites to map the impacts of microscopic organisms from almost 500 miles away,” King said. Yet it will still be crucial to get people out on the water taking samples and directly testing for toxins, he emphasized. “The satellites aren’t definitive,” he added. “They can tell us where there might be a problem, but toxins often aren’t present until the later stages of a bloom.”

A photograph shows two female researchers collecting green, algae-rich water in a cylindrical container.
Satellite observations can help managers decide where to send personnel to collect water samples for more detailed analysis of bloom toxicity. Photo by Katie Walton-Day/USGS.

NASA Earth Observatory images by Michala Garrison, using Landsat data from the U.S. Geological Survey. Photos by Katie Walton-Day (USGS) and Nicole Gibney (NPS). Story by Adam Voiland.

References & Resources

You may also be interested in:

Stay up-to-date with the latest content from NASA as we explore the universe and discover more about our home planet.

Low Water at San Carlos Reservoir
4 min read

Drought and water releases drained the Arizona reservoir to levels that have led to widespread fish deaths.

Article
Rising Waters Swamp Lake Naivasha
6 min read

Relentless rains are threatening a lake in Kenya’s Great Rift Valley that has become a key hub in the global…

Article
Snow Is Scarce in the Upper Colorado Basin
5 min read

The mountains of Utah and Colorado are among the areas of the western U.S. that are low on snow and…

Article

The post Examining Algal Blooms in Blue Mesa appeared first on NASA Science.
No Sweep For You!

Jul. 5th, 2026 10:10 pm
billroper: (Default)
[personal profile] billroper
Having caught parts of the previous two Cards victories over the Cubs on TV, I headed down to Wrigley Field for the finale. Consistent with my history in such things, the Cards lost in entertaining fashion.

The first Cubs hit of the game was the most amazing cue ball shot by Pete Crow-Armstrong that I have ever seen. It was a dribbler toward the third baseman, Fermin, that suddenly developed a crazy spin and went running off toward the middle of the infield. Not too long after that, the run scored along with a second run to give the Cubs a 2-0 lead. The Cards were lucky that it wasn't worse.

But the Cards got two runners on base in the top of the sixth, so the Cubs manager, Counsell, changed pitchers to face Jordan Walker and gain the platoon advantage. And Walker drilled a homer into the left field stands for a 3-2 Cards lead.

I had thought that Marmol might pull Liberatore after five innings, but his pitch count was relatively low, so he came back out for the bottom of the sixth and promptly put the first two runners on base. At this point, Liberatore was pulled, which was shortly thereafter followed by the collapse of the Cards' defense, resulting in three unearned runs and a 6-3 Cubs lead.

The Cards managed to score one more run to make it 6-4 for the final.

In any case, it was a nice day for a baseball game. :)

Done Since 2026-06-28

Jul. 5th, 2026 04:46 pm
mdlbear: blue fractal bear with text "since 2002" (Default)
[personal profile] mdlbear

A very mixed week. Wednesday, and to a lesser extent Thursday, spent the morning in an exceptionally good mood. "Cheerful." I even upper-cased it. Tuesday was my first real PT appointment, concentrating on my shoulders. It seemed to go well, but one of the exercises seems to have made things worse, not better. Paracetamol may be helping a little, but it's hard to say. The fact that my refill for Buspirone (for both anxiety and depression) got screwed up hasn't helped at. all.

My right shoulder has deteriorated to the point where I can't lift my arm high enough to play a full-sized guitar. Plink to the rescue. And my mood has deteriorated as well -- I understand that chronic pain will do that. It may also be behind my declining interest in cooking and trouble deciding what to eat for breakfast and lunch. (G usually makes dinner, saving me the trouble of havng to decide about it.)

A lot of my reading has gone over to dead trees lately. Not sure what to make of that. Seeing a review of Crossing the Wine-Dark Sea: Journeys Through Ancient Literature by Emily Wilson, and going from there to her translation of the Iliad, probably had a lot to do with it. There may be some reviews in our near future. But don't hold your breath -- I'm not a very reliable blogger these days.

Linkie: Keeping the Internet Human: 25 Years of Choosing to Share - Creative Commons It's too late for you to get in on the Goodreads ebook giveaway, but ebooks of The World As it Ought To Be, by Naomi Rivkis are still on sale for $2.99 until the end of this month.

Notes & links, as usual )

billroper: (Default)
[personal profile] billroper
After last night's thunderstorms and thunderstorms that rolled through the area earlier today, a lot of local fireworks displays were canceled -- except for the freelancers who have been firing things off for much of the evening.

We had originally planned to grill sausages with Jeff and Carol, who are in town for a visit. The weather made that look problematic, so we cooked them on the stove instead, which was *just* fine. A lot of good conversation was had.

After Jeff and Carol headed back to their hotel room, Gretchen said that she wanted to watch the taped "A Capitol Fourth", which seemed fair, but the Cardinals / Cubs game tonight was on Fox and had finally started after a one-hour rain delay. I got to my chair first and switched on the game before Gretchen got there. The game got to the end of the third inning and so did Gretchen, at which point I offered to put on "A Capitol Fourth". She initially declined, I argued, and we fired up the recording.

While that was going on, I was following the game on my phone and noticed that there was a new "weather delay". Huh? I checked and found that the game was being delayed by *fog*. That's pretty unusual, so I asked permission to interrupt the recording and go check out this mess, which Gretchen agreed was interesting.

After about 18 minutes, the game resumed, and Gretchen fell asleep. I took advantage of this to watch the rest of the game, after which we watched the remaining half-hour of "A Capitol Fourth", and all was right with the world.

Except the dogs *hate* the fireworks. Or else want to go out and bark at them and invite them in to play.

I'm not sure.

Tired

Jul. 3rd, 2026 09:16 pm
billroper: (Default)
[personal profile] billroper
I am still recovering from whatever this is, but I am gradually feeling better, so that's good.

More sleep is clearly in order.
[syndicated profile] tim_harford_feed

Posted by Tim Harford

When the Luddites smashed factory frames in a bid to defend their craft and livelihoods, the machines came out on top. Today, AI and automation threaten to wipe out skilled jobs and flood us with inferior products at a fraction of the price: is history going to repeat itself? FT journalist and author of We Are Not Machines Sarah O’Connor joins Tim to discuss her findings from the front lines about the future of work. Which professions are most at risk, and is there anything workers can do about it?  

Join the Cautionary Club! Along with monthly exclusive Cautionary Tales episodes, club members also receive ad-free listening, monthly video episodes and a monthly newsletter.

[Apple] [Spotify] [Stitcher]

The Birthplace of the United States

Jul. 3rd, 2026 04:00 am
[syndicated profile] earthobservatory_iod_feed

Posted by NASA Migrate

2013-06-01 00:00:00
June 1, 2013
2013-06-01 00:00:00

Editor’s note: In honor of America’s 250th birthday, Earth Observatory is revisiting stories about the landscapes that helped shape U.S. history. The images and text on this page were originally published on July 4, 2017. Explore the full collection here.

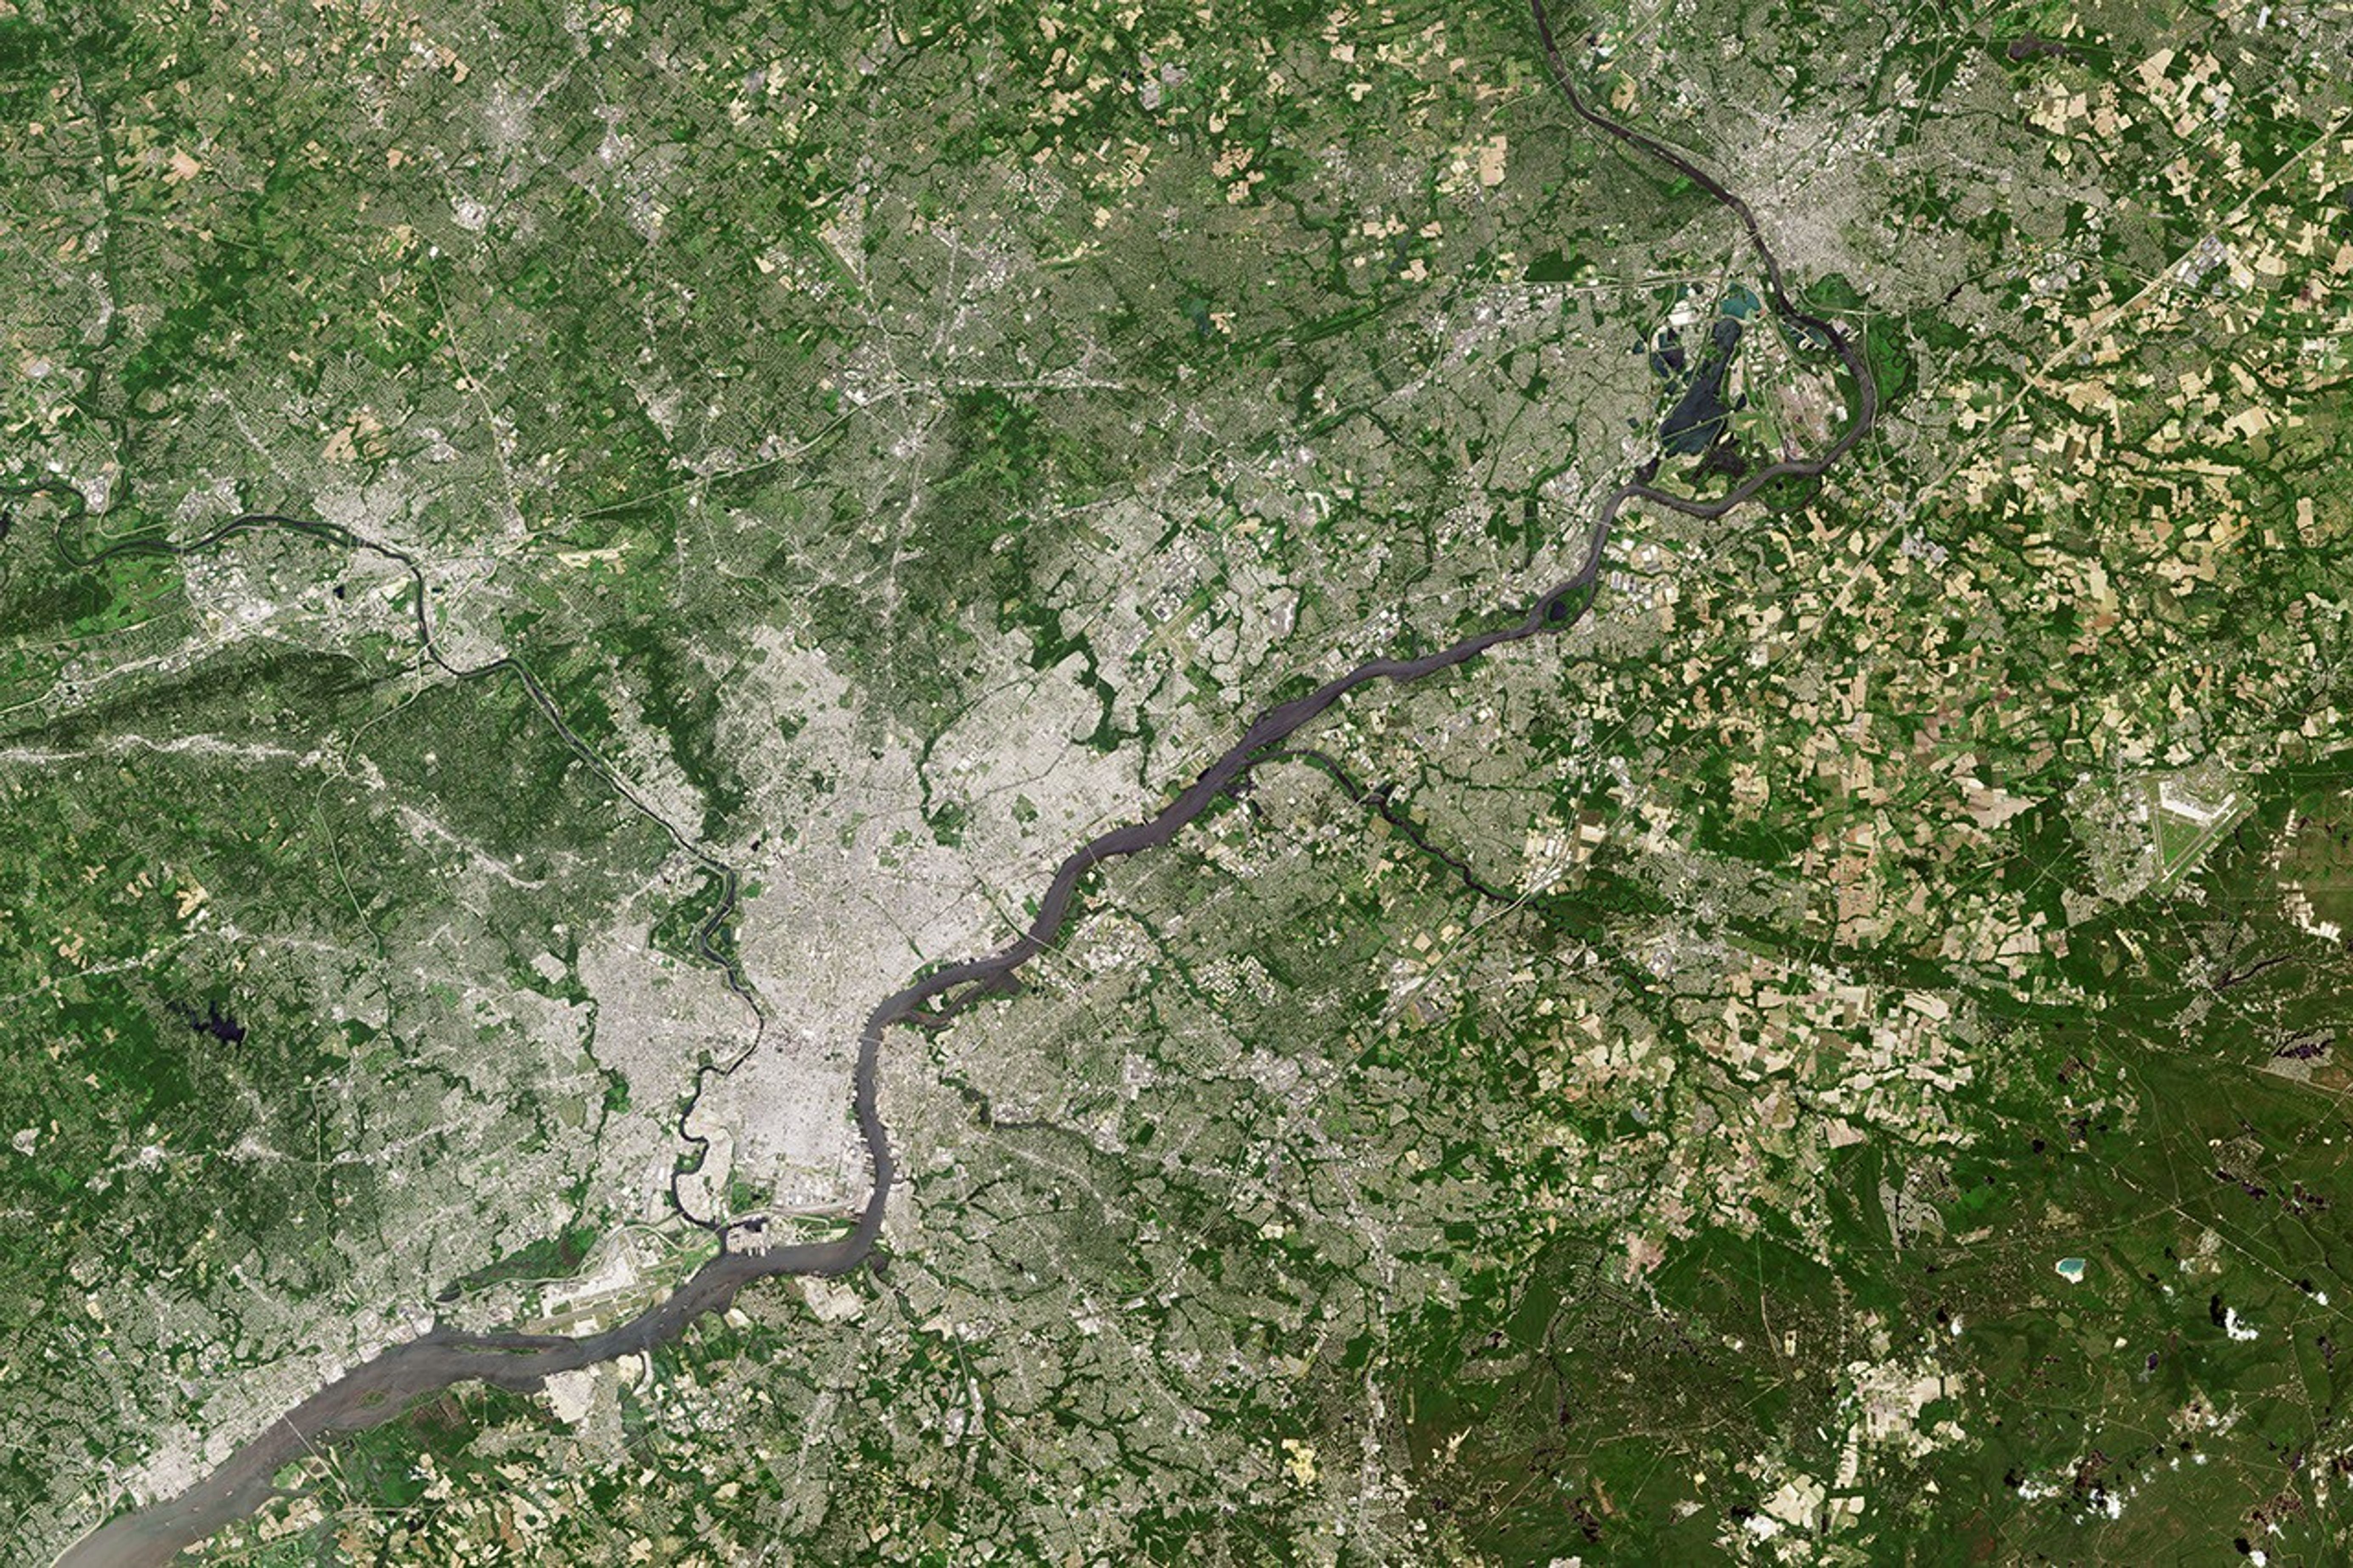
Situated between the Schuylkill and Delaware rivers, Philadelphia was founded in 1682 by William Penn as the seat of a Quaker colony. Later, its location just upstream of the Delaware Bay and Atlantic Ocean made it an industrial, commercial, and cultural hub of the American colonies.

When the area’s original inhabitants, the Lenni Lenape (Delaware) Indians, lived here, much of the land was forested. Swedish and Dutch settlers had already traveled in the area when Penn finally came to it and signed a treaty with the Lenape to establish a city. He called his colony—now the state of Pennsylvania—Sylvania, after its sylvan, wooded appearance. Current-day Philadelphia had “a high and dry land next to the water, with a shore ornamented with a fine view of pine trees growing upon it,” according to a historical account.

More than 300 years after Penn’s arrival, this landscape remains verdant, despite its urban development. The natural-color image above shows Philadelphia and the surrounding area as it appeared on June 1, 2013, when the Operational Land Imager (OLI) on the Landsat 8 satellite passed overhead.

Nearly a hundred years after Philadelphia was established, the Founding Fathers of the United States met in this thriving city roughly at the geographic center of the 13 colonies. It was here that they debated, composed, and signed the documents that would become the blueprints of the American government. In 1776, they signed the Declaration of Independence in Carpenter’s Hall, not far from the red-brick building that then housed Pennsylvania’s colonial government; in 1787, they signed the Constitution in the same place. (Carpenter’s is now known as Independence Hall.) Between 1781 and 1788, it was also the seat of the U.S. government.

Today, Philadelphia is the fifth largest city in the U.S., with more than 6 million people living in its metropolitan area. The city saw its heyday as a manufacturing hub in the 1800s. Currently, its largest sectors include education and health services.

Traces of the city’s history remain embedded in its landscape. A belt of large, tall buildings makes up Center City, the area around Independence Hall. To the south lies a dense grid of smaller houses—South Philadelphia, home to the city’s Italian Market. At one point, this was a satellite town to the city; the two merged in 1854, when the area’s population surged. It remains a diverse area today, home to a large African American community, as well as the remnants of once sizable Italian, Irish, and Jewish immigrant populations.

NASA Earth Observatory images by Jesse Allen, using Landsat data from the U.S. Geological Survey. Story by Pola Lem.

References & Resources

You may also be interested in:

Stay up-to-date with the latest content from NASA as we explore the universe and discover more about our home planet.

An Early “Decoration Day” Celebration
4 min read

In a precursor to Memorial Day, people in Charleston, South Carolina, honored fallen Civil War troops with flowers, songs, and…

Article
Star-Spangled City
4 min read

Two hundred years ago, a battle in the port city of Baltimore inspired the writing of America’s national anthem.

Article
Colonial National Historical Park
2 min read

The colonial communities of “America’s historic triangle” played defining roles in the road to American independence.

Article

The post The Birthplace of the United States appeared first on NASA Science.
A Little Under the Weather

Jul. 2nd, 2026 09:56 pm
billroper: (Default)
[personal profile] billroper
I continue to run a bit under the weather. With luck, this will clear up by tomorrow.

If not, well, we'll see how it's going. :)
[syndicated profile] tim_harford_feed

Posted by Tim Harford

For those of us frustrated that the UK chancellor Rachel Reeves has been offering the wrong solution to the right problem, there has recently been progress, of a kind: she is now offering the wrong solution to the wrong problem.

One of Labour’s key policy goals was to “kick-start economic growth”, a goal that would save a lot of trouble if they could achieve it, but one that was always going to be easier to say than to do.

Perhaps that is why the chancellor has looked for a quick crowd-pleaser. Her recent announcement of “Great British Summer Savings” (really?) promises to fleetingly cut VAT on children’s cinema tickets, children’s restaurant meals (a definitional headache) and visits to the zoo, along with free bus rides for under-16s and tariff suspensions aimed at giving us cheaper chocolate biscuits. (Families are more likely to need help when the energy crisis bites in the winter months, but it’s possible that the chancellor thinks that anything that happens after September will be somebody else’s problem.)

It would be giving this policy too much credit to call it a sugar hit; it’s more like a dusting of saccharine. A small, temporary, rather scattershot tax break is just moving small change around the economy. If you are prosperous enough to take your children to restaurants and amusement parks, you’ll save a few quid at best, and can look forward to the bill in due course. While you wait, you can ponder whether the chancellor really has nothing better to spend her scarce resources on.

Much of the money, in any case, is likely to be snaffled by the companies in question, which are under no obligation to pass on the tax cut. Those in the spotlight may decide that it would be prudent to make a show of doing so. Yet many theatres, theme parks and museums have no direct local competitors and will surely be tempted to pocket this brief summer bonus.

And if they do pass on the full benefit to customers? Merlin Entertainments, which runs Legoland, Alton Towers and Thorpe Park, has promised to do just that. But have you been to Alton Towers in a school holiday? Whatever families gain in lower ticket prices, they are likely to relinquish in longer waits for rides. The only real solution is to increase supply — an intriguing thought, no?

Still, it is nice to see rollercoasters on the front page, because for an insight into what ails the UK economy beyond the nearsighted unseriousness of successive governments, theme parks are not the worst place to start. They may have little practical significance but they make a fine symbol of the country’s ills: the UK’s rollercoasters are underwhelming for much the same reason that the UK economy in general is underwhelming.

I speak with some authority, as the proud parent of a teenage rollercoaster addict. Harford Junior has sampled much of what the UK’s rollercoaster scene has to offer, and now has his eyes firmly fixed on a theme park in Stockholm, another in Belgium, a third near Paris and a fourth near Krakow. (He’ll be lucky.)

This wanderlust speaks eloquently of the power of rollercoaster influencers on YouTube, but also of the fact that the UK just doesn’t have much to offer the connoisseur.

Thorpe Park has the extravagantly tall Hyperia and Alton Towers has The Smiler, in all its labyrinthine dystopian glory. Both are memorable coasters, but both have equally memorable queues.

Speaking as a man who has been dragged to more rollercoaster parks than you might imagine, my experience has been that the European parks are simply more pleasant experiences — shorter queues, better landscapes and themes, nicer food, longer opening hours. 

Compare Alton Towers with Europa Park in south-west Germany. Alton Towers is cheaper, which means it is overcrowded and the queues are absurd. A fast-track pass to skip them is available — for three times the price of admission, at busy times. Europa Park doesn’t sell a queue-jumping pass, and it has enough capacity that in my experience you don’t really need one.

These are subjective impressions, admittedly. But according to the Themed Entertainment Association, none of the world’s 25 most popular theme parks is in the UK. (There are four in Europe.) Only one UK theme park is in Europe’s top 10 — Alton Towers, in 10th place.

Why doesn’t Alton Towers just expand its capacity? A good question. It may be something to do with the limited competition: the UK’s three most popular theme parks are all run by the same operator. There are plans to build a Universal Studios theme park near Bedford, but major theme park openings in the UK are not a frequent occurrence.

It may be a response to planning restrictions — Alton Towers rides are obliged to stay below the tree line, lest they annoy the locals. Alton’s population is not much more than a thousand people, while the annual attendance at Alton Towers is well over two million. As so often in the UK, we let the planning-permission tail wag the economic dog.

The UK economy has suffered decades of under-investment from private and public sector alike, and you can see that reflected in our rollercoaster game. At least the fast-track passes serve as a shining example of how to profit in a low-growth economy: when life hands you long lines, make lemonade by charging people for the privilege of standing at the front of them.

So there we are. The rollercoasters don’t really matter, but what they symbolise does: a supply-constrained economy, hemmed in by rules and habits that don’t just make it hard to build something new and better, but make it hard even to imagine what “new and better” might look like. A brief, poorly targeted and poorly timed tax cut is no more likely to help than handing out fast-track passes is likely to reduce the average queue times at Alton Towers.

What might work? Treating the tax system strategically as a source of revenue and an encouragement to productivity would help — rather than using it as a fun-house source of distraction. Taxes are too complex and don’t raise enough revenue to meet any recent government’s spending plans, so cutting some randomly chosen tax rates for a few weeks is hardly addressing that problem.

But the real challenge lies in the nation’s supply side. Encouraging a few more theme parks would do wonders to improve the experience for coaster fans everywhere. And on the off-chance that we actually get serious? More power lines, houses, vehicle charging stations, roads, railway lines and power generation would be nice. I’ll cope without the discount on my chocolate biscuits.

Written for and first published in the Financial Times on 3 June 2026.

Page generated Jul. 8th, 2026 06:00 am
Powered by Dreamwidth Studios