Prometheus
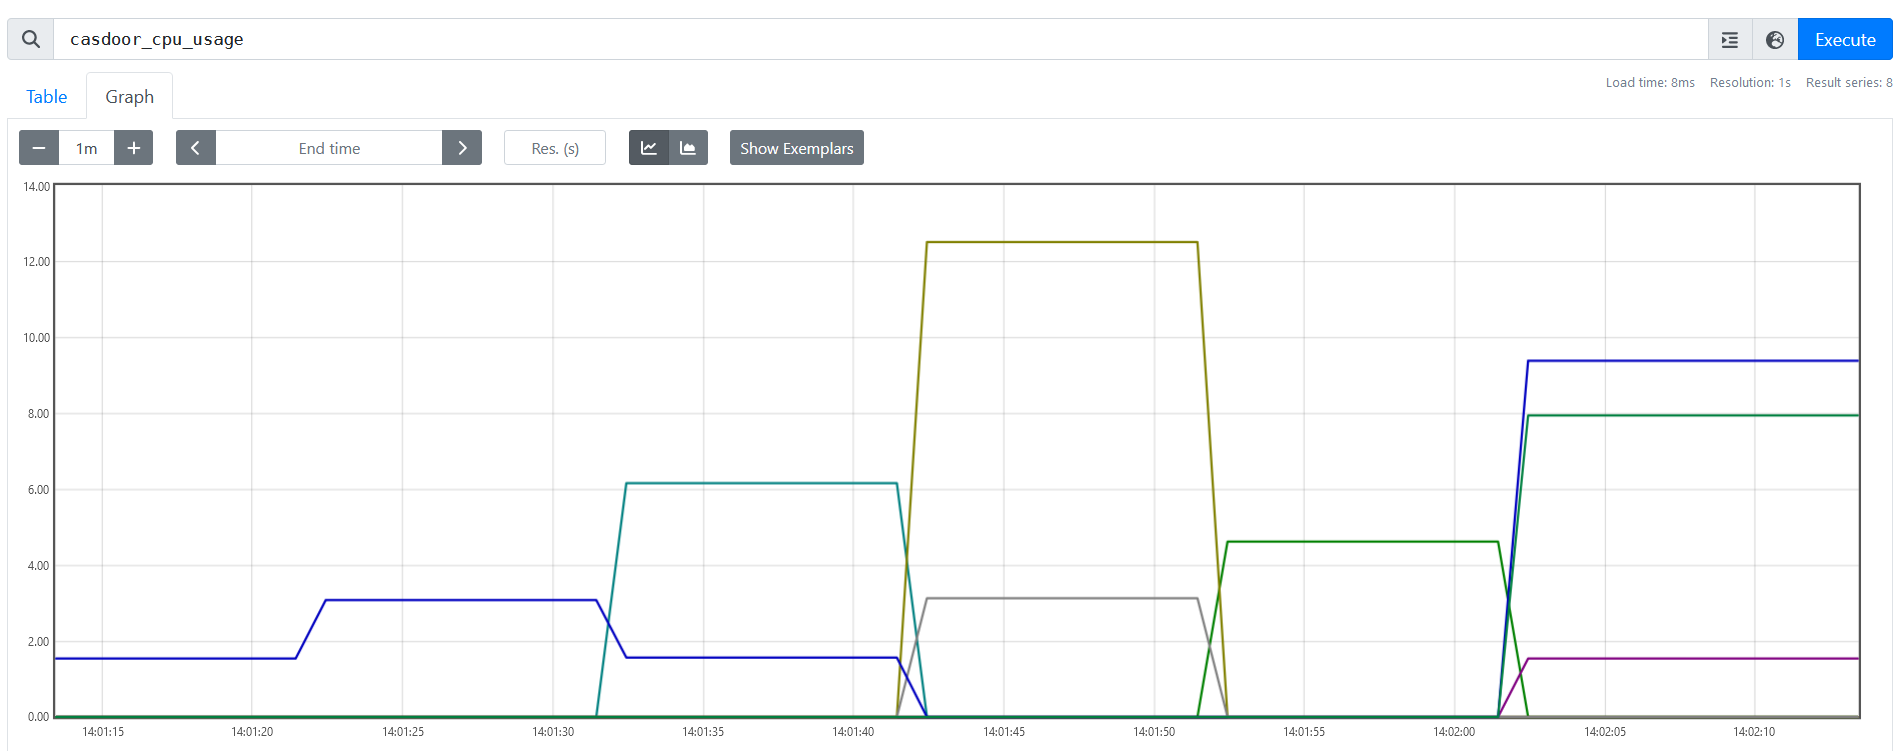
Configure Prometheus to scrape Casdoor for runtime metrics (API throughput, latency, CPU, memory, etc.). Add a scrape job for the Casdoor backend:
global:
  scrape_interval: 10s

scrape_configs:
  - job_name: 'prometheus'
    static_configs:
      - targets: ['localhost:9090']
  - job_name: 'casdoor'
    static_configs:
      - targets: ['localhost:8000']   # Casdoor backend address
    metrics_path: '/api/metrics'
    params:
      accessKey: ['<your-access-key>']
      accessSecret: ['<your-access-secret>']
/api/metrics requires authentication: it can be called by an admin browser session, or by a Prometheus-type key. Create a Prometheus key on the Keys page and pass its accessKey and accessSecret as query parameters (the params block above adds them to each scrape request).
After Prometheus is running and scraping, you can query and visualize Casdoor metrics (e.g. in Grafana).