Data & Insight
Interactive maps, data and insights informing planning strategies and decisions, including household growth projections, neighbourhood plan applications and the timeliness of local authority decision making.
Latest Data News and Analysis

Natural England’s nutrient mitigation scheme has unlocked just 7.5% of the homes that agency predicted, FOI reveals
EXCLUSIVE: The government’s conservation adviser has admitted its nutrient mitigation scheme has unlocked just 7.5 per cent of the homes that its chair had anticipated would be supported when the programme was launched, a freedom of information (FOI) response has revealed, while just two of the 16 anticipated project sites are up and running.
Related headlines

CIL Watch: who's charging what?
Want to know whether your local authority has published Community Infrastructure Levy proposals? Our live table includes the latest details of councils' levy plans, including a breakdown of charges by development type.
Related headlines
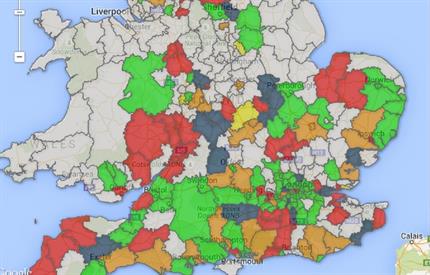
Mapped: Community Infrastructure Levy (updated 12.04.2023)
More than 200 local authorities in England and Wales have published Community Infrastructure Levy (CIL) plans for consultation. Use the interactive maps below to view councils' progress in implementing CIL and the rates they are proposing to charge.
Related headlines
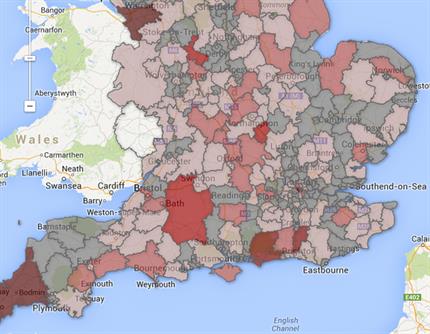
Mapped: neighbourhood plans (updated 14/04/2023)
Use our new interactive map to view how many applications for neighbourhood planning powers have been received by English councils and the names of the groups that have submitted them.
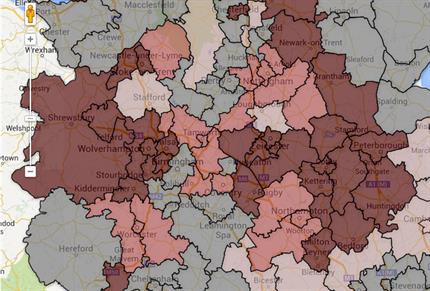
Mapped: core strategy progress data (updated 12.04.2023)
Use our interactive map to view English councils' progress in adopting local plans and view a spreadsheet containing the latest data on local plan coverage from the Planning Inspectorate.
More Data News and Analysis
![]()
-
Town Planner - Somerset
Zodiac Recruitment, Somerset
-
Senior Planning Manager
Penguin Recruitment, Preston Brook, England
-
Associate Town Planner | Associate Director
Penguin Recruitment, Altrincham, England
-
Town Planner | Senior Town Planner
Penguin Recruitment, Cambridge, England
-
Senior Planning Officer
Lincolnshire County Council, Lincoln
-
Town Planner
Aztrum, Wells
-
Chief Planning Officer
Carrington West, East Hampshire, Petersfield, GU32 3LJ
-
Planning Policy Professionals
Oyster Partnership, East Midlands, West Midlands, North of England, South East of England, South West of England
-
Town Planner
Aztrum, Exeter
-
Senior Town Planner
Aztrum, Birmingham