2

I'm trying to graph the Sigmoid Function used in machine learning by using the Matplotlib library. My problem is that I haven't visualized a mathematical function before so I'm humbly asking for your guidance.

I've tried to directly plot the following function:

def Sigmoid(x):
  a=[]
  for i in x:
    a.append(1/(1+math.exp(-i)))
  return a

using the command plt.plot(Sigmoid). But that gave me the error:

TypeError: float() argument must be a string or a number, not 'function'

The final result should look something like this:
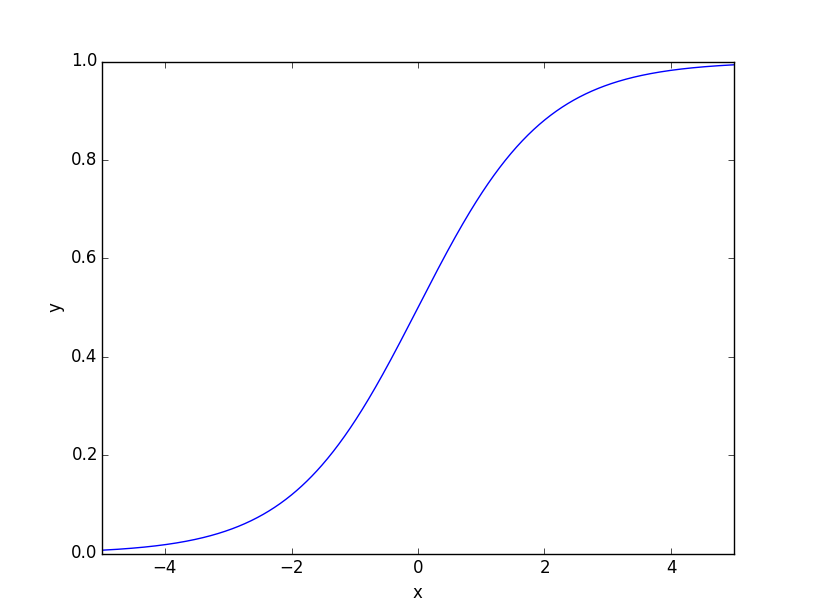
1

5
  • Try this plot.plot(Sigmoid(10)) Commented May 2, 2019 at 19:43
  • 1
    @Hackaholic I think you mean range(10), not 10. Commented May 2, 2019 at 19:47
  • Follow the 1st tutorial matplotlib.org/tutorials/index.html Commented May 2, 2019 at 19:48
  • @PMende yea right Commented May 2, 2019 at 22:23
  • Guys, non of these solutions worked for me. So, I added two lines of code based on the answers I received: x = np.linspace(-5, 5) y = Sigmoid(x). Apparently, I had to define an interval range for the x-axis and let y be the function itself. This means that for every value the function ouputs, Matplotlib will graph it on the interval -5<x<5... Commented May 8, 2019 at 6:19

2 Answers 2

4
import numpy as np
import matplotlib.pyplot as plt

def sigmoid(arr, scale=1):
    arr = np.asarray(arr)
    result = 1/(1 + np.exp(-arr*scale))
    return result

x = np.linspace(-5, 5)
y = sigmoid(x)

fig, ax = plt.subplots()
ax.plot(x, y)

Result:

enter image description here

The ax.plot method takes a pair of 1-D array-likes that are of the same length to create the lines. Matplotlib is not like Mathematica in which you can give an analytic function and a domain of its arguments. You have to give (in this case) x-y pairs (or rather, lists/arrays that can be turned into x-y pairs) And in this case, order matters.

Sign up to request clarification or add additional context in comments.

3 Comments

x is already an array. Why are you again converting it to an array inside the function ?
@Sheldore The input doesn't necessarily have to be an array. np.asarray will use the array as-is (i.e., won't copy it) if it's already a numpy array. Otherwise, it converts it.
My comment was in the context of your posted answer, not a generality.
3

Sigmoid is a function, Matplotlib expects numerical values, i.e., the results of a function evaluation, e.g.

x = [i/50 - 1 for i in range(101)]
plt.plot(x, Sigmoid(x))

That said, you probably want to familiarize with the Numpy library

import matplotlib.pyplot as plt
import numpy as np

x = np.linspace(-1, 1, 101)
plt.plot(x, 1/(1+np.exp(-x))

Comments

Start asking to get answers

Find the answer to your question by asking.

Ask question

Explore related questions

See similar questions with these tags.