


85% of global births will occur in Africa and Asia.


China and India alone account for more than 2.3 billion internet users.
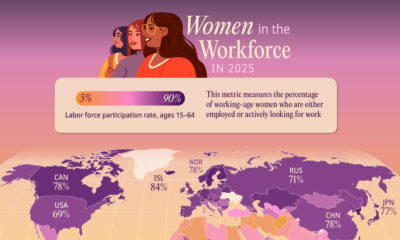

Where do women work? We look at current data from the International Labour Organization to find out. An interesting phenomenon emerges.
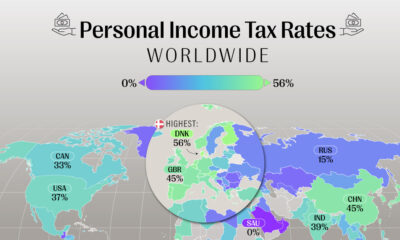

Taxes are due for residents in several countries. How much does your income attract compared to others? We look at tax rates to find out.
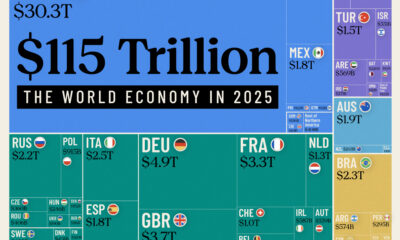

There’s changes coming to the top ranked economies. Here’s each country’s share of the world economy visualized.
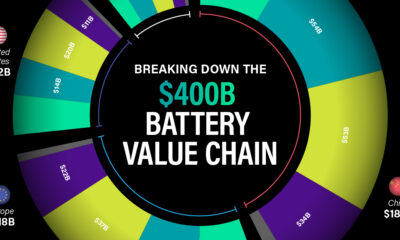

In this graphic, we break down where the $400 billion lithium battery industry will generate revenue in 2030.
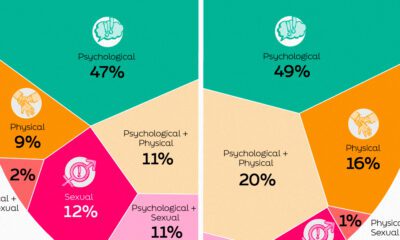

This infographic shows the types of workplace violence and harassment faced by people in the global workplace.
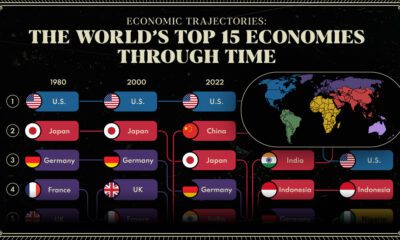

We provide a historical and predictive overview of the top economies in the world, including projections all the way to 2075.
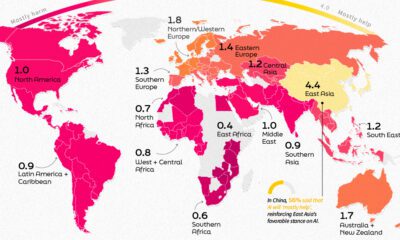

This infographic shows public perception of AI all over the globe and how this sentiment is affected by where you live.
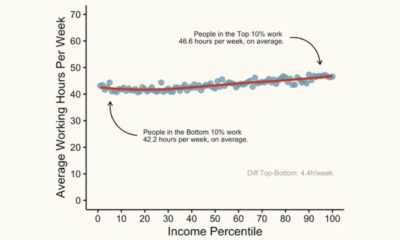

This graphic shows the average working hours between higher and lower-income groups in America, based on income percentile.


 Creator Program

