Need a better way to plan projects? Discover mind map examples that help you visually organize tasks, ideas, and strategies for clearer decision-making.

Key takeaways:
A mind map helps teams organize and connect their ideas around a shared goal by turning broad concepts into a visual network of related thoughts. This structure highlights relationships between topics, making it easier for groups to analyze information, identify dependencies, and plan strategies collaboratively. From research projects to business planning and daily productivity, its uses are versatile. In this guide, I’ll show you practical mind map examples and explain how to use them effectively with your team.
The visual nature of mind maps makes them adaptable to almost any purpose, including brainstorming, project planning, and personal goal setting. Below are common mind map templates that show how you can organize ideas and manage complex information more effectively.
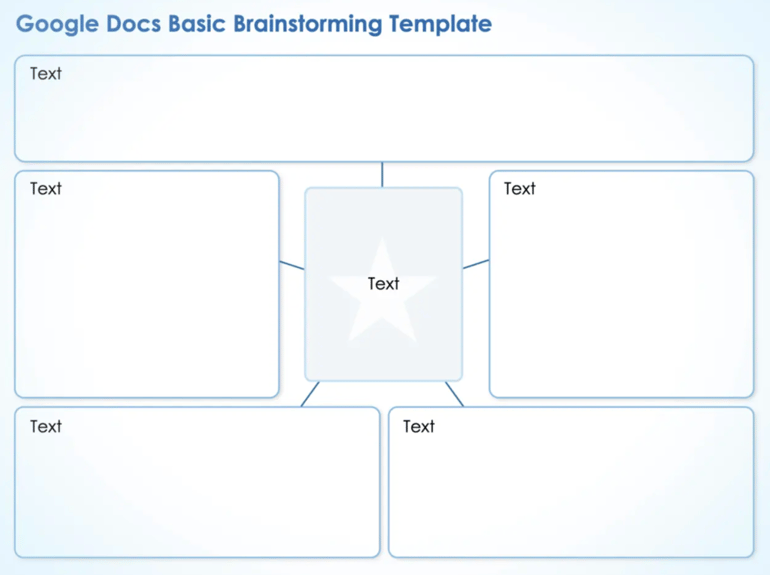
A simple mind map template starts with a main idea in the middle, then shows supporting topics branching outward, each connected by lines to establish relationships. For example, this sample mind map from Smartsheet features a clean structure with a central box connected to surrounding rectangles for separating ideas. Its straightforward grid format is ideal for beginners who prefer a linear approach to brainstorming instead of a free-form layout.
A simple mind map is often used for quick brainstorming or planning tasks, perfect for beginners or small teams that prefer to visualize ideas without using complex elements. To make it effective, limit each branch to a few keywords and use consistent colors or shapes to keep the layout clean and easy to scan.
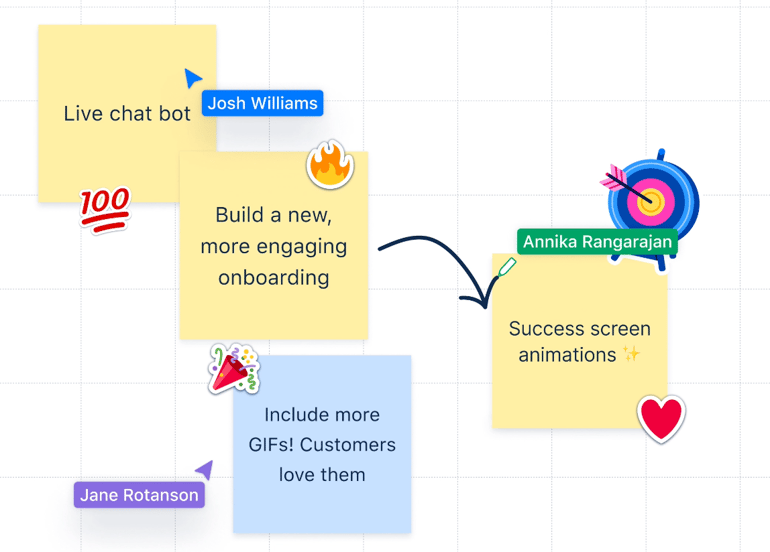
A brainstorming mind map is designed to capture ideas in a free-flowing visual format. Similar to a simple mind map, it starts from a central theme and expands into related thoughts as they surface. Confluence’s mind map features colorful sticky notes and connecting arrows to capture spontaneous ideas and link related concepts.
A brainstorming map uses an informal layout that encourages creativity, allowing teams to expand on each thought and identify potential directions during early project discussions. It is often useful during early planning stages, when teams are still exploring creative ideas before narrowing them down into action items.
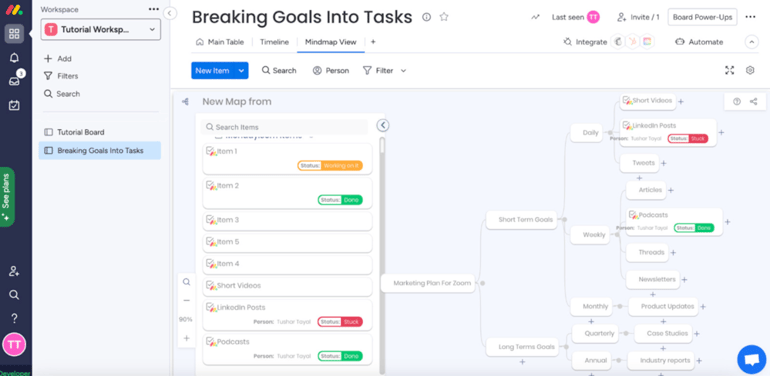
This type of mind map template is ideal for referencing business strategy components like goals, timelines, and expected outcomes, all shown through connected branches. For instance, monday.com displays goals and tasks arranged by timeline, showing how daily, weekly, and monthly objectives connect to larger company goals. It provides a visual hierarchy that makes it easier to manage dependencies and priorities as plans shift.
A business planning mind map is most useful for managers or teams outlining new initiatives or refining existing processes. The components of your mind map will vary based on your operational structure, but it is most effective when each branch reflects a business function (e.g., marketing or finance) for balanced distribution of priorities across departments.
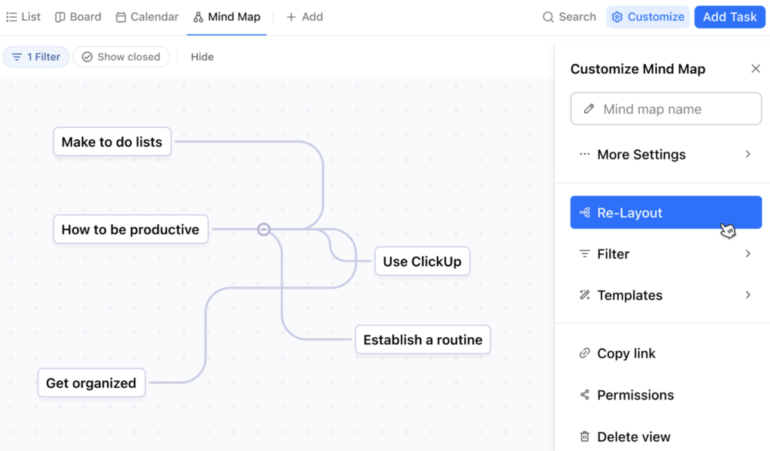
A time management mind map template breaks down activities by a specific period, such as a day, week, or month. An example is this ClickUp mind map that uses a task hierarchy to organize daily priorities, with connectors linking related nodes. Central nodes such as “Make to do lists” and “How to be productive” act as parent topics from which other tasks branch out. The clean interface and flexible layout make it easy to rearrange or expand nodes as priorities change.
This template works for professionals balancing multiple responsibilities or teams scheduling tasks across departments. It lets you visualize high-priority tasks by mapping out deadlines and goals around a central theme, such as a project or work week.
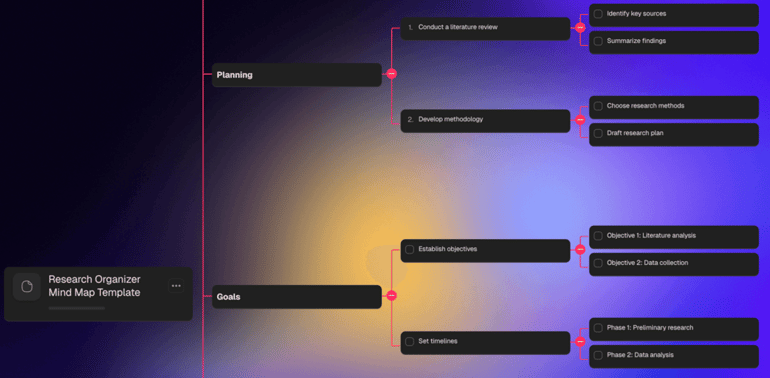
A research mind map template organizes complex datasets by placing the main topic at the center and linking it to citable sources and key findings. For example, this Taskade mind map organizes research stages in a linear structure that moves from planning to goal setting, perfect for mapping multi-phase research projects. The checklist-style nodes add functionality, where users can mark completed steps and maintain accountability throughout the research flow.
This mind map is ideal for analysts or teams handling large volumes of data who need an overview of their research structure. It also aids in understanding where to locate subsets of data, as well as facilitating a clearer understanding of datasets’ relationships to each other. For better readability, use short phrases instead of full sentences and group related references or subtopics under defined branches.
Mind mapping with a team in person creates a more energetic, fast-paced environment because ideas flow naturally through face-to-face discussion and shared whiteboard space. The physical setting also helps teams read nonverbal cues, build rapport, and make quick decisions.
Virtual mind mapping, on the other hand, gives teams more flexibility and structure through digital tools that support real-time editing and asynchronous input. The online format makes it easier to capture every idea, organize versions, and involve distributed team members without losing visibility into the mapping process.
While mind maps differ in style and purpose, they share core elements such as nodes, branches, and colorful visual markers. If you’re creating your own, here are the key features that give a mind map its structure and make it easy to interpret.
| Central node | The main idea or topic placed at the center serves as the foundation for all connected thoughts. |
| Branches | Lines that extend from the central node to show relationships between main ideas and subtopics. |
| Nodes | Individual boxes or bubbles containing keywords or concepts that represent specific ideas. |
| Hierarchy | The structured flow of information from broad topics to detailed subpoints for logical organization. |
| Colors and icons | Visual elements that distinguish sections or categorize related ideas for clarity. |
| Connectors | Linking lines or arrows that illustrate how different ideas or stages relate to one another. |
| Keywords | Words or short phrases that capture essential ideas to avoid overloading the map with text. |
Now that you understand the main types and features, you can move on to building a mind map that fits your team and use case. Follow these steps to create a scalable mind map that turns ideas into structure.
Begin by identifying the specific goal your mind map should achieve, such as planning a project or outlining a research topic. Knowing your purpose shapes how you structure and label each section.
Decide between a digital collaboration platform or a manual sketch for quick brainstorming. Your choice will influence how easily you can edit, share, and expand the map later. Ideally, opting for a visual workspace tool like Miro provides interactive features and ready-to-use templates that make mind mapping more dynamic compared to static, hand-drawn versions.
Place your main topic at the center using a short, descriptive phrase that summarizes what the map will explore. This central node acts as the anchor point for all related branches and ideas.
Add major themes or categories radiating from the center, then include smaller nodes for specific details. Keep connections clear so readers can follow relationships without confusion.
Apply colors or shapes to distinguish topics and emphasize priority areas. Consistent visual markers make complex maps easier to interpret during reviews or presentations.
Review the layout for balance and look out for duplicate or irrelevant nodes. Rearranging branches to reflect actual workflows ensures your map remains actionable and up to date.
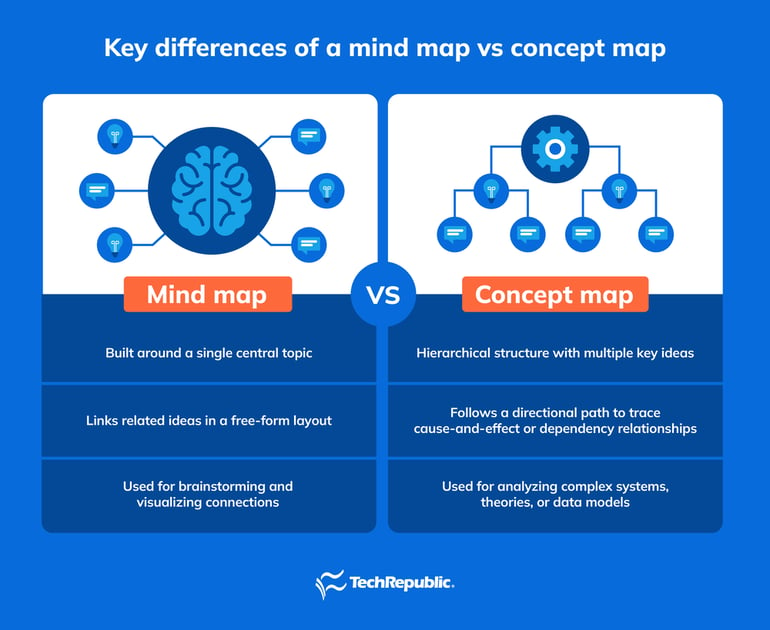
Mind maps and concept maps both organize information visually, but they differ in structure and intent. Visually, a mind map looks more like a web or tree, while a concept map resembles a network with cross-links and directional arrows.
A mind map starts with a single central idea and radiates outward through connected branches that represent related topics, making them best for brainstorming or summarizing ideas. A concept map, on the other hand, contains multiple main ideas connected by labeled lines that describe the relationship between them, which makes it ideal for research and complex system mapping due its logical structure.
Here’s a quick overview to help you better understand the difference between a mind map vs a concept map.
If you’d rather not build from the ground up, many project management platforms now include ready-made mind map examples that let you add ideas and connect tasks instantly. In a 2024 Project.co survey, 6% of people who use a project management tool to communicate with co-workers report better internal efficiency, showing how useful these tools are for collaboration.
To help you find the right fit, here are top mind mapping tools that combine mind mapping with workflow and collaboration features.
 |
|
||
 |
|
||
 |
|
||
 |
|
||
 |
|
Now that you understand how mind mapping works and the tools that support it, the next step is putting the process into practice effectively. The tips below highlight common pitfalls you avoid to help your team apply mind mapping effectively:
Too many nodes make the layout overwhelming and difficult to navigate, which weakens the value of the map. Keep information focused by grouping related ideas and splitting large themes into separate maps when needed.
Heavy use of colors or icons distracts from the actual message and leads to visual noise. A limited palette with intentional icon placement keeps the map readable.
Unlabeled or vague connections make it hard for readers to understand how topics relate. Short labels or directional indicators help define dependencies and eliminate confusion.
When several people contribute simultaneously, maps can quickly lose structure. Agree on naming rules, color use, and formatting so the final map feels cohesive and not like a patchwork of individual styles.
A mind map that never gets updated reduces its usefulness over time. Routine reviews help remove irrelevant branches, update evolving priorities, and ensure the map still supports your current objectives.
Start with a central topic, then branch out with related ideas connected by lines. Keep each node short and use visuals to make relationships easy to see. Reviewing mind map examples helps beginners understand how to organize thoughts and avoid overcomplicating the layout.
Choose a main idea and write it at the center of your page or digital tool. Draw branches for major themes and connect subtopics beneath each one. Looking at examples of mind maps can guide you in setting hierarchies and maintaining visual balance.
A mind map typically includes a central node, connected branches, and keywords that represent ideas. These elements work together to visualize relationships and simplify complex topics into clear, connected parts.

Marianne De Guzman is a technology analyst with over four years of experience in evaluating cloud-based communication solutions, with a focus on VoIP and unified communications. Her analytical approach and strategic insights empower businesses to optimize their communication infrastructure.
