
Abstract
Contamination of arsenic and fluoride in drinking water reservoirs is a serious health issue in the Sibi district, Balochistan, Pakistan. The contamination has already been affecting a large population of the district. Dental fluorosis and dermatitis are the most common reported illnesses in the area. This study focused on the evaluation of the root causes and pathway by which it reached to the body. Questioner analysis, simple examination, and pictorial representation were used to study the prevalence of diseases caused by As and F. People of the Sibi district were found to consume both surface and groundwater, which were highly contaminated with arsenic and fluoride. The saturation index, ranging from 1 to 7, showed high enrichment of contaminants in both types of water. Geochemical calculations and the sodium absorption ratio were evaluated. High values of the saturation index of different salts showed high saturation of salts in water. The principal component analysis grouped the data into three clusters, showing that the surface water has no resemblance with the control water. High degree of contamination was observed for most of the samples, whereas, some samples of ground water were closed to the control group; a group of samples within WHO limits. The correlation studies and other calculations also revealed that the F and As reached lethal limits in the drinking water and thus caused severe health damage to the local area population. The diseases found in the area are fluorosis, keratosis, dermatitis, and melanosis.
Introduction
There are various natural and anthropogenic sources of the enrichment of toxic ions in both surface and ground water reservoirs. Ions, like arsenic, fluoride, sulfate, nitrate, manganese, iron, selenium, and chloride, radioactive materials, and heavy metals have severe effects on the quality of water, which in turn produces serious health consequences. Among the above-listed pollutants, arsenic and fluoride are the most hazardous ground water pollutants. The health of humans and livestock is at high risk in the presence of elevated level of arsenic (As) and fluoride (F) in the soil, water, and crop. Fluoride is essential for the teeth health; however, the required concentration is too low. Drinking water is the biggest contributor to excess F− exposure mainly because of the geological composition of bedrock and soil. It results to dental fluorosis and crippling skeletal fluorosis and affects the functions of the non-skeletal systems, such as the brain, liver, kidney, and spinal cord (Chandio et al. 2015). Fluoride-bearing mineral rocks in the earth's crust are the main source of fluoride contamination in water. Common fluoride-containing minerals are fluorite, calcite, and granite; however, it is also found in the coal reservoirs.
The surface and ground water of the Sibi district, the area selected for this study, is highly influenced by the geological mineralized zonation climate. Higher arsenic and fluoride concentrations are associated with mafic, ultramafic, and sedimentary deposits derived from volcanic rocks and Ghazij group; hence, mineral leaching, erosion of sedimentation, and dumping of coal and other waste appear to be the main sources of contamination. The study area receives the water from the Nari Bank, Nari Gaj, and Bolan rivers, which are subject to high floods, especially in July and August. The aquifer of the ground water is also recharged due to the river water. The rivers are coming from high-elevated mountains to level plain, lying respectively at the apex and base of the study area and are passing in between the mountains where the large mining area of gypsum, coal, and sulfur is located. The wastes of the coal and other minerals are dumped into these rivers.
Arsenic in surface soil is naturally lying in the range of 1–4 ppm; however, a high level of arsenic is found in mining areas, geological deposits, waste sites, and agricultural lands doped with arsenic due to extensive use of arsenic-based pesticides (Mandal and Suzuki 2002). Arsenic can be organic (when linked with hydrogen and carbon) or inorganic (combined with chlorine, oxygen, and sulfur). Organic arsenic is mostly present in fishes, whereas, contaminated ground water, surface water, foods, and soil possess inorganic arsenic. Inorganic arsenic is far more toxic than organic arsenic. Accumulation of arsenic in the body may result in hypertension, ischemia, skin lesions, some endemic peripheral disorders (black foot), severe arteriosclerosis, neuropathies, diabetes, and various types of cancers (Chen et al. 1995; Engel et al. 1994; Kadono et al. 2002; Tseng 1977). The major route of arsenic exposure is the contaminated ground or surface water. Arsenic, being odorless and colorless, can be ingested without notices and can cause skin cancer. Inhalation of airborne particles with adsorbed arsenic can cause lung cancer (IARC 1980). The habitants of the Indian subcontinent, including Pakistan, Bangladesh, Nepal, India, and Pakistan, are exposed to high level of arsenic toxicity. Approximately 45 million residents of Bangladesh are drinking arsenic-rich water (above 10 ppm), and nearly 24,000 adults are victim of arsenic toxicity which causes large number of associated deaths each year (Flanagan et al. 2012).
The World Health Organization (WHO) and United States Environmental Protection Agency (USEPA) declared a threshold of 10 ppb for inorganic arsenic in drinking water and 1.5 ppm for fluoride. This threshold is crossed by several countries of the world (WHO 2017).
Contamination of water with fluoride has previously been reported for areas of Thar Desert in Pakistan (Rafique et al. 2008), and both arsenic and fluoride contamination is reported for Nagarparkar, a town in the Tharparkar district of Sindh province, Pakistan (Rafique et al. 2008). Numerous events of arsenic and fluoride toxicity in the local population of the Sibi district of Balochistan province of Pakistan have been reported in different media sources. The objective of this work was to evaluate the authenticity and root causes of these media reports. For this reason, ground and surface water samples were collected from nine different villages of the area. The human health risk assessment was made using obtained data from questioner and water analysis. Piper plot and ion balance were used to estimate the water quality.
Material and methods
Description of study area
The Sibi district was the area selected for this study. It is located in the south-east of the Quetta City, the provincial capital of Balochistan, Pakistan. The district shares its boundaries with Ziarat, Kohlu, Dera Bugti, Nasirabad, Jhal Magsi, Kachhi, and Quetta districts as shown in Fig. 1. The area is geographically positioned between 67°21′3″–68°34′38″ east longitudes and 28°46′40″–30°07′34″ north latitudes. The district is located at 675 km (aerial distance) south-west (228° bearing) of Pakistan's capital city, Islamabad, and 110 km south-east (131° bearing) from Quetta City.

Map of the study area of the Sibi district, Balochistan, Pakistan
Sibi bears a geographical area of 9613 ha, of which 3.8% (36,984 ha) is not available for cultivation. The potential area of 8.2% (78,698 ha) is available for agricultural crop cultivation, and the total forest area is 8920 ha. The projected population of this district is 174,886 in 2016, as per the survey of Pakistan.
The study area has a tropical desert climate, and the major part of the district is low lying and falls in the agriculture-ecological zone I (625 m above sea level). The district is one of the hottest areas of the (Indo-Pak) Sub-Continent. Sibi is called “the hot spot” of Pakistan. The temperature during summer ranges between 40 and 55 °C, while in winter, it ranges between 18 and 33 °C. The season is mostly rainy in the months of June and July. Rainfall varies from year to year, but the average annual rainfall observed is 300–400 mm. There are four main sources of irrigation in the Sibi district, which are tube wells, canals, stream/river, and wells. Most of the crop cultivation area, 14,608 ha, is irrigated by means of tube wells, encompassing 55% of the total irrigation sources. Canal water is the second main source of irrigation, and it covers 5329 ha constituting 42% of the total irrigation sources in the district of Sibi. However, there is no Karez/spring irrigation system in the Sibi district. There are certain numbers of wells that are spread at 101 ha area forming 1% contribution to the irrigation source. Stream or rivers bear 2% contribution to the irrigation sources. The population of the study area uses surface water mostly for both drinking and household purposes. The water distribution to the habitants comprised of surface water (42%), tanker trucks (4%), piped water, (44%), protected dug well (2%), tube well or bore holes (6%), and public stand pipe (2%).
Sampling and treatment
In total, 27 samples of surface and groundwater were collected from nine different villages, namely Chandia, Dhepal, Khajjak, Kolachi, Kurak, Lundi, Luni, Sibi, and Tallii, as shown in Fig. 1. Mostly, open dug wells underground water have a depth of 15–160 ft, river stream is 5–6 ft, tube well is 200–250 ft, and canal is 8–12 ft. The control was used by collecting the water from the R.O plants that are installed for the water purification of the area. The distance between the mining area and the study area varies, with approximate distance of 4–5 km.
Chemicals and instruments
Chemicals
Milli-Q water was used for all the performed experiments. All chemicals and reagents were of analytical standard and used without further purification. EDTA, hydrogen peroxide, acids (nitric, sulfuric, hydrochloric), and bases (sodium hydrogen carbonate, sodium hydroxide) were from Sigma-Aldrich. Standard solution of As (1000 ppm) was prepared by dissolving As2O3 in 1 M potassium hydroxide, and pH was maintained neutral using hydrochloric acid of 1 M. The 3% reducing agent sodium tetrahydroborate in 1% of NaOH was prepared freshly and filtered before use. The pH was adjusted using 0.1 M of both HCl and NaOH. All glassware were first washed and soaked in 5 M HNO3 overnight and rinsed with copious amount of deionized water before use.
Analytical procedure
The water quality parameters obtained for each water sample and the respective techniques used for the analysis are summarized in Table 1. Water samples, if required, were diluted using deionized distilled water.
Statistical tools
The statistical analysis was carried out using Minitab version 17. The software was used for data reduction, classification, and interpretation of the empirical data. Descriptive and basic statistical tests included determination of correlation coefficient, construction of piper plot, and the principal component analysis to find any grouping among different types and sites of the samples.
Results
The obtained water quality parameters, their results, and respective WHO limits are summarized in Table 2. The results are reported as range, mean, and standard deviation. The mean values of most of the physiochemical parameters were quite above than the WHO limits. The pH values were found within the WHO limit for both surface and groundwater samples. The TDS and EC were much higher in all surface and ground water samples. The TDS ranged within 8100–11,200 ppm for surface water and 1550–6000 ppm for ground water, respectively. The EC values for surface water ranged within 10.1–13.5 ppm, whereas the range for ground water was 1.89–8.5 ppm. High salinity is expected for samples with high EC values (Kazi et al. 2009). The same was observed for the surface water samples which had very high EC as compared with ground water samples. High levels of \( {\mathrm{CO}}_3^{2-} \) and \( {\mathrm{HCO}}_3^{-} \) were found in both surface and ground water samples, which lead to prediction of high alkalinity. The concentration of K+, Na+, Mg2+, and Ca2+ ranged from 13.8 to 23.1, 2160 to 3000, 150 to 287, and 249 to 425 ppm for surface water and 8.5 to 28.7, 230 to 1636, 60 to 385, and 110 to 5000 ppm in ground water, respectively. The concentration of Fe ions in both surface and ground water exceeded the WHO acceptable limit.
The concentration of anions, like \( {\mathrm{SO}}_4^{2-} \), \( {\mathrm{NO}}_3^{-} \), and Cl−, was in the range of 1600–2850, 786–1650, and 2667–3680 ppm for surface water and 410–1650, 15–1300, and 225–2418 ppm in ground water, respectively. The concentration of two most targeted pollutants, fluoride and arsenic, was found much higher than the WHO limits. The respective concentration ranges of fluoride in surface and ground water samples were 2.8–12.7 and 2.4–6.2 ppm and those of arsenic ranged from 2.58 to 4.26 ppm in surface water and 0.321 to 3.54 ppm in ground water.
Geochemical calculations
Chemical weathering
Chemical weathering was evaluated by the construction of various plots between different combinations of cations versus the anions. In Fig. 2a and b, HCO3− + SO42− and TZ+ were plotted against Ca2+ + Mg2+y. It was observed that the data were scattered around 1:1 ratio line. However, for a plot of Cl− constructed against Na+ + K+ (Fig. 2c), most of the data lied above the 1:1 line. The plot in Fig. 2d shows that all the total positive and negative ions were scattered across the negative and positive axis with R2 of 0.3.
Bivariate plots of (a) Ca2+ + Mg2+ vs. HCO−3 + SO2−4, (b) Ca2+ + Mg2+ vs. TZ+, (c) Na+ + K+ vs. Cl−, and (d) (Ca2+ + Mg2+)–(HCO3− + SO42−) vs. (Na+ + K+)–Cl− of water samples of the studied sites
Saturation index
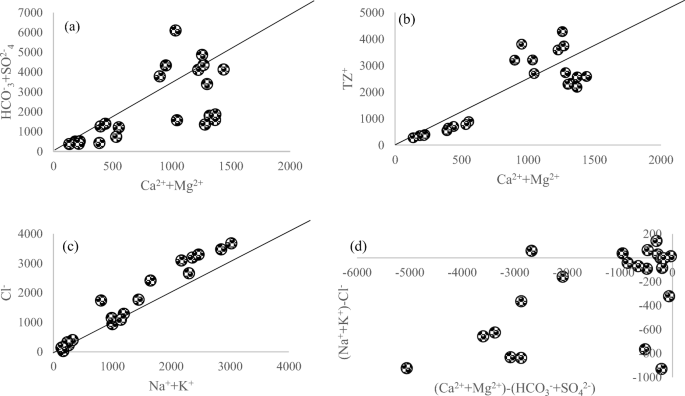
Phreeqc Interactive software (Version 3) was used to determine the different salts present in the ground and surface water. The saturation index values for calcite, dolomite, gypsum, and fluorite of different water sites were calculated, and their plots are presented in Fig. 3. Both ground and surface water were saturated with these salts, and the SI values ranged from 1 to 7 for all the salts.
Relationships of various water sample chemical components (a) fluorite with calcite, (b) calcite with dolomite, (c) calcite with gypsum saturation index, (d) concentration of Ca2+ against saturation index of calcite, (e) Concentration of Mg2+ against dolomite saturation index, (f) Ca2+ and gypsum, (g) SO42− concentration versus gypsum saturation index, (h) F− against fluorite, and (i) total cation against total anions
Sodium adsorption ratio
The hazards of sodium were estimated using the sodium adsorption ratio (SAR). The following formula was used for this calculation.
The SAR values for ground water were in the range of 15–79. However, the values for surface water ranged between 103 and 148. The mean values for ground and surface water were 39.10 and 120.3, respectively.
Statistical calculations
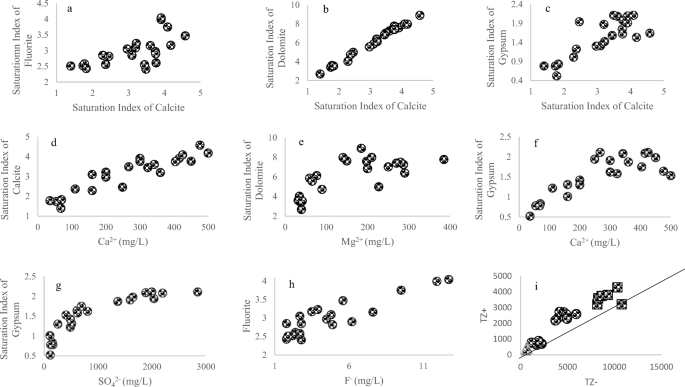
The principal component analysis (PCA) and cluster analysis distributed the data into three clusters. The dendrogram also showed three basic groups for all sampling sites. The graphs showing the distributions and grouping are presented in Fig. 4. These major groups were due to ground water, surface water, and water from the control sites. The control sites were selected because of their low values for almost all the tested parameters, and the evaluated values of various parameters were also found within the WHO acceptable limits.

PCA plot (a) score for As and F distribution and different water quality checks in Sibi; inset is the screen plot showing the significant factors. (b) Scores showing distribution and clustering of different water samples.
Discussion
Water of different sites and types (surface and ground) showed significant diversion from the WHO limits for drinking water. The variation in arsenic and fluoride levels along with the other physicochemical parameters studied could possibly be an outcome of high-level contamination and the involvement of various complex chemical factors. Presence of high chloride and sulfate indicate that water was quite hard in the area. The values of TDS and EC were also very high which showed high level of cations and anions in the studied water, possibly due to the ion exchange phenomenon (Baig et al. 2009; Lopez et al. 1999). High level of ions is a indicative of contamination due to different anthropogenic sources. The surface water samples were found more contaminated compared with ground water. Studied water was basic in nature with very high TDS and EC values which could be a manifestation of mineral dissolution.
Chemical weathering
Chemical weathering study for sulfide, carbonate, and silicate minerals was focused to evaluate the contribution of lithogenic and anthropogenic sources for contamination of surface and ground water in the Sibi district, Balochistan, Pakistan. Lithogenic sources could increase the level of dissolved ions in aquifers. An overall excess of (Ca2+ + Mg2+) over (HCO3− + SO42−) suggests the contribution of carbonate sources and demands the presence of Cl− and NO3− to balance Ca2+ + Mg2+, as shown in Fig. 2a. In a variation plot of TZ+ versus Ca2+ + Mg2+ (Fig. 2b), the data points were scattered on both sides of 1:1 ratio line. The observed pattern describes the existence of almost equal contribution of Na+ and K+ with an increase in dissolved solids.
Water contamination with ions was attributed to both lithogenic and anthropogenic sources. Anthropogenic sources included municipal and industrial wastes, agricultural and industrial runoff, mine drainage, landfill leachate, and atmospheric contaminant deposition. Lithogenic sources included dissolution of evaporates, weathering of carbonate, sulfide, and silicate minerals. The value of (Na+ + K+) and Cl− ratio for surface water was 0.8, whereas for ground water, the value was 1.2. This suggests that surface water was rich in Cl− ions, whereas, ground water had alkali ions more than Cl−, which could have been originated from sources other than the precipitation sources. The main reason could be the weathering of silicates. In total, cationic balance Na+ and K+ contributed 80% and TZ ratio of 0.7 for surface water, whereas the same ratio was 0.6 for ground water. The ratio of (Ca2+ + Mg2+) and (Na+ + K+) was 0.19 for surface and 0.48 for ground water, indicating the silicate contamination in chemical composition of the studied water samples. Both surface and ground water samples had Na+ to Cl− mole ratio of less than one, which shows the halite dissolution as a source of Na+ ions (Meybeck 1987). The ratio between Ca2+ and Na+ was 0.13 and 0.47 for surface and ground water, respectively. The low value of ratio indicates the dissolution loads of draining aquifers of silicates which could be attributed to high solubility of Na+ as compared with Ca2+. The bivariate plot also indicated a large scattering in the data points of both surface and ground water samples due to varying extent of ion exchange phenomenon. Plot of TZ−/TZ+ shows a good agreement in the data with R2 value of 0.95, a balance between the total cations and a total anion.
Saturation index
Saturation index was calculated to find the saturation level of soluble minerals. Figure 3 shows the relation among different salts. Figure 3a–c shows correlation of SI calcite with SI fluorite, dolomite, and gypsum. It was observed from Fig. 3 that there was a high degree of saturation in both surface and ground water, as the values of saturation index are 1–7 for all the salts.
Statistical analysis
Cluster analysis and principal component analysis
The similar types of water fall into same group and form a cluster (Danielsson et al. 1999). When these similar cluster observations merged, they formed a dendrogram (Chen et al. 2007a, b). The presented dendrogram (Fig. 5) clustered the sampling sites into three groups that comprises of the surface water, ground water, and control sample sites. The first two clusters differentiated surface water from ground water. The latter was further subdivided into two clusters, the ground water and control samples.

Clusters of different sites are presented in dendrogram on the basis of F and As distribution and other discussed parameters
The PCA was performed to find the possible correlations among the principal components and the studied variables. It was applied on concentration of heavy metals and various physicochemical parameters of surface and ground water samples. The 92% of total variance was attributed to five factors (Table 3). The scree plot is shown as inset in Fig. 4a. The primary y-axis corresponded to eigenvalues and secondary y-axis to cumulative variability. The scatter biplot of F1 and F2 clustered the data into three groups (Fig. 4b). The contribution of factor 1 in total variance was 68% with high positive loading on almost all the metals, cations, anions, contaminants, and physicochemical parameters. It indicates its geological effects (lithological), anthropogenic and geogenic sources (Harvey et al. 2002). The contribution of factor 2 was 13.4% to the total with the positive loading on Ca2+ (r = 0.57), CO32− (r = 0.925), and HCO3− (0.672), which shows carbonate effect, along with agrochemical and industrial effects (Hasan et al. 2007). Factor 3 contributed 4.6% with high positive loading of F (0.521), which indicates geogenic and anthropogenic sources (Villalobos et al. 2001). The factor 4 contribution was 3.9% with negative loading of K+, which indicates the geogenic source contribution (Villalobos et al. 2001). Factor 5 with loading of 2.54% had strong loading of fluoride due to the same reason. Fluoride and arsenic from both natural and anthropogenic sources were reported as a possible reason for the ground and surface water contamination. Hence, it was concluded that water samples of ground and surface water are separated from control samples due to different degrees of contamination. The separation was based on water collection sites.
However, the chemical composition of surface water was much more alarming in comparison to the groundwater. The similar distribution has been obtained from cluster analysis.
Arsenic in ground and surface water
The total concentration of arsenic in surface water samples of Sibi district, Balochistan, Pakistan, was in the range of 2.58–4.26 mg/L. The values were 250–420 times higher than the WHO permissible limits of 0.01 mg L−1 As. All samples of ground and surface water were highly contaminated irrespective of their location and depth. Table 4 showed the positive correlation of As with TDS, salinity, Mg2+, Fe, Cl−, and SO42−, whereas, negative correlation with turbidity.
The concentration of As in groundwater ranged 0.321–3.54 mg/L. Their values were 31 to 353 times higher than the WHO allowed limit. Arsenic was found strongly correlated with EC, TDS, salinity, Na+, Ca2+, and Cl−. Similar trends of arsenic for salinity and TDS were reported in the studies for the Thar region, Pakistan (Brahman et al. 2016). High value of As in surface water as compared to ground water could be attributed to the evaporation of surface water which resulted in the increase in the concentration of arsenic, which produced higher pH range of 8.2–8.8. Correlation table also shows a poor relation between arsenic and fluoride, but both were found in excess in surface water than the groundwater. These results agreed with the reported data (Farooqi et al. 2007). This shows that both elemental contaminations have same origin.
Fluoride in ground and surface water
It was observed that fluoride-rich surface water was enriched in Ca2+ (0.68, p = 0.134) and negatively correlated to Na+ (− 0.84, p = 0.74) and Mg2+ (− 0.65, p = 0.158). Low values of Mg2+ and Na+ are due to the cationic exchange process. The studied surface water samples were found to be alkaline with pH ranging from 8.2 to 8.8, and groundwater pH ranged from 7.7 to 9. High pH favored the precipitation of Ca2+ as calcite (Sarma and Rao 1997). It was observed that the studied surface water samples were also saturated with mineral. Fluoride adsorption occurred in acidic medium while desorption at alkaline pH and hence dissolution favored basic pH (Saxena and Ahmed 2003). The increase in fluoride concentration resulted in an increase in saturation index of fluorite. It was reached the saturation point at concentration of fluoride ion greater than 12.7 ppm. All ground and surface water samples were saturated with fluorite (Fig. 3h). Low concentration of Na+ and Mg2+ also promoted the elevation of fluoride in the water samples. Fluorite solubility controlled the level of fluoride in water. The water samples showed a good correlation of gypsum with SO42− and Ca2+ (Fig. 3f and g). One of the various possible reasons for high fluoride concentration in surface and groundwater could be the solubilization of components due to evapotranspiration and evaporation (Jacks et al. 2005). But, this reason did not seem to suit in this study as there was no correlation between F− and Cl− (0.18 in groundwater, − 0.37 surface water). Cl− is the most conventional element during evaporation, Here, Cl− gives positive correlation with Na+, Mg2+, Fe, and Ca2+ in ground water and with Na+, K+, Mg2+, and Fe in surface water samples. The correlations of F− with metal ions and physicochemical parameters in ground water samples are reported in Table 4. In surface water, a positive correlation was observed for fluoride ion with Ca2+ (0.68, p = 0.134) and CO32− (r = 0.83, p = 0.042). The fluoride dissolution was fast at alkaline pH. The similar nature of results has already been reported in various studies from different parts of the world (Gizaw 1996; Rafique et al. 2009). There was a negative correlation of F− ions with TDS (− 0.81, p = 0.047), SO42− (− 0.83, p = 0.038), Na+ (− 0.84, p = 0.74), salinity (− 0.84, p = 0.03), and Mg2+ (− 0.65, p = 0.158). The correlation values of F− ions with metals and other physicochemical parameters of ground water samples are reported in Table 5. There was a strong positive correlation of F− with pH (0.6, p = 0.047), which is in good agreement with the reported results (Valenzuela-Vasquez et al. 2006). This correlation is possible if F− ion in a mineral is replaced by OH− ion, possessing similar ionic radii (Rafique et al. 2009). It has also been reported that clay minerals can hold F− ions at its surface. Whereas, at higher pH, F− ions are displaced and released in the groundwater (Rafique et al. 2009; Sreedevi et al. 2006). This could possibly explain the relation between high pH and high F− concentration in groundwater of Sibi Division, Baluchistan, Pakistan. Similar results have also been reported in the study on Indian groundwater samples (Saxena and Ahmed 2003).
Saturation index calculations were performed on both ground and surface water. The values were plotted and presented in Fig. 3. The figure indicates a direct relation between fluorite and fluoride ion concentration. The system reached saturation for F− concentration of 13 ppm. The higher concentration of F− in both ground and surface water might have been because of under saturation of calcite. This favored the saturation of fluorite and preventing the activity of calcium, which resulted in increase in ratio between F− and Ca2+ (Datta et al. 2000; McCaffrey and Willis 2001). Elevated F− levels were due to both calcite and fluorite as they mainly controlled the aqueous geochemistry in the district. The elevated F− level could also be explained due to CaCO3 precipitation at high pH, which resulted a removal of Ca2+ and subsequently dissolved more fluorite (Kundu et al. 2001). The distribution of As and F among different sampling sites, there standard chemical concentration units, is presented in Fig. 6. The standard units are defined as z = (x − u) / s, where u is mean value, x is concentrated raw data, and s is standard deviation.
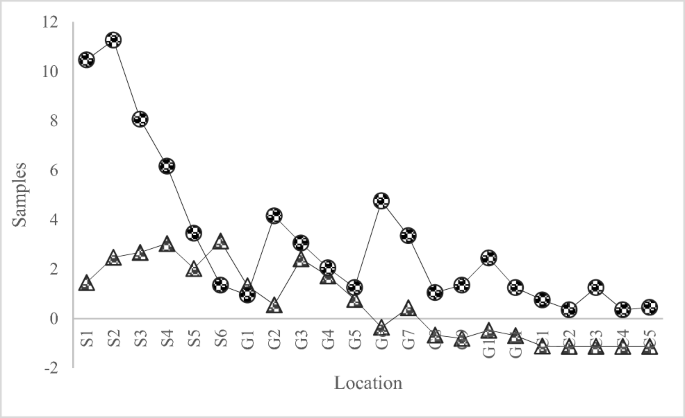
Standard unit of chemical concentrations of fluoride and arsenic in studied water samples of the Sibi. As samples are represented as Δ and F− as ○.
Health hazards of arsenic and fluoride
Ingested arsenic can cause risk of skin and several associated cancers, as reported by Smith et al. (1992). The exposure of arsenic via drinking water is highly risky for skin, lung, liver, kidney, and bladder cancer. The human exposure to As varied with the organs, including lung, skin, kidney, and liver (Dang et al. 1983; Yamauchi and Yamamura 1983). In countries like Chile, India, Mexico, and Taiwan, people exposed to high level of arsenic through drinking water resulted in elevated skin cancer (Tseng et al. 1968; Cebrian et al. 1983; Zaldívar 1974). The mortality due to liver cancer is associated with the ingestion of As. In Taiwan, a high inorganic arsenic in drinking water was reported to cause numerous deaths due to liver cancer. A case study on a group of people exposed to different levels of As reported that the liver cancer increases as the level of arsenic increased (Chen et al. 1988). Another case study suggested a linear trend between the number of years of arsenic exposure through well water to the lung cancer (Chen et al. 1986). In another study, conducted in Taiwan (Chen and Wang 1990), epidemiological results showed that the risk of lung cancer increased with an increase in inorganic arsenic ingestion. Moreover, studies in the same area revealed that kidney and bladder cancers were also related to the exposure of arsenic through drinking water (Chen et al. 1988). The exposure to arsenic also led to prostate cancer (Bulka et al. 2016), cardiovascular diseases (Wang et al. 2007; Chen et al. 2007a, b), dermal problems (Chowdhury et al. 2000; Rahman et al. 2001; Mukherjee et al. 2005), reproductive problems (Chakraborti et al. 2003; Ahamed et al. 2006), and many other illnesses (Chakraborti 2011).
The major source of fluoride intake in humans is drinking water. It is estimated that consumption of around 1 L of water, contaminated with 50 μg/L fluoride, per day for a lifetime will cause death of 13 out of 1000 people (Smith et al. 2002). The small amount of fluoride intake is beneficial for dental caries, especially in children, whereas, excess intake of F− contaminated water will cause dental fluorosis. The presence of fluoride depends on the geological environment (Kahama et al. 1997; Harrison 2005). The elevated fluoride levels in water are found in Africa, India, and China (Yoder et al. 1998; Cao et al. 2000; Gikunju et al. 2002; Wondwossen et al. 2004; Tekle-Haimanot et al. 2006; WHO 2006). The fluoride contamination depends on many factors, such as nutrition, ingestion, and health condition, which are the important factors that are helpful to predict whether someone will be a victim of fluorosis (Nayak et al. 2009). Clinical trials revealed tooth enamel abnormalities in children and joint pain in adults along with bone deformation (limbs spine). Crippling diseases were also observed because of consumption of fluoride contamination water over a long period of time (Chakraborti et al. 2000). In the studied areas, the population has a daily intake of water containing 2.8 to 12.7 ppm fluoride since many years. Skeletal fluorosis is very among children and young.
In the present study, contaminations of F and As are found much more than 50 μg/L. Both surface and ground water were highly contaminated with fluoride and arsenic. The people of the area are highly affected with the associated diseases, such as skin cancer, fluorosis, keratosis, melanosis, and dermatosis. The pictures of the affected persons of the studied area are presented in Fig. 7a and b describing the severity of the problem.

a Dental fluorosis of the local population, b Keratosis, melanosis, and dermatitis in the local population are presented
Questioner analysis
A total of 100 people of the local population were examined for their health. There were a total of 44 children, with both boys and girls, were below age of 10, and their weight were in the range of 6–21 kg. The intake of drinking water per day was 1–11 glass. All 44 children were affected from the various discussed diseases. A group of 29 people with age limit of 10 to 20 and body weight range of 20–42 kg showed both dermatitis and fluorosis. The intake of water was in the range of 5–9 glasses of water each day. A group of 27 people with age more than 20 year and body weight range of 20–60 kg with an average intake 10–28 glasses of water per day. This group showed the prevalence of keratosis, dermatitis, and melanosis. Their body weight ranges from 44 to 116 kg.
Conclusion
The water samples for the Sibi district, Baluchistan, Pakistan, were studied for arsenic and fluoride contamination. The physicochemical parameters of the water were also evaluated to check the overall quality of the drinking water. The results were checked for its geochemical calculations and sodium absorption ratio. The statistical tools were applied to find if there is any similarity between different water samples or water of a similar type will have similar properties, such as ground water, surface water, and control water. Questioner analysis was also performed to know the degree of awareness in the local population about the metal contamination. From the results, it was found that the water of the local area, both ground and surface water, is unfit for human consumption. Among them, surface water was found to be even more contaminated than the ground water due to the chemical weathering. Geochemical parameters, such as chemical weathering and saturation index, show a high degree of contamination. Chemical weathering of sulfide, carbonate, and silicate minerals was focused to evaluate the contribution of lithogenic and anthropogenic sources for contamination of surface and ground water in the Sibi district, Balochistan, Pakistan. Water contamination with ions was attributed to both lithogenic and anthropogenic sources. The saturation index shows a high degree of saturation as the values are within 1–7 limit. The contamination was at high level observed using a saturation index. Statistical calculation revealed three types of clusters: one for ground, the other for surface water, and the control water group was separated from these two, which was further justified by the dendrogram. The correlation matrix indicates that ground water has different correlation than that of surface water, which indicates that chemical weathering plays a vital role in contamination. The pictorial presentation of the local population indicates the presence of fluoride and arsenic contamination in the drinking water, which affects the health of a local population. The needs of remedies for the area are urgently required.
References
Ahamed S, Sengupta MK, Mukherjee A, Hossain MA, Das B, Nayak B, Chatterjee G (2006) Arsenic groundwater contamination and its health effects in the state of Uttar Pradesh (UP) in upper and middle Ganga plain, India: a severe danger. Sci Total Environ 370(2):310–322
Baig JA, Kazi TG, Arain MB, Shah AQ, Sarfraz RA, Afridi HI, Kandhro GA, Jamali MK, Khan S (2009) Arsenic fractionation in sediments of different origins using BCR sequential and single extraction methods. J Hazard Mater 167(1):745–751
Brahman KD, Kazi TG, Afridi HI, Baig JA, Arain SS, Talpur FN, Kazi AG, Ali J, Panhwar AH, Arain MB (2016) Exposure of children to arsenic in drinking water in the Tharparkar region of Sindh, Pakistan. Sci Total Environ 544:653–660
Bulka CM, Jones RM, Turyk ME, Stayner LT, Argos M (2016) Arsenic in drinking water and prostate cancer in Illinois counties: an ecologic study. Environ Res 148:450–456
Cao J, Zhao Y, Liu J, Xirao R, Danzeng S (2000) Fluoride concentrations of water sources in Tibet. Fluoride 33(4):205–209
Cebrian ME, Albores A, Aguilar M, Blakely E (1983) Chronic arsenic poisoning in the north of Mexico. Hum Toxicol 2(1):121–133
Chakraborti D (2011) Arsenic: occurrence in groundwater, Encyclopedia of Environmental Health. Elsevier, Burlington, pp 165–180
Chakraborti D, Chanda CR, Samanta G, Chowdhury UK, Mukherjee SC, Pal AB et al (2000) Fluorosis in Assam, India. Curr Sci 78(12):1421–1423
Chakraborti D, Mukherjee SC, Pati S, Sengupta MK, Rahman MM, Chowdhury UK, Basu GK (2003) Arsenic groundwater contamination in Middle Ganga Plain, Bihar, India: a future danger? Environ Health Perspect 111(9):1194–1201
Chandio TA, Khan MN, Sarwar A (2015) Fluoride estimation and its correlation with other physicochemical parameters in drinking water of some areas of Balochistan, Pakistan. Environ Monit Assess 187(8):531
Chen CJ, Wang CJ (1990) Ecological correlation between arsenic level in well water and age-adjusted mortality from malignant neoplasms. Cancer Res 50(17):5470–5474
Chen CJ, Chuang YC, You SL, Lin TM, Wu HY (1986) A retrospective study on malignant neoplasms of bladder, lung and liver in blackfoot disease endemic area in Taiwan. Br. J. Cancer 53(3):399
Chen CJ, Kuo TL, Wu MM (1988) Arsenic and cancers. Lancet 1:414–415
Chen CJ, Hsueh YM, Lai MS, Shyu MP, Chen SY, Wu MM, Tai TY (1995) Increased prevalence of hypertension and long-term arsenic exposure. Hypertens. 25(1):53–60
Chen CJ, Wang SL, Chiou JM, Tseng CH, Chiou HY, Hsueh YM, Lai MS (2007a) Arsenic and diabetes and hypertension in human populations: a review. Toxicol Appl Pharmacol 222(3):298–304
Chen K, Jiao JJ, Huang J, Huang R (2007b) Multivariate statistical evaluation of trace elements in groundwater in a coastal area in Shenzhen, China. Environ Pollut 147(3):771–780
Chowdhury UK, Biswas BK, Chowdhury TR, Samanta G, Mandal BK, Basu GC et al (2000) Groundwater arsenic contamination in Bangladesh and West Bengal, India. Environ Health Perspect 108(5):393
Dang HS, Jaiswal DD, Somasundaram S (1983) Distribution of arsenic in human tissues and milk. Sci Total Environ 29(1–2):171–175
Danielsson Å, Cato I, Carman R, Rahm L (1999) Spatial clustering of metals in the sediments of the Skagerrak/Kattegat. Appl Geochem 14(6):689–706
Datta DK, Gupta LP, Subramanian V (2000) Dissolved fluoride in the lower Ganges-Brahmaputra-Meghna river system in the Bengal Basin, Bangladesh. Environ Geol 39(10):1163–1168
Engel RR, Hopenhayn-Rich C, Receveur O, Smith AH (1994) Vascular effects of chronic arsenic exposure: a review. Epidemiol Rev 16(2):184–209
Farooqi A, Masuda H, Firdous N (2007) Toxic fluoride and arsenic contaminated groundwater in the Lahore and Kasur districts, Punjab, Pakistan and possible contaminant sources. Environ Pollut 145(3):839–849
Flanagan SV, Johnston RB, Zheng Y (2012) Arsenic in tube well water in Bangladesh: health and economic impacts and implications for arsenic mitigation. Bull World Health Organ 90(11):839–846
Gikunju JK, Simiyu KW, Gathura PB, Kyule M, Kanja LW (2002) River water fluoride in Kenya. Fluoride 35(3):193–196
Gizaw B (1996) The origin of high bicarbonate and fluoride concentrations in waters of the Main Ethiopian Rift Valley, East African Rift system. J Afr Earth Sci 22(4):391–402
Harrison PT (2005) Fluoride in water: a UK perspective. J Fluor Chem 126(11):1448–1456
Harvey CF, Swartz CH, Badruzzaman ABM, Keon-Blute N, Yu W, Ali MA, Oates PM (2002) Arsenic mobility and groundwater extraction in Bangladesh. Science 298(5598):1602–1606
Hasan MA, Ahmed KM, Sracek O, Bhattacharya P, Von Broemssen M, Broms S, Jacks G (2007) Arsenic in shallow groundwater of Bangladesh: investigations from three different physiographic settings. Hydrogeol J 15(8):1507–1522
International Agency for Research on Cancer (1980) IARC monographs on the evaluation of the carcinogenic risk of chemicals to man: some metals and metallic compounds. World Health Organization, Lyon
Jacks G, Bhattacharya P, Chaudhary V, Singh KP (2005) Controls on the genesis of some high fluoride groundwaters in India. Appl Geochem 20(2):221–228
Kadono T, Inaoka T, Murayama N, Ushijima K, Nagano M, Nakamura S, Ohtsuka R (2002) Skin manifestations of arsenicosis in two villages in Bangladesh. Int J Dermatol 41(12):841–846
Kahama RW, Kariuki DN, Kariuki HN, Njenga LW (1997) Fluorosis in children and sources of fluoride around Lake Elementaita region of Kenya. Fluoride 30(1):19–25
Kazi TG, Arain MB, Jamali MK, Jalbani N, Afridi HI, Sarfraz RA, Baig JA, Shah AQ (2009) Assessment of water quality of polluted lake using multivariate statistical techniques: a case study. Ecotoxicol Environ Saf 72(2):301–309
Kundu N, Panigrahi M, Tripathy S, Munshi S, Powell MA, Hart B (2001) Geochemical appraisal of fluoride contamination of groundwater in the Nayagarh District of Orissa, India. Environ Geol 41(3):451–460
Lopez PL, Auque LF, Garces I, Chong W (1999) Geochemical characteristics and pattern of evolution of salmueras superficiales del Salar de Llamara, Chile Brines surface of Salar Llamara, Chile. Geol Mag Chile 26:89–108
Mandal BK, Suzuki KT (2002) Arsenic round the world: a review. Talanta 58(1):201–235
McCaffrey LP, Willis JP (2001) Distribution of fluoride-rich groundwater in the eastern and Mogwase regions of the Northern and North-West Provinces. Water Research Commission
Meybeck M (1987) Global chemical weathering of surficial rocks estimated from river dissolved loads. Am J Sci 287(5):401–428
Mukherjee SC, Saha KC, Pati S, Dutta RN, Rahman MM, Sengupta MK et al (2005) Murshidabad—one of the nine groundwater arsenic-affected districts of West Bengal, India. Part II: dermatological, neurological, and obstetric findings. Clin Toxicol 43(7):835–848
Nayak B, Roy MM, Chakraborti D (2009) Dental fluorosis. Clin Toxicol 47(4):355–355
Rafique T, Naseem S, Bhanger MI, Usmani TH (2008) Fluoride ion contamination in the groundwater of Mithi sub-district, the Thar Desert, Pakistan. Environ Geol 56(2):317–326
Rafique T, Naseem S, Usmani TH, Bashir E, Khan FA, Bhanger MI (2009) Geochemical factors controlling the occurrence of high fluoride groundwater in the Nagar Parkar area, Sindh, Pakistan. J Hazard Mater 171(1):424–430
Rahman MM, Chowdhury UK, Mukherjee SC, Mondal BK, Paul K, Lodh D et al (2001) Chronic arsenic toxicity in Bangladesh and West Bengal, India—a review and commentary. J Toxicol Clin Toxicol 39(7):683–700
Sarma DRR, Rao SLN (1997) Fluoride concentrations in ground waters of Visakhapatnam, India. Bull Environ Contam Toxicol 58(2):241–247
Saxena V, Ahmed S (2003) Inferring the chemical parameters for the dissolution of fluoride in groundwater. Environ Geol 43(6):731–736
Smith AH, Hopenhayn-Rich C, Bates MN, Goeden HM, Hertz-Picciotto I, Duggan HM, Smith MT (1992) Cancer risks from arsenic in drinking water. Environ Health Perspect 97:259–267
Smith AH, Lopipero PA, Bates MN, Steinmaus CM (2002) Arsenic epidemiology and drinking water standards. Science 296(5576):2145–2146
Sreedevi PD, Ahmed S, Madé B, Ledoux E, Gandolfi JM (2006) Association of hydrogeological factors in temporal variations of fluoride concentration in a crystalline aquifer in India. Environ Geol 50(1):1–11
Tekle-Haimanot R, Melaku Z, Kloos H, Reimann C, Fantaye W, Zerihun L, Bjorvatn K (2006) The geographic distribution of fluoride in surface and groundwater in Ethiopia with an emphasis on the Rift Valley. Sci Total Environ 367(1):182–190
Tseng WP (1977) Effects and dose-response relationships of skin cancer and blackfoot disease with arsenic. Environ Health Perspect 19:109–119
Tseng WP, Chu H, How SW, Fong JM, Lin CS, Yeh SHU (1968) Prevalence of skin cancer in an endemic area of chronic arsenicism in Taiwan 2. J Natl Cancer Inst 40(3):453–463
Valenzuela-Vasquez L, Ramirez-Hernandez J, Reyes-Lopez J, Sol-Uribe A, Lazaro-Mancilla O (2006) The origin of fluoride in groundwater supply to Hermosillo City, Sonora, Mexico. Environ Geol 51(1):17–27
Villalobos M, Trotz MA, Leckie JO (2001) Surface complexation modeling of carbonate effects on the adsorption of Cr (VI), Pb (II), and U (VI) on goethite. Environ Sci Technol 35(19):3849–3856
Wang CH, Hsiao CK, Chen CL, Hsu LI, Chiou HY, Chen SY, Hsueh YM, Wu MM, Chen CJ (2007) A review of the epidemiologic literature on the role of environmental arsenic exposure and cardiovascular diseases. Toxicol Appl Pharmacol 222(3):315–326
WHO (2017) Guidelines for drinking-water quality: fourth edition incorporating the first addendum. World Health Organization, Geneva Retrieved from https://apps.who.int/iris/ handle/10665/254637 (Licence: CC BY-NC-SA 3.0 IGO). Accessed May 2017
Wondwossen F, Åstrøm AN, Bjorvatn K, Bårdsen A (2004) The relationship between dental caries and dental fluorosis in areas with moderate- and high-fluoride drinking water in Ethiopia. Community Dent Oral Epidemiol 32(5):337–344
World Health Organisation (2006) Fluorides in drinking-water. In: Bailey K, Chilton J, Dahi E, Lennon M, Jackson P, Fawell J (eds) WHO drinking-water quality series. IWA Publishing, London
Yamauchi H, Yamamura Y (1983) Concentration and chemical species of arsenic in human tissue. Bull Environ Contam Toxicol 31(3):267–270
Yoder KM, Mabelya L, Robison VA, Dunipace AJ, Brizendine EJ, Stookey GK (1998) Severe dental fluorosis in a Tanzanian population consuming water with negligible fluoride concentration. Community Dent Oral Epidemiol 26(6):382–393
Zaldívar R (1974) Arsenic contamination of drinking water and foodstuffs causing endemic chronic poisoning. Beitr Pathol 151(4):384–400
Author information
Authors and Affiliations
Corresponding author
Additional information
Responsible Editor: Lotfi Aleya
Publisher’s note
Springer Nature remains neutral with regard to jurisdictional claims in published maps and institutional affiliations.
Rights and permissions
About this article
Cite this article
Chandio, T.A., Khan, M.N., Muhammad, M.T. et al. Fluoride and arsenic contamination in drinking water due to mining activities and its impact on local area population. Environ Sci Pollut Res 28, 2355–2368 (2021). https://doi.org/10.1007/s11356-020-10575-9
Received:
Accepted:
Published:
Issue date:
DOI: https://doi.org/10.1007/s11356-020-10575-9