Abstract
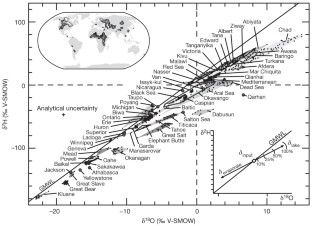
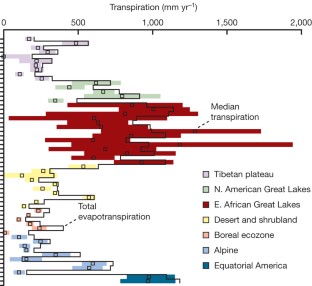
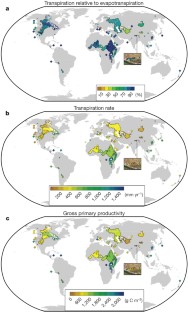
Renewable fresh water over continents has input from precipitation and losses to the atmosphere through evaporation and transpiration. Global-scale estimates of transpiration from climate models are poorly constrained owing to large uncertainties in stomatal conductance and the lack of catchment-scale measurements required for model calibration, resulting in a range of predictions spanning 20 to 65 per cent of total terrestrial evapotranspiration (14,000 to 41,000 km3 per year) (refs 1, 2, 3, 4, 5). Here we use the distinct isotope effects of transpiration and evaporation to show that transpiration is by far the largest water flux from Earth’s continents, representing 80 to 90 per cent of terrestrial evapotranspiration. On the basis of our analysis of a global data set of large lakes and rivers, we conclude that transpiration recycles 62,000 ± 8,000 km3 of water per year to the atmosphere, using half of all solar energy absorbed by land surfaces in the process. We also calculate CO2 uptake by terrestrial vegetation by connecting transpiration losses to carbon assimilation using water-use efficiency ratios of plants, and show the global gross primary productivity to be 129 ± 32 gigatonnes of carbon per year, which agrees, within the uncertainty, with previous estimates6. The dominance of transpiration water fluxes in continental evapotranspiration suggests that, from the point of view of water resource forecasting, climate model development should prioritize improvements in simulations of biological fluxes rather than physical (evaporation) fluxes.
This is a preview of subscription content, access via your institution
Access options
Subscribe to this journal
Receive 51 print issues and online access
$199.00 per year
only $3.90 per issue
Buy this article
- Purchase on SpringerLink
- Instant access to full article PDF
Prices may be subject to local taxes which are calculated during checkout
References
Lawrence, D. M., Thornton, P. E., Oleson, K. W. & Bonan, G. B. Partitioning of evaporation into transpiration, soil evaporation, and canopy evaporation in a GCM: impacts on land-atmosphere interaction. J. Hydrometeorol. 8, 862–880 (2007)
Alton, P., Fisher, R., Los, S. & Williams, M. Simulations of global evapotranspiration using semiempirical and mechanistic schemes of plant hydrology. Glob. Biogeochem. Cycles 23, GB4023 (2009)
Cao, L., Bala, G., Caldeira, K., Nemani, R. & Ban-Weiss, G. Importance of carbon dioxide physiological forcing to future climate change. Proc. Natl Acad. Sci. USA 107, 9513–9518 (2010)
Ito, A. & Motoko, I. Water-use efficiency of the terrestrial biosphere: a model analysis focusing on interactions between the global carbon and water cycles. J. Hydrometeorol. 13, 681–694 (2012)
Gerten, D. et al. Contemporary “green” water flows: simulations with a dynamic global vegetation and water balance model. Phys. Chem. Earth 30, 334–338 (2005)
Beer, C. et al. Terrestrial gross carbon dioxide uptake: global distribution and covariation with climate. Science 329, 834–838 (2010)
Dai, A. & Trenberth, K. E. Estimates of freshwater discharge from continents: latitudinal and seasonal variations. J. Hydrometeorol. 3, 660–687 (2002)
Yakir, D. & Wang, X. F. Fluxes of CO2 and water between terrestrial vegetation and the atmosphere estimated from isotope measurements. Nature 380, 515–517 (1996)
Williams, D. et al. Evapotranspiration components determined by stable isotope, sap flow and eddy covariance techniques. Agric. For. Meteorol. 125, 241–258 (2004)
Dawson, T. E. Determining water use by trees and forests from isotopic, energy balance and transpiration analyses: the roles of tree size and hydraulic lift. Tree Physiol. 16, 263–272 (1996)
Welp, L. R. et al. δ18O of water vapor, evapotranspiration and the sites of leaf water evaporation in a soybean canopy. Plant Cell Environ. 31, 1214–1228 (2008)
Rozanski, K., Araguas-Araguas, L. & Gonfiantini, R. in Climate Change in Continental Isotopic Records (eds Swart, P. K. et al.) 1–36 (Am. Geophys. Union, 1993)
Horita, J. & Wesolowski, D. Liquid-vapour fractionation of oxygen and hydrogen isotopes of water from the freezing to the critical temperature. Geochim. Cosmochim. Acta 58, 3425–3437 (1994)
Craig, H. & Gordon, L. I. in Stable Isotopes in Oceanographic Studies and Paleotemperatures (ed. Tongiorgi, E. ) 9–130 (Lab. Geol. Nucl., 1965)
Bowen, G. J. & Revenaugh, J. Interpolating the isotopic composition of modern meteoric precipitation. Wat. Resour. Res. 39, 1299 (2003)
Miralles, D. G., Gash, J. H., Holmes, T. R. H., de Jeu, R. A. M. & Dolman, A. J. Global canopy interception from satellite observations. J. Geophys. Res. 115, D16122 (2010)
New, M., Lister, D., Hulme, M. & Makin, I. A high-resolution data set of surface climate over global land areas. Clim. Res. 21, 1–25 (2002)
Yoshimura, K., Kanamitsu, M., Noone, D. & Oki, T. Historical isotope simulation using reanalysis atmospheric data. J. Geophys. Res. 113, D19108 (2008)
Reynolds, J. F., Kemp, P. R. & Tenhunen, J. D. Effects of long-term rainfall variability on evapotranspiration and soil water distribution in the Chihuahuan desert: a modeling analysis. Plant Ecol. 150, 145–159 (2000)
Downing, J. A. et al. The global abundance and size distribution of lakes, ponds, and impoundments. Limnol. Oceanogr. 51, 2388–2397 (2006)
Trenberth, K. E., Fasullo, J. T. & Kiehl, J. Earth’s global energy budget. Bull. Am. Meteorol. Soc. 90, 311–323 (2009)
Beer, C., Reichstein, M., Ciais, P., Farquhar, G. D. & Papale, D. Mean annual GPP of Europe derived from its water balance. Geophys. Res. Lett. 34, L05401 (2007)
Farquhar, G. D., Ehleringer, J. R. & Hubick, K. T. Carbon isotope discrimination and photosynthesis. Annu. Rev. Plant Physiol. Plant Mol. Biol. 40, 503–537 (1989)
Jung, M. et al. Recent decline in the global land evapotranspiration trend due to limited moisture supply. Nature 467, 951–954 (2010)
Durack, P. J., Wijffels, S. E. & Matear, R. J. Ocean salinities reveal strong global water cycle intensification during 1950 to 2000. Science 336, 455–458 (2012)
Gibson, J. J., Birks, S. J. & Edwards, T. W. D. Global prediction of δA and δ2H-δ18O evaporation slopes for lakes and soil water accounting for seasonality. Glob. Biogeochem. Cycles 22, GB2031 (2008)
Gonfiantini, R. in Handbook of Environmental Isotope Geochemistry Vol. 2: The Terrestrial Environment (eds Fritz, P. & Fontes, J.-Ch. ) 113–163 (Elsevier, 1986)
Buck, A. L. New equations for computing vapour pressure and enhancement factor. J. Appl. Meteorol. 20, 1527–1532 (1981)
Hijmans, R. J., Cameron, S. E., Parra, J. L., Jones, P. G. & Jarvis, A. Very high resolution interpolated climate surfaces for global land areas. Int. J. Climatol. 25, 1965–1978 (2005)
Global Energy and Water Cycle Experiment. International Satellite Land-Surface Climatology Project. http://www.gewex.org/islscpdata.htm (2012)
Acknowledgements
We thank T. W. D. Edwards, T. Gleeson and M. C. Molles Jr for comments on the manuscript, and are grateful to O. Kwiecien, D. G. Miralles, B. K. Nyarko, K. Yoshimura and F. Yuan for providing access to isotope and gridded data sets. Support for this work was provided by a graduate fellowship awarded to S.J. by the Caswell Silver Foundation through the University of New Mexico.
Author information
Authors and Affiliations
Contributions
S.J. designed the study, compiled each data set, did the geographic information system and remote sensing work, developed the equations, did the water balance and carbon flux calculations, and wrote the paper. Z.D.S., J.J.G., S.J.B., Y.Y. and P.J.F. discussed the results, commented on the manuscript and contributed to text.
Corresponding author
Ethics declarations
Competing interests
The authors declare no competing financial interests.
Supplementary information
Supplementary Information
This file contains Supplementary Text, Supplementary Figures 1-6 Supplementary Tables 1-6 and Supplementary References. (PDF 1378 kb)
Supplementary Data
This file contains a tabulated dataset of δ18O and δ2H values (V-SMOW standard reference) for large lakes. (XLS 221 kb)
Rights and permissions
About this article
Cite this article
Jasechko, S., Sharp, Z., Gibson, J. et al. Terrestrial water fluxes dominated by transpiration. Nature 496, 347–350 (2013). https://doi.org/10.1038/nature11983
Received:
Accepted:
Published:
Issue date:
DOI: https://doi.org/10.1038/nature11983
This article is cited by
-
Tracing hydrological, lithological and geothermal sources of Himalayan river system: a case study from the Teesta River Basin
Environmental Earth Sciences (2024)
-
Validation of selected gridded potential evapotranspiration datasets with ground-based observations over the Ogun-Osun River Basin, Nigeria
Arabian Journal of Geosciences (2024)
-
Polarization-based underwater geolocalization with deep learning
eLight (2023)
-
Evapotranspiration on a greening Earth
Nature Reviews Earth & Environment (2023)
-
A maize epimerase modulates cell wall synthesis and glycosylation during stomatal morphogenesis
Nature Communications (2023)


Caroline McLean
Posted on behalf of Jan Veizer et al.
Water Transpiration and the Carbon Cycle.
Jan Veizera, Johannes A.C. Barthb, Kristal D. Duboisa, Paul Fergusonc, Heiko Freitaga, Ajaz Karimd, Kevin Telmere & Leonard I. Wassenaarf
Arising from: S. Jasechko et al. Nature doi:10.1038 nature11983 (2013).
In a recent publication dealing with the global water cycle, Jasechko et al.1 claimed that "linkages made here between the water and carbon cycles highlight a new stable isotope based methodology that can be used to monitor and map ongoing changes to the Earth's water cycle as well as modification to carbon assimilation rates under increased atmospheric temperature and CO2 concentrations". This study is an emulation, conceptually and methodically, of earlier publications on large riverine watersheds (2-6 and publications therein), selectively applied to basins of large lakes. Because the authors failed to credit these earlier publications, they also failed to appreciate that biological coupling of the water and carbon cycles via photosynthesis has a dual, tropical and extratropical pattern a duality clearly reflected in data for precipitation (P) versus net primary productivity (NPP) amassed empirically for ecosystems across the globe7. This is important because future scenarios arising from this duality may have implications that differ from those posited by Jasechko et al.1.
A collation for tropical ecosystems4 plots as a broad band below a plateau at about 1200 g C m-2 a-1, independent of P. In the extratropics, on the other hand, the NPP clearly declines with lower rainfall, whereas the correlations with air temperature are marginal at best3. This dual pattern is mirrored4 by the almost thousand times larger water transpiration flux (T), an outcome of plant water utilization efficiency (WUE) that is in the 102 range. Supplementary factors, such as nutrient or CO2 fertilizations, likely act as superimposed phenomena operating within the broad bands of these trends, but themselves cannot be responsible for the overall global NPP pattern because atmospheric CO2 concentrations, for example, are mostly comparable across the planet.
The annual global photosynthesis/respiration flux of C, of about 120 Pg 8, is essentially a reflection of biological activity in the tropics where it is driven by the photosynthetically active solar radiation (PAR)9. The theoretical upper limit for biological transformation of solar light energy (photons) to chemical energy is 11%, but natural ecosystems operate mostly with 3-6% efficiency10. While the ecosystems strive to optimize their efficiency towards the theoretical plateau, the level of the plateau itself is set up by the incident solar radiation. Enhanced PAR will result in elevation of the NPP plateau, the invigoration of global evaporation and precipitation, and the enhanced transfer of moisture towards the higher latitudes. Visually, the entire pattern (figure 14 of Ferguson and Veizer4) will shift up and to the right. A decline in PAR results in an opposite shift. The coupled water – carbon system thus oscillates hand in hand with solar activity.
As pointed out by Jasechko et al.1, the flux T appropriates about half of all solar energy absorbed by the continents. Yet, the efficiency of photosynthesis is only some 3-6%. The bulk of this energy is therefore required not for the photosynthesis itself, but for the continuous pumping of water that delivers food (nutrients) to the plant. No water, no food, no life, no biological carbon cycle! Potentially, this may change our perspective on the role that biology plays in the water cycle. In such perspective, the global water cycle is the medium that redistributes the incoming solar energy across the planet, and the anatomical structures of plants then help to optimize the loop of energy transfer via evaporation and precipitation in the hydrologic cycle.
1. Jasechko, S. et al. Terrestrial water fluxes dominated by transpiration. Nature doi:10.1038 nature11983 (2013).
2. Telmer, K. & Veizer, J. Isotopic constraints on the transpiration, evaporation, energy and gross primary production budget of large boreal watershed: Ottawa River basin, Canada. Global Biogeochem. Cycles 14, 149-165 (2000).
3. Lee, D. & Veizer, J. Water and carbon cycles in the Mississippi River basin: Potential implications for the Northern Hemisphere residual terrestrial sink. Global Biogeochem. Cycles 17, doi:10.1029 2002GB001984 (2003).
4. Ferguson, P. & Veizer, J. The coupling of water and carbon fluxes via the terrestrial biosphere and its significance to the Earth's climate system. J. Geophys. Res. - Atm. 112, D24S06, doi:10.1029 2007JD00843 (2007).
5. Barth, J.A.C. et al. Water fluxes and their control on the terrestrial carbon balance: Results from a stable isotope study on the Clyde Watershed (Scotland). Appl. Geochem. 22, 2684-2694 (2007).
6. Schulte, P. et al. Application of stable water and carbon isotopes in watershed research: weathering, carbon cycling and water balances. Earth Sci. Reviews 109, 20-31 (2011).
7. Zheng, D., Prince, S. & Wright, R. Terrestrial net primary production estimates for 0.5 grid cells from field observations - a contribution to global biogeochemical modeling, Glob. Change Biol. 9, 46-64 (2003).
8. Denman, K.L. et al. Couplings between changes in climate system and biogeochemistry, in Climate Change 2007: The Physical Scientific Basis: Contribution of Working I to the Fourth Assessment Report of the Intergovernmental Panel on Climate Change (eds Solomon, S.D. et al.) 501-587 (Cambridge University Press, 2007).
9. Myneni, R. B., et al. Large seasonal swings in leaf area of Amazon rainforests. Proc. Natl. Acad. Sci. U.S.A. 104, 4820-4823 (2007).
10. Miyamoto, K. Renewable biological systems for alternative sustainable energy production. FAO Agricultural Service Bull. 128, 1010-1365 (1997).
a Department of Earth Sciences, University of Ottawa, Ottawa, Canada K1N 6N5,
[email protected]
b GeoZentrum Nordbayern, Friedrich-Alexander-Universit�t Erlangen-N�rnberg
Schlossgarten 5, D- 91054 Erlangen, Germany, [email protected]
c Robertson GeoConsultants Inc., Suite 900 – 580 Hornby Street, Vancouver, Canada V6C 3B6, [email protected]
d Chinook Consulting Services, 742 Memorial Drive NW, Calgary, Canada T2N 3C7, [email protected]
e School of Earth and Ocean Sciences, University of Victoria, Victoria, Canada V8P 5C2, [email protected]
f Environment Canada, 11 Innovation Blvd., Saskatoon, Canada S7N 3H5, [email protected]
Scott Jasechko
We thank Veizer and co-authors for their online comment. Our methodology is dissimilar to theirs because we explicitly calculated the isotopic composition of transpired moisture (deep and shallow roots), we used a whole-catchment water balance (rather than equations designed for lake water balances used by Veizer et al. from Gonfiantini, 1986), and we developed water use efficiencies based upon climate data; the latter resulting in water use efficiencies in line with experimental data (globally, 3.2?±?0.9?mmol CO2 per mol H2O; Table S6 in our paper) and ~2x different than those quoted by Veizer et al. (0.8-1.1 mmol CO2 per mol H2O for C3, 1.6-2.4 mmol CO2 per mol H2O for C4). We invite interested readers to examine the equations presented in our paper (Eqns. 1-3) and those by Veizer et al. to see the differences in the methodologies. We feel we have properly credited earlier works that pioneered the partitioning of evapotranspiration using stable O and H isotopes (e.g., Refs. 8-11, 56 in our paper). We also thank Veizer et al. for pointing out that photosynthesis has a dual tropical and extratropical pattern although consideration of this is not an essential part of our methodology or results.
Gonfiantini, R. in Handbook of Environmental Isotope Geochemistry Vol. 2: The Terrestrial Environment (eds Fritz, P. & Fontes, J.-Ch.) 113?163 (Elsevier, 1986)
Daniel R. Schlaepfer
The Jasechko et al. paper draws very timely attention to an extremely important topic, i.e., the partitioning of evapotranspiration into component processes. We were quite excited about its publication. However, after careful consideration of Jasechko?s approach we felt the main conclusions drawn in the paper are based on invalid or unsubstantiated assumptions about: 1) the origin of evaporative signals in lakes; 2) isotope exchange processes and isotope mass balance of terrestrial surfaces; and 3) the spatial integration of these catchment signals in lakes. Together, the assumptions behind the work in Jasechko et al. lead to a large over-estimation of global T/ET, the critical parameter reported in the paper. We offer new data in our recently published comment in Ecosphere (Schlaepfer et al. 2014 ) demonstrating that lakes do not consistently record catchment-scale evaporation and transpiration isotope signals and that transpiration is not the only non-fractionating isotopic process with significant water loss to the atmosphere. Based on our data, we demonstrate that the global estimate of T/ET reported by Jasechko et al. is grossly over-estimated.
Daniel R Schlaepfer1, Brent E Ewers1,2, Bryan N Shuman2,3, David G Williams1,2,4, John M Frank1,2,5, William J Massman5, and William K Lauenroth1.2
-----
1 University of Wyoming, Botany Department, Laramie, WY 82071, USA.
2 University of Wyoming, Program in Ecology, Laramie, WY 82071, USA.
3 University of Wyoming, Department of Geology & Geophysics, Laramie, WY 82071, USA.
4 University of Wyoming, Department of Ecosystem Science & Management, Laramie, WY 82071, USA.
5 United States Forest Service, Rocky Mountain Research Station, Fort Collins, CO 80526, USA
-----
Schlaepfer, DR, Ewers, BE, Shuman, BN, Williams, DG, Frank, JM, Massman, WJ & Lauenroth, WK (2014) Terrestrial water fluxes dominated by transpiration: Comment. Ecosphere, 5, 61 (doi: 10.1890/ES13-00391.1 )