Pine Script v6 has just been released and whether you have never created a TradingView indicator before or you are a Pinemaster, there’s something in here for everyone.

Let’s start by exploring the upgrade and new features, then we’ll jump into writing some code using the latest version of the world’s most popular financial charting language.
👉 http://jamesbachini.com/out/tradingview.php 👀
🔍 What’s New in Pine Script v6?
Pine Script v6 introduces several quality improvements, performance upgrades, and some long awaited features that improve how indicators behave and interact with chart data.
This isn’t a complete overhaul of the language, it’s a significant step forward in terms of usability and efficiency.
✨ Key Improvements:
- Dynamic
request.*functions You can now dynamically specify symbols and resolutions inside therequest.security()function, which means more flexible multi-symbol strategies and dynamic input handling. - Bool logic booleans, which are true/false values, can no longer be na, not available. They must evaluate to true or false. This is a stricter format which should prevent unintended values getting through as false.
- Performance enhancements Improvements in how the compiler and runtime execute code allow for more efficient execution across scripts. Conditional branches like
ifstatements now only compute what is needed using “lazy evaluation”. This leads to cleaner code and performance boosts, especially in complex logic trees.
📜 Example: A Clean & Modern v6 Indicator
Lets walk through a real world example, ideal for both beginners getting started and pros looking to see what has changed.
My experience is in crypto markets (for my sins) and there is a company called Microstrategy that is buying tens of Billions dollars worth of Bitcoin. Microstrategy has the ability to influence Bitcoin’s price and the stock price of Microstrategy is influenced by Bitcoin.
Generally I would expect prices of the assets to be quite correlated by I want an indicator that looks for divergences.
//@version=6
indicator("BTC vs MSTR Divergence", overlay=true)

// Inputs
mstrSymbol = input.symbol("NASDAQ:MSTR", "MicroStrategy Symbol")
compareTf  = input.timeframe("D", "Comparison Timeframe")
smoothing  = input.int(30, "Normalization Window", minval=1)
threshold  = input.int(30000)

// Data Retrieval
btc = close
mstr = request.security(mstrSymbol, compareTf, close)

// Normalize Prices
btcLow  = ta.lowest(btc, smoothing)
btcHigh = ta.highest(btc, smoothing)
mstrLow = ta.lowest(mstr, smoothing)
mstrHigh= ta.highest(mstr, smoothing)
btcNorm  = ((btc - btcLow) / (btcHigh - btcLow)) * 2 * btc
mstrNorm = ((mstr - mstrLow) / (mstrHigh - mstrLow)) * 2 * btc

// Calculate Divergence
divergence = btcNorm - mstrNorm
isDiverging = math.abs(divergence) > threshold
plot(math.abs(divergence), title="math.abs(divergence)", color=color.rgb(223, 214, 43), linewidth=5)

// Highlight Divergence Areas
bgcolor(isDiverging ? color.new(color.purple, 85) : na, title="Strong Divergence")

// Plot Normalized Prices
plot(btcNorm, title="BTC Normalized", color=color.rgb(11, 137, 0), linewidth=2)
plot(mstrNorm, title="MSTR Normalized", color=color.rgb(176, 39, 39), linewidth=2)

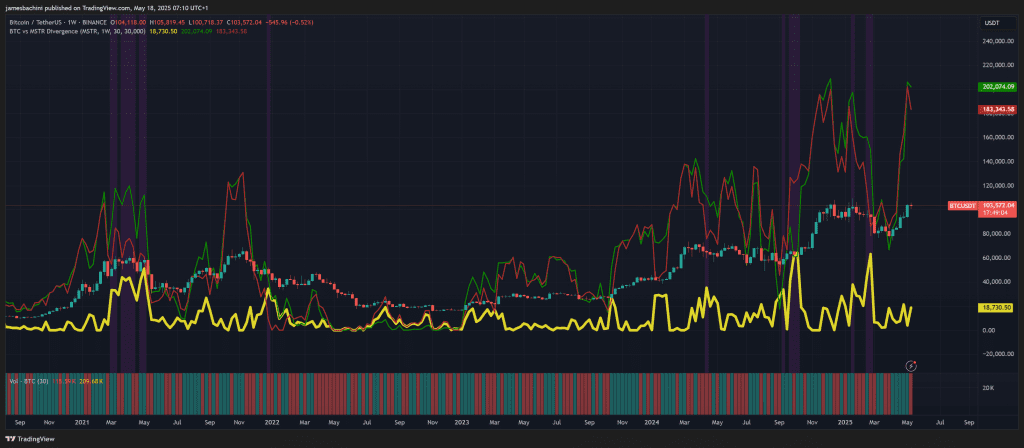
The green line is the normalized Bitcoin price, the red line is Microstrategy. The bars are the underlying real Bitcoin price and the yellow line is the divergence. Areas of high divergence are highlighted in purple.
Interestingly it got out of line in 2021 which was a market cycle top and then we’ve seen it again more recently. Something to keep an eye on perhaps.
Pine Script v6 doesn’t reinvent the wheel, but it definitely smooths the ride. The update removes some long standing pain points and opens the door for more dynamic, customizable indicators and strategies.
If you have v5 scripts there is an upgrade tool on the site which let’s you upgrade the logic automatically to v6.
If you’re new, this is the best time to get started, things are cleaner and simpler than ever. So get started and start searching the charts for little bits of alpha.


