NYC Subway Ridership Starts to Climb as Cuomo Cites “Good News” on Virus Numbers
With New York City and State in a State of Emergency and the State on PAUSE, it’s no secret that the city has seen a drastic decrease in subway ridership - down about 93% year over year at its lowest point.
The drop has largely been sustained, as you can see by this graph of daily year over year ridership changes since early March:
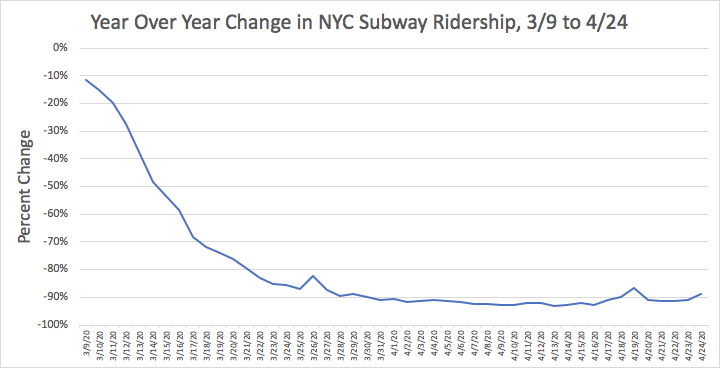
The decline is striking, and subway ridership, as of this past Friday April 24th- the last day data is available - is still very much down. You might notice two bumps on this chart, but those are caused by unusually low ridership on some weekend days in 2019 (probably due to construction), and so the relative drop in 2020 appears less extreme on those days.
So lets instead look at this same data with just pure weekly ridership numbers, and not worry about what happened last year. Here I plot the average daily ridership over the last seven days measured on any given day:
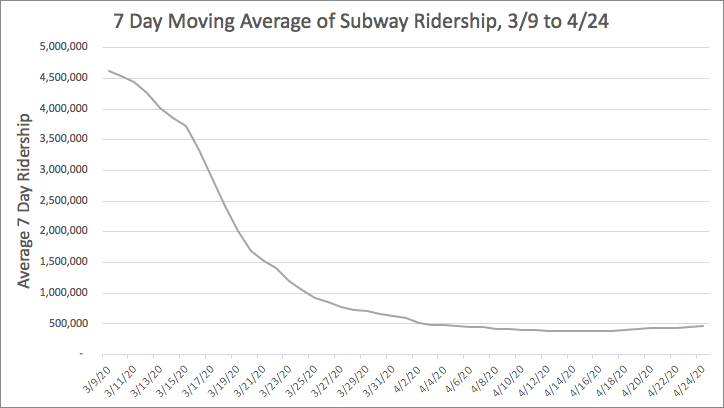
The bumps are gone. But there is something else striking. It’s hard to see here, but the chart actually bottomed out on April 17th. After that, ridership seems to be climbing through April 24th - the last day we have data. The tick upward may seem small when you look at it compared to normal ridership, but by plotting this same data as a week over week percent change in average daily ridership, we can see how things are changing more easily:

Grey bars mean that less people rode the subway on an average day over the last 7 days than the previous 7 days before that. Red means the opposite. And where do we top out - the last day for which we have data - Friday April 24th. The climb is actually quite striking if you think about it in terms of rides taken. During the 7 days ending on Friday April 17th, over 2.7 million rides were taken. Over the following 7 days ending on April 24th, the number climbed to 3.2 million rides. That is roughly a 17% increase in ridership over the last week compared to the previous one, making up almost 500,000 additional rides over that time. When it comes to reducing the spread of a virus, 500,000 rides is not trivial.
So why might the ridership be creeping up without any regulatory changes made by the government? Part of it may be that people are starting to get stir crazy and the weather is slowly getting nicer. But it’s scary to think that a nearly 20% ridership change can happen in a week without any official reopening. Given that, imagine what even a limited reopen might bring in terms of subway usage.
Another possibility for the uptick is that on Saturday, April 18th - the very first day of a week over week increase (the first red bar) - Governor Cuomo said in his daily virus briefing: “If you look at the past three days you could argue that we are past the plateau and are starting to descend, which would be very good news.” The New York Times headline for the article covering that day’s briefing read: “New York Governor Sounds Optimistic Note as Coronavirus Numbers Improve”. Many New Yorkers are tracking the virus carefully, and positive sounding statements from politicians could likely lead more people to feel comfortable heading outside.
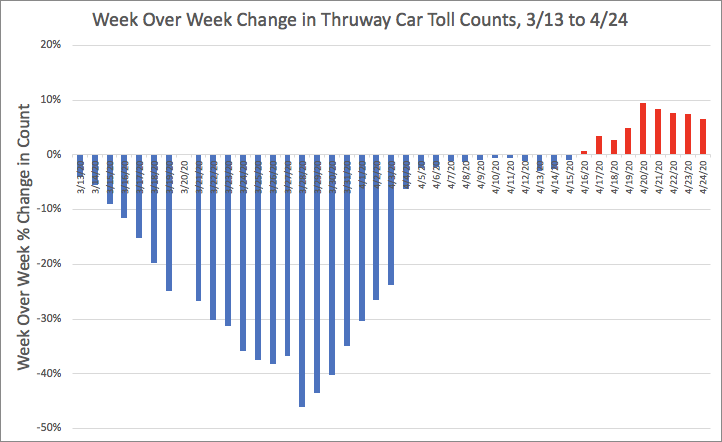
I should point out that it’s not just those in New York City that are starting to venture out more. New York State Thruway Toll data, filtered for cars, shows an uptick over roughly the same period of time, first turning positive on April 16th.
Possibly sensing the shift in behavior, during Saturday’s briefing, Cuomo pointed out his daughter said “I can’t do this anymore,” and made the point that those who are sacrificing are doing that for a noble reason, saving over a hundred thousand lives. Even so, in the same briefing he said it was encouraging that we are “back to where we were 21 days ago” in terms of hospitalizations, likely without realizing that he could have also been referring to subway ridership. This plot shows the last 21 days of that:

Let’s just hope that trend on the right side does not continue ahead of any regulatory changes, since if increased ridership leads to more illness - and I don’t see how it wouldn’t - then it could slow down the pace at which we could reopen the city.
Notes:
-Subway Ridership data here.
-Ridership numbers includes a handful of PATH stations which are in the data as well.
-NY State Thruway data is oddly missing March 20th.