
- >>Climate table // Weather by Month Forlì
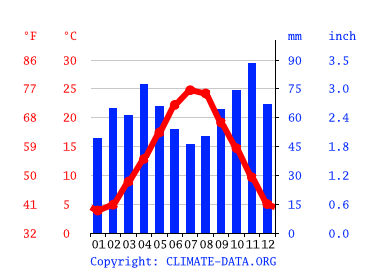
- >>Climograph Forlì
- >>average temperature by month Forlì
- >>Weather Forlì
Forlì are in the northern hemisphere. Summer begins at the end of June and ends in September. The months of summer are: June, July, August, September. The most opportune time to visit are June, July, August.
The Forlì is the Capital of Province of Forlì-Cesena
Climograph Forlì


In July, the precipitation level plummets to a mere 46 mm | 1.8 inch. This month holds the title for being exceptionally arid. Most precipitation falls in November, with an average of 88 mm | 3.5 inch.
average temperature by month Forlì

The month of highest temperature is July during which the average temperature reaches up to 24.8 °C | 76.6 °F. In January, the average temperature is 3.9 °C | 39.0 °F. It is the lowest average temperature of the whole year.
Climate table // Weather by Month Forlì
| Avg. Temperature °C (°F) | Min. Temperature °C (°F) | Max. Temperature °C (°F) | Precipitation / Rainfall mm (in) | Humidity (%) | Rainy days (d) | avg. Sun hours (hours) | |
|---|---|---|---|---|---|---|---|
| January |
3.9 (39) |
0.1 (32.2) |
8.4 (47.2) |
49 (1.9) |
82% | 5 | 5.0 |
| February |
4.9 (40.8) |
0.3 (32.6) |
9.9 (49.9) |
65 (2.6) |
77% | 5 | 6.0 |
| March |
8.9 (48.1) |
3.7 (38.6) |
14.2 (57.6) |
61 (2.4) |
72% | 6 | 8.0 |
| April |
12.8 (55.1) |
7.2 (45) |
18.1 (64.6) |
77 (3) |
70% | 8 | 10.0 |
| May |
17.4 (63.4) |
11.5 (52.6) |
22.7 (72.9) |
66 (2.6) |
65% | 6 | 12.0 |
| June |
22.2 (72) |
15.9 (60.6) |
27.7 (81.9) |
54 (2.1) |
59% | 5 | 13.0 |
| July |
24.8 (76.6) |
18.4 (65.1) |
30.4 (86.6) |
46 (1.8) |
54% | 4 | 13.0 |
| August |
24.2 (75.5) |
18.1 (64.6) |
29.9 (85.9) |
50 (2) |
58% | 5 | 12.0 |
| September |
19.2 (66.5) |
14 (57.2) |
24.4 (75.9) |
64 (2.5) |
67% | 6 | 9.0 |
| October |
14.7 (58.5) |
10.4 (50.7) |
19.5 (67.1) |
74 (2.9) |
77% | 7 | 6.0 |
| November |
9.7 (49.4) |
6 (42.7) |
13.9 (56.9) |
88 (3.5) |
82% | 8 | 5.0 |
| December |
5 (41) |
1.3 (34.3) |
9.3 (48.8) |
67 (2.6) |
83% | 8 | 5.0 |
| January | February | March | April | May | June | July | August | September | October | November | December | |
|---|---|---|---|---|---|---|---|---|---|---|---|---|
| Avg. Temperature °C (°F) |
3.9 °C (39) °F |
4.9 °C (40.8) °F |
8.9 °C (48.1) °F |
12.8 °C (55.1) °F |
17.4 °C (63.4) °F |
22.2 °C (72) °F |
24.8 °C (76.6) °F |
24.2 °C (75.5) °F |
19.2 °C (66.5) °F |
14.7 °C (58.5) °F |
9.7 °C (49.4) °F |
5 °C (41) °F |
| Min. Temperature °C (°F) |
0.1 °C (32.2) °F |
0.3 °C (32.6) °F |
3.7 °C (38.6) °F |
7.2 °C (45) °F |
11.5 °C (52.6) °F |
15.9 °C (60.6) °F |
18.4 °C (65.1) °F |
18.1 °C (64.6) °F |
14 °C (57.2) °F |
10.4 °C (50.7) °F |
6 °C (42.7) °F |
1.3 °C (34.3) °F |
| Max. Temperature °C (°F) |
8.4 °C (47.2) °F |
9.9 °C (49.9) °F |
14.2 °C (57.6) °F |
18.1 °C (64.6) °F |
22.7 °C (72.9) °F |
27.7 °C (81.9) °F |
30.4 °C (86.6) °F |
29.9 °C (85.9) °F |
24.4 °C (75.9) °F |
19.5 °C (67.1) °F |
13.9 °C (56.9) °F |
9.3 °C (48.8) °F |
| Precipitation / Rainfall mm (in) |
49 (1) |
65 (2) |
61 (2) |
77 (3) |
66 (2) |
54 (2) |
46 (1) |
50 (1) |
64 (2) |
74 (2) |
88 (3) |
67 (2) |
| Humidity(%) | 82% | 77% | 72% | 70% | 65% | 59% | 54% | 58% | 67% | 77% | 82% | 83% |
| Rainy days (d) | 5 | 6 | 6 | 7 | 6 | 5 | 5 | 5 | 6 | 7 | 8 | 7 |
| avg. Sun hours (hours) | 5.1 | 6.2 | 8.1 | 9.6 | 11.5 | 12.7 | 12.7 | 11.5 | 9.5 | 6.5 | 5.4 | 5.1 |
Data: 1991 - 2021 Min. Temperature °C (°F), Max. Temperature °C (°F), Precipitation / Rainfall mm (in), Humidity, Rainy days. Data: 1999 - 2019: avg. Sun hours
The precipitation variance between the months with the lowest and highest levels of rainfall is 42 mm | 2 inch. The average temperatures vary during the year by 20.9 °C | 37.6 °F.
The month with the highest relative humidity is December (83.02 ). The month with the lowest relative humidity is July (54.13 ). The month with the highest number of rainy days is November (10.00 days). The month with the lowest number of rainy days is July (6.20 days).
Forlì weather and climate for every month
Hours of sunshine in Forlì
- avg. hours of sun
- Total hours of sun


In Forlì, the month with the most daily hours of sunshine is July with an average of 12.72 hours of sunshine. In total there are 394.35 hours of sunshine throughout July.
The month with the fewest daily hours of sunshine in Forlì is January with an average of 5.1 hours of sunshine a day. In total there are 158.04 hours of sunshine in January.
Around 3163.3 hours of sunshine are counted in Forlì throughout the year. On average there are 263.61 hours of sunshine per month.
Airport close to Forlì
The closest Airports of Forlì are: Bologna Guglielmo Marconi Airport (BLQ) 68.51km,Florence Airport, Peretola (FLR) 81.77km,Perugia San Francesco d'Assisi – Umbria International Airport (PEG) 123.92km
You can reach Forlì from this Cities by Plane: London (LCY), Copenhagen (CPH), Vienna (VIE), Paris (ORY), Birmingham (BHX), Edinburgh (EDI), Lyon (LYS), Cologne (CGN), Oslo (RYG), Alicante (ALC), Málaga (AGP), Porto (OPO), Casablanca (CMN), Stockholm (ARN), Nantes (NTE), Frankfurt am Main (FRA), Tunis (TUN), Santa Cruz de Tenerife (TFS), Cluj-Napoca (CLJ), Geneva (GVA)