- >>Climate table // Weather by Month Noida
- >>Climograph Noida
- >>average temperature by month Noida
- >>Weather Noida
Noida is in the northern hemisphere. -> It is situated in the upper half of the planet. Summer begins at the end of June and ends in September. The months of summer are: June, July, August, September. It is highly recommended to plan your visit during the months of March, October for an optimal experience.
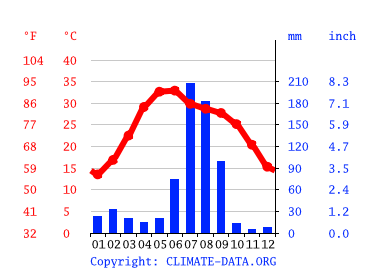
Climograph Noida


The month with the least amount of precipitation is November exhibiting a mere 5 mm | 0.2 inch rainfall. The majority of rainfall occurs during the month with the highest precipitation, which is July, and has an average amount of 208 mm | 8.2 inch.
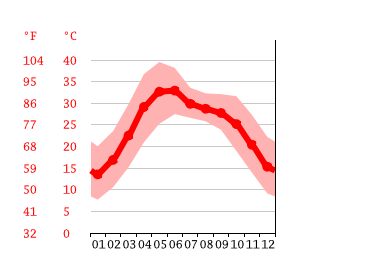
average temperature by month Noida

The month of June boasts the highest average temperature, with a recorded maximum of 32.9 °C | 91.3 °F. During the month of January, the mean temperature registers at a minimum value of 13.5 °C | 56.4 °F. This represents the coldest monthly average throughout the entire year.
Climate table // Weather by Month Noida
| Avg. Temperature °C (°F) | Min. Temperature °C (°F) | Max. Temperature °C (°F) | Precipitation / Rainfall mm (in) | Humidity (%) | Rainy days (d) | avg. Sun hours (hours) | |
|---|---|---|---|---|---|---|---|
| January |
13.5 (56.4) |
7.7 (45.9) |
20.1 (68.1) |
23 (0.9) |
68% | 2 | 8.0 |
| February |
16.9 (62.4) |
10.6 (51) |
23.6 (74.4) |
33 (1.3) |
62% | 3 | 9.0 |
| March |
22.5 (72.6) |
15.2 (59.3) |
29.8 (85.7) |
20 (0.8) |
48% | 2 | 11.0 |
| April |
29.1 (84.5) |
21 (69.7) |
36.7 (98.1) |
14 (0.6) |
29% | 2 | 12.0 |
| May |
32.7 (90.8) |
25.3 (77.5) |
39.5 (103.2) |
20 (0.8) |
32% | 4 | 12.0 |
| June |
32.9 (91.3) |
27.5 (81.5) |
38.2 (100.7) |
74 (2.9) |
47% | 8 | 12.0 |
| July |
29.9 (85.8) |
26.6 (79.9) |
33.6 (92.5) |
208 (8.2) |
72% | 15 | 9.0 |
| August |
28.7 (83.7) |
25.8 (78.5) |
32.3 (90.1) |
183 (7.2) |
78% | 15 | 9.0 |
| September |
27.7 (81.9) |
23.9 (74.9) |
32.1 (89.8) |
99 (3.9) |
73% | 8 | 9.0 |
| October |
25.2 (77.3) |
18.9 (66.1) |
31.6 (88.9) |
13 (0.5) |
58% | 2 | 10.0 |
| November |
20.4 (68.7) |
14 (57.2) |
27.3 (81.2) |
5 (0.2) |
55% | 1 | 10.0 |
| December |
15.3 (59.6) |
9.2 (48.5) |
22.2 (72) |
8 (0.3) |
62% | 1 | 9.0 |
| January | February | March | April | May | June | July | August | September | October | November | December | |
|---|---|---|---|---|---|---|---|---|---|---|---|---|
| Avg. Temperature °C (°F) |
13.5 °C (56.4) °F |
16.9 °C (62.4) °F |
22.5 °C (72.6) °F |
29.1 °C (84.5) °F |
32.7 °C (90.8) °F |
32.9 °C (91.3) °F |
29.9 °C (85.8) °F |
28.7 °C (83.7) °F |
27.7 °C (81.9) °F |
25.2 °C (77.3) °F |
20.4 °C (68.7) °F |
15.3 °C (59.6) °F |
| Min. Temperature °C (°F) |
7.7 °C (45.9) °F |
10.6 °C (51) °F |
15.2 °C (59.3) °F |
21 °C (69.7) °F |
25.3 °C (77.5) °F |
27.5 °C (81.5) °F |
26.6 °C (79.9) °F |
25.8 °C (78.5) °F |
23.9 °C (74.9) °F |
18.9 °C (66.1) °F |
14 °C (57.2) °F |
9.2 °C (48.5) °F |
| Max. Temperature °C (°F) |
20.1 °C (68.1) °F |
23.6 °C (74.4) °F |
29.8 °C (85.7) °F |
36.7 °C (98.1) °F |
39.5 °C (103.2) °F |
38.2 °C (100.7) °F |
33.6 °C (92.5) °F |
32.3 °C (90.1) °F |
32.1 °C (89.8) °F |
31.6 °C (88.9) °F |
27.3 °C (81.2) °F |
22.2 °C (72) °F |
| Precipitation / Rainfall mm (in) |
23 (0) |
33 (1) |
20 (0) |
14 (0) |
20 (0) |
74 (2) |
208 (8) |
183 (7) |
99 (3) |
13 (0) |
5 (0) |
8 (0) |
| Humidity(%) | 68% | 62% | 48% | 29% | 32% | 47% | 72% | 78% | 73% | 58% | 55% | 62% |
| Rainy days (d) | 2 | 3 | 3 | 3 | 4 | 7 | 15 | 15 | 8 | 2 | 1 | 1 |
| avg. Sun hours (hours) | 8.2 | 9.4 | 10.6 | 11.5 | 12.1 | 11.8 | 9.5 | 9.0 | 9.3 | 10.1 | 9.6 | 8.8 |
Data: 1991 - 2021 Min. Temperature °C (°F), Max. Temperature °C (°F), Precipitation / Rainfall mm (in), Humidity, Rainy days. Data: 1999 - 2019: avg. Sun hours
There is a notable variation in precipitation levels between the driest and wettest months, amounting to 203 mm | 8 inch. Throughout the year, there is a fluctuation in average temperatures by 19.4 °C | 34.9 °F.
The month of highest relative humidity is August (77.96 ). The month with the lowest relative humidity is April (29.24). The month which sees the most rainfall is August (1.10 days). The driest month of the year is December (19.93 days).
Noida weather and climate for every month
Hours of sunshine in Noida
- avg. hours of sun
- Total hours of sun


In Noida, the month with the most daily hours of sunshine is May with an average of 12.11 hours of sunshine. In total there are 375.38 hours of sunshine throughout May.
The month exhibiting the least number of daily sunshine hours in Noida is January, presenting an average of only 8.84 hours per day. The total accumulation of sunlight during this period amounts to approximately 273.93.
Around 3643.54 hours of sunshine are counted in Noida throughout the year. On average there are 303.63 hours of sunshine per month.
Airport close to Noida
The closest Airports of Noida are: Indira Gandhi International Airport (DEL) 24.86km,Jolly Grant Airport (DED) 204.75km,Chandigarh Airport (IXC) 239.88km
You can reach Noida from this Cities by Plane: London (LHR), Sydney (SYD), Mumbai (BOM), New Delhi (DEL), Pune (PNQ), Lahore (LHE), Paris (CDG), Birmingham (BHX), Beijing (PEK), Almaty (ALA), Frankfurt am Main (FRA), Tashkent (TAS), Dushanbe (DYU), Addis Abeba (ADD), Nairobi (NBO), Dubai (DXB), Manama (BAH), Colombo (CMB), New York (JFK), Kathmandu (KTM)