

ABSTRACT
We introduce SPARC (Spitzer Photometry and Accurate Rotation Curves): a sample of 175 nearby galaxies with new surface photometry at 3.6 μm and high-quality rotation curves from previous H i/Hα studies. SPARC spans a broad range of morphologies (S0 to Irr), luminosities (∼5 dex), and surface brightnesses (∼4 dex). We derive [3.6] surface photometry and study structural relations of stellar and gas disks. We find that both the stellar mass–H i mass relation and the stellar radius–H i radius relation have significant intrinsic scatter, while the H i mass–radius relation is extremely tight. We build detailed mass models and quantify the ratio of baryonic to observed velocity (Vbar/Vobs) for different characteristic radii and values of the stellar mass-to-light ratio (ϒ⋆) at [3.6]. Assuming ϒ⋆ ≃ 0.5 M⊙/L⊙ (as suggested by stellar population models), we find that (i) the gas fraction linearly correlates with total luminosity; (ii) the transition from star-dominated to gas-dominated galaxies roughly corresponds to the transition from spiral galaxies to dwarf irregulars, in line with density wave theory; and (iii) Vbar/Vobs varies with luminosity and surface brightness: high-mass, high-surface-brightness galaxies are nearly maximal, while low-mass, low-surface-brightness galaxies are submaximal. These basic properties are lost for low values of ϒ⋆ ≃ 0.2 M⊙/L⊙ as suggested by the DiskMass survey. The mean maximum-disk limit in bright galaxies is ϒ⋆ ≃ 0.7 M⊙/L⊙ at [3.6]. The SPARC data are publicly available and represent an ideal test bed for models of galaxy formation.
1. INTRODUCTION
The study of rotation curves has played a key role in our understanding of the mass distribution in galaxies (e.g., Rubin et al. 1978; Bosma 1981; van Albada et al. 1985). Atomic hydrogen (H i) is one of the best kinematical tracers of the gravitational potential in nearby galaxies for two basic reasons:
- 1.H i gas is dynamically cold and follows nearly circular orbits; hence, it directly traces the gravitational potential. The H i velocity dispersion is typically of ∼10 km s−1, so pressure support becomes significant only in very low mass galaxies with rotation velocities of ∼20 km s−1 (e.g., Lelli et al. 2012b). Strong assumptions about the velocity tensor, which are necessary in studies of stellar kinematics, are not required in H i studies.
- 2.H i gas is diffuse and extends well beyond the galaxy stellar component; hence, the gravitational potential can be traced up to several effective radii, where dark matter (DM) is expected to dominate.
Studies of H i rotation curves, however, have been historically limited to small galaxy samples because they are significantly time costly: they require interferometric H i observations and careful modeling of 3D data sets.
The mass modeling of galaxies is generally plagued by the “disk–halo degeneracy” (van Albada et al. 1985): the relative contributions of stellar disk and DM halo to the observed rotation curve are strongly degenerate due to uncertainties in the stellar mass-to-light ratio (ϒ⋆). More generally, this should be called “star–halo degeneracy” because it also applies to bulge-dominated spirals (e.g., Noordermeer 2006) and elliptical galaxies (e.g., Oguri et al. 2014). To minimize the star–halo degeneracy, the best approach is to use near-infrared (NIR) surface photometry (K band or 3.6 μm), which provides the closest proxy to the stellar mass (e.g., Verheijen 2001). Stellar population synthesis (SPS) models suggest that ϒ⋆ displays much smaller variations in the NIR than in optical bands and depends weakly on the star formation history of the galaxy. Several models actually predict that ϒ⋆ is nearly constant in the NIR over a broad range of galaxy masses and morphologies (e.g., Bell & de Jong 2001; Portinari et al. 2004; McGaugh & Schombert 2014; Meidt et al. 2014; Schombert & McGaugh 2014a). The overall normalization of ϒ⋆, however, is still uncertain up to a factor of ∼3 due to differences in the SPS models (such as the treatment of asymptotic giant branch stars) and in the assumed stellar initial mass function (IMF). These issues are described in detail in Section 5.1.
To advance our understanding of the mass distribution in galaxies, we have built SPARC (Spitzer Photometry and Accurate Rotation Curves): a sample of 175 galaxies with new surface photometry at 3.6 μm and extended H i rotation curves from the literature. For ∼1/3 of SPARC galaxies, we also have Hα rotation curves from long-slit spectroscopy, integral field units (IFUs), and Fabry–Perot interferometry, probing the inner regions at high spatial resolutions. Contrary to previous samples, SPARC spans very broad ranges in luminosity, surface brightness, rotation velocity, and Hubble type, forming a representative sample of disk galaxies in the nearby universe. To date, this is the largest collection of galaxies with both high-quality rotation curves and NIR surface photometry.
The SPARC data will be explored in a series of papers and are available online at astroweb.cwru.edu/SPARC. Preliminary SPARC data have already been used in several publications: (i) Lelli et al. (2016) study the baryonic Tully–Fisher relation (BTFR); (ii) Di Cintio & Lelli (2016) investigate the mass discrepancy–acceleration relation in a ΛCDM context; and (iii) Katz et al. (2016) fit different DM halo profiles to the SPARC rotation curves. In this paper, we present the galaxy sample (Section 2), derive surface photometry at 3.6 μm (Section 3.1), describe the collection of H i/Hα rotation curves (Section 3.2), build mass models (Section 3.3), study stellar and H i scaling relations (Section 4), and finally investigate gas fractions (Section 5.2) and the degree of baryonic maximality (Section 5.3) for different values of ϒ⋆.
2. GALAXY SAMPLE
We collected more than 200 extended H i rotation curves from previous compilations, large surveys, and individual studies (see Section 3.2 for details). This kinematic data set is the result of ∼30 yr of interferometric H i observations using the Westerbork Synthesis Radio Telescope (WSRT), Very Large Array (VLA), Australia Telescope Compact Array (ATCA), and Giant Metrewave Radio Telescope (GMRT). Subsequently, we searched the Spitzer archive and found useful [3.6] images for 175 galaxies. Most of these objects are part of the Spitzer Survey for Stellar Structure in Galaxies (S4G; Sheth et al. 2010). We also used [3.6] images from Schombert & McGaugh (2014b) for low-surface-brightness (LSB) galaxies, which are usually underrepresented in optical catalogs with respect to high-surface-brightness (HSB) spirals (e.g., McGaugh et al. 1995a). SPARC is not a statistically complete or volume-limited sample, but it forms a representative sample of disk galaxies in the nearby universe spanning the widest possible range of properties for galaxies with extended rotation curves.
Table 1. Galaxy Sample
| Name | T | D | Met. | i | L[3.6] | Reff | Σeff | Rd | Σd | MH i | RH i | Vf | Q | References |
|---|---|---|---|---|---|---|---|---|---|---|---|---|---|---|
| (Mpc) | (deg) | (109 L⊙) | (kpc) | (L⊙ pc−2) | (kpc) | (L⊙ pc−2) | (109 M⊙) | (kpc) | (km s−1) | |||||
| (1) | (2) | (3) | (4) | (5) | (6) | (7) | (8) | (9) | (10) | (11) | (12) | (13) | (14) | (15) |
| CamB | 10 | 3.36 ± 0.26 | 2 | 65 ± 5 | 0.075 ± 0.003 | 1.21 | 7.9 | 0.47 | 66.2 | 0.016 | ⋯ | ⋯ | 2 | 1 |
| D512-2 | 10 | 15.20 ± 4.56 | 1 | 56 ± 10 | 0.325 ± 0.022 | 2.37 | 9.2 | 1.24 | 93.9 | 0.108 | ⋯ | ⋯ | 3 | 2 |
| D564-8 | 10 | 8.79 ± 0.28 | 2 | 63 ± 7 | 0.033 ± 0.004 | 0.72 | 10.1 | 0.45 | 30.8 | 0.039 | ⋯ | ⋯ | 3 | 2 |
| D631-7 | 10 | 7.72 ± 0.18 | 2 | 59 ± 3 | 0.196 ± 0.009 | 1.22 | 20.9 | 0.70 | 115.0 | 0.385 | ⋯ | 57.7 ± 2.7 | 1 | 2, 3 |
Note.
Table 1 lists the main properties of SPARC galaxies.
References for H i and Hα data: (1) Begum et al. 2003; (2) Trachternach et al. 2009; (3) de Blok et al. 2001.
Only a portion of this table is shown here to demonstrate its form and content. A machine-readable version of the full table is available.
Download table as: DataTypeset image
Table 1 lists the main properties of SPARC galaxies.
Column (1) gives the galaxy name.
Column (2) gives the numerical Hubble type from de Vaucouleurs et al. (1991), Schombert et al. (1992), or NED3 adopting the following scheme: 0 = S0, 1 = Sa, 2 = Sab, 3 = Sb, 4 = Sbc, 5 = Sc, 6 = Scd, 7 = Sd, 8 = Sdm, 9 = Sm, 10 = Im, 11 = BCD.
Column (3) gives the assumed distance (see Section 2.2).
Column (4) gives the distance method: 1 = Hubble flow, 2 = tip of the red giant branch, 3 = Cepheids, 4 = Ursa Major cluster of galaxies, 5 = supernovae.
Column (5) gives the assumed inclination angle (i).
Column (6) gives the total luminosity at 3.6 μm (L[3.6]).
Column (7) gives the effective radius (Reff) encompassing half of the total luminosity.
Column (8) gives the effective surface brightness (Σeff).
Column (9) gives the scale length of the stellar disk (Rd).
Column (10) gives the extrapolated central surface brightness of the stellar disk (Σd).
Column (11) gives the total H i mass (MHi).
Column (12) gives the H i radius (RHi) where the H i surface density (corrected to face-on) reaches 1 M⊙ pc−2.
Column (13) gives the velocity along the flat part of the rotation curve (Vf) derived as in Lelli et al. (2016).
Column (14) gives the rotation-curve quality flag (Q): 1 = high, 2 = medium, 3 = low. See Section 3.2 for details.
Column (15) gives the reference for the H i data.
Inclination angles are typically derived by fitting a tilted-ring model to the H i velocity fields (Begeman 1987) and considering systematic variations with radius (warps): column (5) provides the mean value of i in the outer parts of the H i disk. In some cases, H i velocity fields are not adequate to properly trace the run of i with radius; hence, the inclination is fixed to the optical value (e.g., de Blok et al. 1996). The derivation of photometric properties (columns (6)–(10)) is described in Section 3.1.
2.1. General Properties
The overall properties of SPARC galaxies are shown with histograms in Figure 1. SPARC spans a broad range in morphologies (S0 to Im/BCD), luminosities (∼107 to ∼1012 L⊙), effective radii (∼0.3 to ∼15 kpc), effective surface brightnesses (∼5 to ∼5000 L⊙ pc−2), rotation velocities (∼20 to ∼300 km s−2), and gas content (0.01 ≲ MH i /L[3.6] ≲ 10). Galaxies with 1010 < L[3.6]/L⊙ < 1010.5 are slightly underrepresented (in a volume-weighted sense): apparently H i studies have tended to focus on bright spirals and dwarf galaxies. As expected, SPARC does not contain galaxies with L[3.6] > 1012 L⊙, which typically are gas-poor ellipticals in clusters, nor does it contain galaxies with L[3.6] < 107 L⊙, for which our knowledge is restricted to gas-poor spheroidals around the Milky Way and M31.
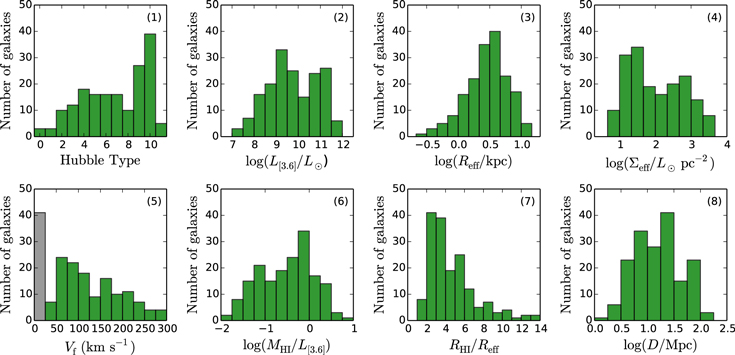
Figure 1. Overall properties of SPARC galaxies: (1) numerical Hubble type; (2) total [3.6] luminosity; (3) effective [3.6] surface brightness; (4) effective radius; (5) velocity along the flat part of the rotation curve; we assign Vf = 0 to rotation curves that do not reach a flat part within ∼5% (gray bin); (6) ratio of H i mass to [3.6] luminosity; (7) ratio of H i radius to effective radius; (8) assumed distance.
Download figure:
Standard image High-resolution imageMost galaxies in SPARC have late Hubble types (9–10), corresponding to Sm and Im galaxies. This happens because the Hubble classification is intrinsically biased toward HSB features and assigns most LSB galaxies within these two latest stages (McGaugh et al. 1995b). Currently, the SPARC data set contains only three lenticulars because early-type galaxies generally lack a high-density H i disk and have been historically neglected by interferometric H i studies. Recent surveys, however, show that several early-type galaxies in the group and field environments possess an outer low-density H i disk (Serra et al. 2012), which can be used for kinematic investigations (den Heijer et al. 2015).
The ratio RH i/Reff varies from ∼1 to ∼14 (panel 8 of Figure 1). Clearly, the H i rotation curve probes the gravitational potential out to much larger radii than existing IFU surveys like CALIFA (García-Lorenzo et al. 2015) or MANGA (Bundy et al. 2015). Historically, the relative extent of H i to stellar disks has been measured using either RH i/R25, where R25 is the B-band isophotal radius at 25 mag arcsec−2 (Broeils & Rhee 1997; Noordermeer et al. 2005), or RH i/R⋆, where R⋆ = 3.2Rd (Swaters et al. 2009; Lelli et al. 2014). The latter definition allows for comparing stellar disks with different central surface brightnesses: a pure exponential disk with Σd = 21.5 B mag arcsec−2 (Freeman 1970) has R⋆ = R25. We find  with a median value of 1.7. This is in line with previous estimates of
  for different galaxy types: 1.7 ± 0.7 (Noordermeer et al. 2005) for early-type galaxies (S0 to Sab), 1.7 ± 0.5 (Broeils & Rhee 1997) for spiral galaxies (mostly Sb to Scd), 1.8 ± 0.8 (Swaters et al. 2009) for late-type dwarfs (Sd to Im), and 1.7 ± 0.5 (Lelli et al. 2014) for starburst dwarfs (Im and BCD). Martinsson et al. (2016), however, find RH i /R25 = 1.35 ± 0.22 for 28 late-type spirals. We note that SPARC galaxies are representative of the disk population in the field, nearby groups, and diffuse clusters like Ursa Major (Tully & Verheijen 1997). Galaxies in dense clusters like Virgo may show smaller values of RH i/R⋆ due to gas stripping (e.g., Chung et al. 2009).
2.2. Galaxy Distances
The galaxies in SPARC can be classified in three main groups depending on the distance estimate.
I. Accurate Distances: 50 objects have distances from the tip of the red giant branch (45), Cepheids (3), or supernovae (2). These distances have errors ranging from ∼5% to ∼10% and are generally on the same zero-point scale (see discussion in Tully et al. 2013). The vast majority of these distances are drawn from the Extragalactic Distance Database (Jacobs et al. 2009; Tully et al. 2013).
II. Ursa Major: 28 objects lie in the Ursa Major cluster (Verheijen & Sancisi 2001), which has an average distance of 18 ± 0.9 Mpc (Sorce et al. 2013b). This explains the peak at log(D/Mpc) ≃ 1.25 in panel 10 of Figure 1. The Ursa Major cluster has an estimated depth of ∼2.3 Mpc (Verheijen 2001); hence, we adopt an error of  Mpc for individual galaxies. Two galaxies from Verheijen (2001) are considered as background/foreground objects: NGC 3992, having D ≃ 24 Mpc from a Type Ia supernova (Parodi et al. 2000), and UGC 6446, lying near the cluster boundary in both space and velocity (D ≃ 12 Mpc from the Hubble flow).
III. Hubble Flow: 97 objects have Hubble-flow distances corrected for Virgocentric infall (taken from NED). We assume H0 = 73 km s−1 Mpc−1, giving distances on a similar zero-point scale as those in groups I and II (e.g., Tully et al. 2013). Hubble-flow distances are very uncertain for nearby galaxies, where peculiar velocities may strongly contribute to the systemic velocities, but become more accurate for distant objects. We adopt the following error scheme: 30% for D ≤ 20 Mpc, 25% for 20 Mpc < D ≤ 40 Mpc, 20% for 40 Mpc < D ≤ 60 Mpc, 15% for 60 Mpc < D ≤ 80 Mpc, and 10% for D > 80 Mpc. This scheme considers that peculiar velocities can be as high as ∼500 km s−1 and H0 has an uncertainty of ∼7%. Lelli et al. (2016) show that the intrinsic scatter in the BTFR for galaxies in groups I+II is similar to that for the entire sample, indicating that the assumed errors on Hubble-flow distances are realistic.
3. DATA COLLECTION AND ANALYSIS
3.1. Surface Photometry
For the 175 galaxies in SPARC, we derived homogeneous surface photometry at 3.6 μm following the procedures of Schombert & McGaugh (2014b). The frames were flat-fielded and calibrated using the standard Spitzer pipeline. Subsequently, they were interactively cleaned by masking bright contaminating sources, like foreground stars and background galaxies. This is a crucial step because [3.6] images contain nearly 10 times more point sources than similar exposures in optical bands. Masked pixels were subsequently replaced with the local mean isophotal value for aperture luminosity determination.
The cleaned frames were analyzed using the Archangel software (Schombert 2011). The absolute sky value and its error were estimated using multiple sky boxes, i.e., regions in the frame that are free of background/foreground objects. The standard Spitzer pipeline provides a formal zero-point error smaller than 2%, but a more realistic photometric error should also consider the sky brightness error, which dominates all other sources of uncertainty in the surface photometry and aperture magnitudes (Schombert & McGaugh 2014b). The mean error on sky brightness is ∼3%.
To derive azimuthally averaged surface brighntess profiles, we fitted ellipses to the frames using a standard Fourier-series least-square algorithm. During the ellipse fitting, pixels with values above 3σ of the mean isophote were automatically masked and replaced with the mean value at that radius. These pixels typically correspond to unresolved background/foreground objects, but we visually inspected each frame to ensure that real asymmetric features in the galaxy (like prominent spiral arms or H ii regions) were not removed. Most low-mass and LSB galaxies have irregular morphologies; hence, ellipses only provide a zeroth-order apporximation of their shape. The errors in the surface brightness profiles, however, are dominated by the uncertainties in the sky value rather than variations around each ellipse. For thin, egde-on galaxies, ellipse fitting does not provide satisfactory results in the central regions; hence, we derived surface brightness profiles considering a narrow circular section around the semimajor axes and average both sides.
To estimate aperture magnitudes, we built curves of growth by summing both raw and replaced pixels within the best-fit ellipse at a given radius (subpixels are used at the ellipse edges). The amount of light from replaced pixels varies from 2% to 15%. Summing pixels generally leads to unstable curves of growth at large radii, where the galaxy surface brightness is comparable to the contaminating halos of imperfectly masked sources. Hence, we replaced the aperture values with the mean isophotal values at large radii (beyond the radius containing ∼90% of the raw luminosity). This provides curves of growth that approach a clear asymptotic value at large radii. We calculated total magnitudes using asymptotic fits to the curves of growth. Corresponding errors were estimated by recalculating the total magnitudes using a 1σ variation in the sky value. Total luminosities assume a solar absolute magnitude of 3.24 at 3.6 μm (Oh et al. 2008). We also calculated the effective radius (Reff), i.e., the radius encompassing half of the total luminosity, and the effective surface brightness (Σeff), i.e., the average surface brightness within Reff.
To estimate the disk scale length (Rd) and central surface brightness (μd), we fitted exponential functions to the outer parts of the surface brightness profiles. We stress that the results depend on the fitted radial range, which may be ambiguous for galaxies with outer down-bending (type II) or up-bending (type III) profiles (see Erwin et al. 2008). For most low-mass and LSB galaxies, exponential functions provide a good description of the surface brightness profiles over a broad radial range, but several galaxies show light enhancements/depressions in the inner parts (similar to optical bands; e.g., Swaters & Balcells 2002; Schombert et al. 2011). As expected, the vast majority of spiral galaxies show deviations from exponential profiles in the inner parts due to bulges, bars, and lenses. All surface brightness profiles are available for download at astroweb.cwru.edu/SPARC.
3.2. Rotation Curves
The majority (∼75%) of SPARC rotation curves are the result of Ph.D. theses from the University of Groningen (Begeman 1987; Broeils 1992; de Blok 1997; Verheijen 1997; Swaters 1999; Noordermeer 2006; Lelli 2013). They were derived using similar techniques and software, forming a relatively homogeneous data set. These 175 rotation curves are drawn from the following publications (in parentheses we provide the corresponding number of objects excluding duplicates): Swaters et al. (2009; 32), Sanders & Verheijen (1998; 30), Sanders (1996; 17), Noordermeer et al. (2007; 12), de Blok et al. (2001; 10), Begeman et al. (1991; 9), Lelli et al. (2012a, 2012b, 2014; 8), de Blok & Bosma (2002; 7), de Blok et al. (1996; 7), Kuzio de Naray et al. (2008; 6), Spekkens & Giovanelli (2006; 5), Gentile et al. (2004, 2007; 4), van Zee et al. (1997; 4), Côté et al. (2000; 3), Fraternali et al. (2002, 2011; 3), Hallenbeck et al. (2014; 2), Trachternach et al. (2009; 2), Barbieri et al. (2005; 1), Battaglia et al. (2006; 1), Begum et al. (2003; 1), Begum & Chengalur (2004; 1), Blais-Ouellette et al. (2004; 1), Boomsma et al. (2008; 1), Chemin et al. (2006; 1), Elson et al. (2010; 1), Kepley et al. (2007; 1), Richards et al. (2015; 1), Simon et al. (2003; 1), Verdes-Montenegro et al. (1997; 1), Verheijen & de Blok (1999; 1), and Walsh et al. (1997; 1). For duplicate galaxies, we select the most reliable rotation curve. Table 1 provides the reference for each galaxy.
We do not consider rotation curves from THINGS (de Blok et al. 2008) and LITTLE-THINGS (Oh et al. 2015) for the sake of homogeneity. These rotation curves are characterized by many small-scale bumps and wiggles that are not observed in other rotation curve samples. Most likely these small-scale features do not trace the smooth, axisymmetric gravitational potential, but may be due to noncircular components like streaming motions along spiral arms (e.g., Khoperskov & Bertin 2015). SPARC rotation curves are generally smooth but can show large-scale features with a direct correspondence in the surface brightness profile, in agreement with Renzo’s rule (Sancisi 2004): “For any feature in the luminosity profile there is a corresponding feature in the rotation curve and vice versa.”
3.2.1. Beam-smearing Effects and Hybrid Rotation Curves
The inner parts of rotation curves are a key tool to distinguish between cuspy and cored DM profiles (e.g., de Blok et al. 2001, 2008; Gentile et al. 2004), but they must be derived with great care because the limited spatial resolution may lead to a systematic underestimate of the inner rotation velocities (the so-called beam-smearing effects; see, e.g., Swaters et al. 2009). Several techniques have been developed to take beam-smearing effects into account: (i) projecting the derived rotation curves onto position–velocity diagrams and correcting the inner velocity points by visual inspection (e.g., Begeman 1987; de Blok et al. 1996; Verheijen & Sancisi 2001), and (ii) building 3D disk models and comparing model cubes with observed cubes (e.g., Swaters et al. 2009; Lelli et al. 2010). We carefully checked each rotation curve and conclude that beam smearing does not play a major role. For only a few galaxies, the innermost points were perhaps affected by beam smearing and have been rejected.
For 56 galaxies (∼1/3 of SPARC), we have hybrid rotation curves combining Hα data in the inner regions with H i data in the outer parts. Hα rotation curves trace the kinematics at high spatial resolutions (∼1″); hence, beam-smearing effects are minimal. Hybrid rotation curves were derived using Hα IFU observations (seven objects from Kuzio de Naray et al. 2008; Richards et al. 2015) and long-slit spectroscopy (41 objects from Roelfsema & Allen 1985; Walsh et al. 1997; Côté et al. 2000; de Blok et al. 2001; de Blok & Bosma 2002; Gentile et al. 2004; Spekkens & Giovanelli 2006; Noordermeer et al. 2007). The raw Hα data are typically fit with a spline to derive smooth rotation curves (de Blok et al. 2001; de Blok & Bosma 2002; Noordermeer et al. 2007), which average over small-scale irregularities and trace the overall gravitational potential. We built another eight hybrid rotation curves using Hα data from Fabry–Perot interferometry (Blais-Ouellette et al. 1999, 2001, 2004; Daigle et al. 2006; Dicaire et al. 2008). Apart from a few cases (notably NGC 24), H i and Hα rotation curves are generally in good agreement, indicating that the former were properly determined (see also McGaugh et al. 2001; Swaters et al. 2009). The rotation curve of NGC 2976 combines Hα and CO data (Simon et al. 2003).
Despite the high spatial resolution, Hα rotation curves are sometimes quite uncertain due to the patchy distribution and complex kinematics of Hα gas, especially for low-mass and LSB galaxies. We use only H i data for the several objects: DDO 154, IC 2574, NGC 3109, NGC 5033, NGC 5055, NGC 6946, NGC 7331, and UGC 2259. H i and Hα rotation curves, however, agree within the errors.
3.2.2. Error Budget and Rotation Curve Quality
The errors on the rotation velocities are estimated as in Swaters et al. (2009):

where Vapp and Vrec are the rotation velocities obtained from fitting separately the approaching and receding sides of the disk, respectively, and  is the formal error from fitting the entire disk. We consider only velocity points that are derived from both sides of the disk. Equation (1) considers both local deviations from circular motions and global kinematic asymmetries between the two sides of the disk. It does not include, however, systematic errors due to the assumed inclination. If the H i disk is not strongly warped, a change in i would change the normalization of the rotation curve without altering its shape. Inclination corrections go as sin(i); thus, they are small for edge-on galaxies but become large for face-on ones.
We assign a quality flag (Q) to each rotation curve using the following scheme: Q = 1 for galaxies with high-quality H i data or hybrid Hα/H i rotation curves (99 objects); Q = 2 for galaxies with minor asymmetries and/or H i data of lower quality (64 objects); Q = 3 for galaxies with major asymmetries, strong noncircular motions, and/or offsets between H i and stellar distributions (12 objects). Galaxies with Q = 3 are not suited for detailed dynamical studies: we build mass models for completeness but do not consider them in our analysis. Similarly, we provide mass models for face-on galaxies with i < 30° but exclude them in our analysis. This does not introduce any selection bias since galaxy disks are randomly oriented on the sky. Our final science sample is made of 153 galaxies.
3.3. Mass Models
We derive the contributions of gas disk (Vgas), stellar disk (Vdisk), and bulge (Vbul) to the observed rotation curves. The total baryonic contribution is then given by

where ϒdisk and ϒbul are the stellar mass-to-light ratios of disk and bulge components, respectively. Note that absolute values are needed because Vgas can sometimes be negative in the innermost regions: this occurs when the gas distribution has a significant central depression and the material in the outer regions exerts a stronger gravitational force than that in the inner parts. In this paper, we investigate the ratio Vbar/Vobs for different assumptions of ϒ⋆ (Section 5.3). Rotation curve fits with DM halos are presented in Katz et al. (2016) and will be exploited in future publications.
The gas contribution is calculated using the formula from Casertano (1983), which solves the Poisson equation for a disk with finite thickness and arbitrary density distribution. We assume a thin disk with a total mass of 1.33 MH i, where the factor 1.33 considers the contribution of helium. Vgas is either computed using H i surface density profiles or taken from published mass models. For D512-2, D564-8, and D631-7, H i surface density profiles are not available; hence, we compute Vgas assuming an exponential profile with a scale length of 2Rd. This is a reasonable approximation for such late-type galaxies (e.g., Swaters et al. 2002). We neglect the contribution of molecular gas because CO data are not available for most SPARC galaxies. Fortunately, molecules constitute a minor dynamical component and are generally subdominant with respect to stars and atomic gas (Simon et al. 2003; Frank et al. 2016). If molecules are distributed in a similar way to the stars, their contribution is implicitly included in the assumed value of ϒ⋆.
The stellar contribution is calculated using the observed [3.6] surface brightness profile and extrapolating the exponential fit to  , unless the profile shows a clear truncation. For galaxies with T < 4 (Hubble types earlier than Sbc), we perform bulge–disk decompositions in a nonparametric way. First, we identify a fiducial radius Rbul within which the bulge light dominates. We then subtract the stellar disk from the profile by extrapolating an exponential fit at R < Rbul: this fit describes the inner disk structure (like lenses, rings) and does not necessarily correspond to the outer disk fit. Finally, the residual luminosity profile is used to compute Vbul and linearly extrapolated at R > Rbul to avoid unphysical truncations. We assume that the bulge is spherical and the disk has an exponential vertical distribution with scale height zd = 0.196Rd0.633 (Bershady et al. 2010b). The uncertainties in Vbul and Vdisk are dominated by ϒ⋆ rather than geometry. For example, for oblate bulges the peak in Vbul would increase by less than 20% (Noordermeer 2008). For galaxies with T ≥ 4, we assume that all stars lie in a disk and interpret possible light concentrations as disky pseudobulges (Kormendy & Kennicutt 2004). For only five Sbc-to-Scd galaxies (IC 4202, NGC 5005, NGC 5033, NGC 6946, UGC 2885) do bulge–disk decompositions improve the results. Conversely, we do not decompose NGC 3769 despite it being an Sb.
In Table 2, we provide the values of Vbul and Vdisk for ϒ⋆ = 1 M⊙/L⊙. This is just a convenient value but often exceeds a maximum-disk fit. Vbul and Vstar can be trivially rescaled to any arbitrary ϒ⋆.
Table 2. Mass Model for UGCA 442
| Rad | Vobs | Vgas | Vdisk | Vbul | Σdisk | Σbul |
|---|---|---|---|---|---|---|
| (kpc) | (km s−1) | (L⊙ pc−2) | ||||
| 0.42 | 14.2 ± 1.9 | 4.9 | 4.8 | 0.0 | 11.0 | 0.0 |
| 1.26 | 28.6 ± 1.8 | 13.1 | 10.8 | 0.0 | 5.8 | 0.0 |
| 2.11 | 41.0 ± 1.7 | 19.6 | 13.6 | 0.0 | 2.7 | 0.0 |
| 2.96 | 49.0 ± 1.9 | 22.4 | 13.3 | 0.0 | 1.0 | 0.0 |
| 3.79 | 54.8 ± 2.0 | 22.8 | 12.6 | 0.0 | 0.7 | 0.0 |
| 4.65 | 56.4 ± 3.1 | 21.4 | 12.3 | 0.0 | 0.4 | 0.0 |
| 5.48 | 57.8 ± 2.8 | 18.7 | 12.0 | 0.0 | 0.2 | 0.0 |
| 6.33 | 56.5 ± 0.6 | 16.7 | 10.6 | 0.0 | 0.0 | 0.0 |
Note. Vdisk and Vbul are given for ϒ⋆ = 1 M⊙/L⊙. Similar tables are available for all galaxies at astroweb.cwru.edu/SPARC.
Only a portion of this table is shown here to demonstrate its form and content. A machine-readable version of the full table is available.
Download table as: DataTypeset image
4. STRUCTURAL PROPERTIES
We study structural scaling relations of SPARC galaxies, considering both photometric properties (L[3.6], Reff, Σeff, Rd, and Σd) and H i properties (MH i and RH i).
4.1. Photometric Scaling Relations
Figure 2 illustrates the covariance between L[3.6], Reff, and Σeff (top panels) as well as L[3.6], Rd, and Σd (bottom panels). As expected, the total luminosity broadly correlates with both radius (Reff and Rd) and surface brightness (Σeff and Σd). In the top left panel, the solid line shows the K-band mass–radius relation from the GAMA survey (Lange et al. 2015) for morphologically identified late-type galaxies. For comparison, the stellar masses from Lange et al. (2015) are converted into [3.6] luminosities adopting ϒ⋆ = 0.5 M⊙/L⊙ (Schombert & McGaugh 2014a). The dashed lines show a 0.4 dex deviation from the GAMA relation, corresponding to ∼2 times the observed rms scatter (σobs). We find overall agreement with Lange et al. (2015), indicating that SPARC is not missing any type of galaxy disk in terms of luminosity, size, or surface brightness.
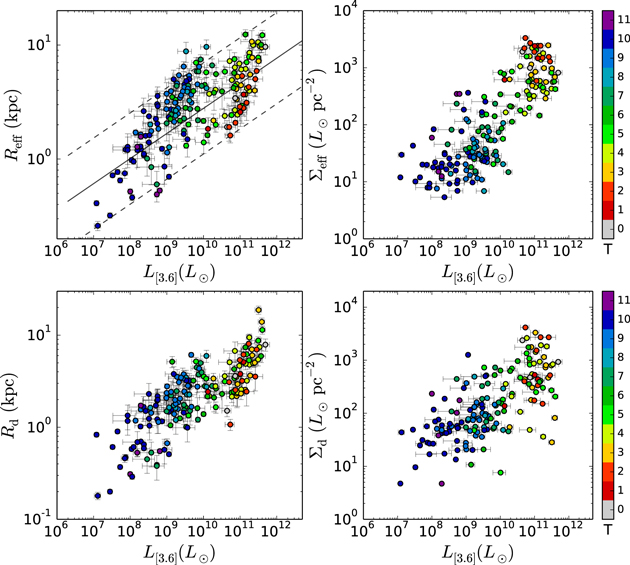
Figure 2. Photometric relations. Galaxies are color-coded by Hubble type. In the top left panel, the solid line shows the K-band mass–radius relation from the GAMA survey (Lange et al. 2015), where stellar masses have been converted to [3.6] luminosities assuming ϒ⋆ = 0.5 M⊙/L⊙. The dashed lines show a 0.4 dex deviation from the mean relation, corresponding to ∼2σ.
Download figure:
Standard image High-resolution imageIn Figure 2, one may discern two separate sequences in the luminosity–size planes, corresponding to early-type HSB spirals and late-type LSB galaxies. This separation may be either real or due to the underrepresentation of galaxies with L[3.6] ≃ 1010 L⊙ in SPARC. Interestingly, a similar separation has been found by Schombert (2006) and may indicate the existence of a surface brightness bimodality for stellar disks (Tully & Verheijen 1997; McDonald et al. 2009a, 2009b; Sorce et al. 2013a).
4.2. The H i Mass–Radius Relation
Figure 3 (top left) shows the MH i –RH i relation (Broeils & Rhee 1997; Verheijen 2001). This correlation is extremely tight. We fit a line using LTS_LINEFIT (Cappellari et al. 2013), which considers errors in both variables and allows for intrinsic scatter (σint). LTS_LINEFIT assumes that the errors on the two variables are independent, but MH i and RH i are affected by galaxy distance as D2 and D, respectively. Hence, we introduce distance uncertainties only in MH i with a linear dependence. We also consider typical errors of 10% on MH i and RH i due to flux calibration. We find

with σobs = 0.13 dex and σint = 0.06 ± 0.01 dex. This is one of the tightest scaling relations of galaxy disks. For comparison, the BTFR has σobs ≃ 0.18 dex and σint ≲ 0.11 dex (Lelli et al. 2016).
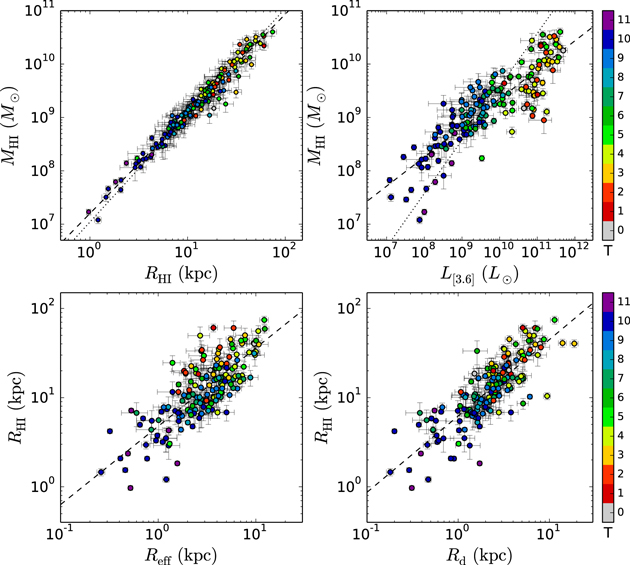
Figure 3. Stellar-H i scaling relations. Galaxies are color-coded by Hubble type. In each panel, the dashed line shows a linear fit. Top left: MH i vs. RH i . The dotted line shows the expected relation for H i disks with a constant mean surface density of 3.5 M⊙ pc−2. Top right: MH i vs. L[3.6]. The dotted line shows M⋆ = Mgas for ϒ⋆ = 0.5 M⊙/L⊙. Bottom: RH i vs. Reff (left) and Rd (right).
Download figure:
Standard image High-resolution imageA tight MH i –RH i relation with a slope of ∼2 implies that the mean surface density of H i disks is constant from galaxy to galaxy (Broeils & Rhee 1997). For comparison, the dotted line in Figure 3 shows the expected relation for H i disks with a mean surface density of 3.5 M⊙ pc−2. We find a slope of 1.87, which is similar to previous estimates: 1.96 (Broeils & Rhee 1997), 1.88 (Verheijen 2001), 1.86 (Swaters et al. 2002), 1.80 (Noordermeer et al. 2005), and 1.72 (Martinsson et al. 2016). These small differences likely arise from different sample sizes and ranges in galaxy properties: in this respect SPARC is the largest sample and spans the broadest dynamic range. The small tilt from the “expected” value of 2 implies that the H i disks of low-mass galaxies are denser than those of high-mass ones (by a factor of ∼2; see also Noordermeer et al. 2005; Martinsson et al. 2016).
4.3. Stellar-H i Scaling Relations
Figure 3 (top right) shows the relation between MH i and L[3.6]. A linear fit returns

with σint = 0.35 ± 0.02 dex. A slope of ∼0.6 implies that the ratio of gas mass (Mgas = 1.33 MH i ) to stellar mass (M⋆ = ϒ⋆ L[3.6]) is not constant in galaxies, but becomes systematically higher for low-luminosity galaxies. For comparison, the dotted line shows the equality Mgas = M⋆ assuming ϒ⋆ = 0.5 M⊙/L⊙. Interestingly, this line broadly demarcates the transition from spirals (T = 1–7) to irregulars (T = 8–11). Gas fractions are explored in detail in Section 5.2.
Finally, the bottom panels of Figure 3 show the relation between H i radius and stellar radius. The latter is estimated as Reff (left) and Rd (right). Assuming a 10% error on these radii, a linear fit returns

with σint = 0.22 ± 0.01 dex, and

with σint = 0.20 ± 0.01 dex. The slope and normalization of these relations imply that H i disks are generally more extended than stellar disks, as we discussed in Section 2.1.
5. DYNAMICAL PROPERTIES
In this section, we explore dynamical properties of SPARC galaxies like gas fractions (Section 5.2) and degree of baryonic maximality (Section 5.3). Both quantities depend on the assumed stellar mass-to-light ratio; hence, we start by discussing the plausible values of ϒ⋆ at [3.6].
5.1. The Stellar Mass-to-light Ratio
The major uncertainty in the mass modeling of galaxies is the value of ϒ⋆. To address this issue, the DiskMass Survey (DMS; Bershady et al. 2010a) measured the vertical velocity dispersion of disk stars in 30 face-on spirals and employed the theoretical relation between vertical velocity dispersion, disk scale height, and dynamical surface density (valid for a self-graviting disk). Since zd cannot be directly measured in face-on galaxies, the DMS statistically estimated the disk scale height using the empirical correlation between Rd and zd, calibrated using NIR photometry of edge-on galaxies (Kregel et al. 2002).
The DMS concluded that stellar disks are strongly submaximal, contributing less than 30% of the dynamical mass within 2.2 Rd and having ϒ⋆ = 0.31 M⊙/L⊙ in the K band (Martinsson et al. 2013). After correcting for the DM contribution, the DMS gives ϒ⋆ = 0.24 M⊙/L⊙ in the K band (Swaters et al. 2014). Considering that LK ≃ 1.3 L[3.6] (Schombert & McGaugh 2014a), these values correspond to ϒ⋆ ≃ 0.2 M⊙/L⊙ at [3.6]. Angus et al. (2016) reanalyzed the DMS data, pointing out that the DM contribution to the vertical force becomes significant for such submaximal disks: when DM halos are included in a self-consistent way, the mean value of ϒ⋆ further decreases to ∼0.18 M⊙/L⊙ in the K band (∼0.14 M⊙/L⊙ at [3.6]). These results are in tension with SPS models (McGaugh & Schombert 2014; Meidt et al. 2014; Schombert & McGaugh 2014a), which find mean values between ∼0.6 and ∼0.8 M⊙/L⊙ in the K band (∼0.4 to ∼0.6 M⊙/L⊙ at [3.6]) depending on the model and IMF.
Interestingly, both the DMS and SPS models suggest that ϒ⋆ is nearly constant in the NIR (within ∼0.1 dex) among galaxies of different masses and morphologies. The discrepancy is only in the overall normalization of ϒ⋆. A nearly constant ϒ⋆ at [3.6] is also suggested by the BTFR (McGaugh & Schombert 2015), which is remarkably tight for a fixed ϒ⋆ (Lelli et al. 2016). Thus, we assume that ϒ⋆ is constant among different galaxies and explore different normalizations. For 32 galaxies with significant bulges, however, we adopt ϒbul = 1.4 ϒdisk as suggested by SPS models (Schombert & McGaugh 2014a). Hereafter, the different normalizations of ϒ⋆ always refer to the stellar disk, i.e., ϒ⋆ = ϒdisk.
5.2. Gas Fractions
We define the gas fraction as

where Ldisk and Lbul are estimated using the nonparametric decompositions in Section 3.3. Figure 4 plots fgas versus L[3.6] assuming ϒ⋆ = 0.5 M⊙/L⊙ (left) and ϒ⋆ = 0.2 M⊙/L⊙ (right). For any realistic value of ϒ⋆, the gas fraction anticorrelates with L[3.6], but the overall shapes of these relations significantly change with ϒ⋆.
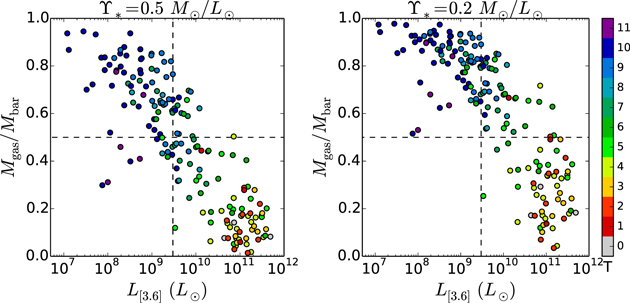
Figure 4. Gas fraction (Equation (7)) vs. [3.6] luminosity for ϒ⋆ = 0.5 M⊙/L⊙ (left) and ϒ⋆ = 0.2 M⊙/L⊙ (right). Galaxies are color-coded by Hubble type. The vertical line at L[3.6] = 3 × 10⁹ L⊙ approximately separates spirals (T = 1–7) from dwarf irregulars (T = 8–11).
Download figure:
Standard image High-resolution imageA value of ϒ⋆ ≃ 0.5 M⊙/L⊙ minimizes the scatter around the BTFR (Lelli et al. 2016) and is found using self-consistent SPS models with standard IMFs (McGaugh & Schombert 2014; Schombert & McGaugh 2014a). This normalization leads to the usual picture for the composition of galaxy disks:
- 1.The
![${f}_{{\rm{gas}}}\mbox{--}\mathrm{log}({L}_{[3.6]})$](https://content.cld.iop.org/journals/1538-3881/152/6/157/revision1/ajaa3207ieqn6.gif) relation is roughly linear. Dwarf galaxies are generally gas dominated but show a broad range in fgas from ∼0.5 to ∼0.9.
relation is roughly linear. Dwarf galaxies are generally gas dominated but show a broad range in fgas from ∼0.5 to ∼0.9. - 2.The transition between spirals (T = 1 to 7) and irregulars (T = 8 to 11) roughly occurs at fgas ≃ 0.5. This is in line with density wave theory (Lin & Shu 1964), since well-developed spiral patterns cannot be supported in gas-dominated disks.
A value of ϒ⋆ = 0.2 M⊙/L⊙ at [3.6] is comparable to the DMS normalization. This low value of ϒ⋆ leads to some strange results:
- 1.The
![${f}_{{\rm{gas}}}\mbox{--}\mathrm{log}({L}_{[3.6]})$](https://content.cld.iop.org/journals/1538-3881/152/6/157/revision1/ajaa3207ieqn7.gif) relation shows a flattening at L[3.6] ≲ 3 × 10⁹ L⊙ (vertical dashed line). Consequently, the vast majority of dwarf irregulars are heavily gas dominated with fgas ≃ 0.8–1.0. Dwarf irregulars are generally thought to be gas dominated (e.g., McGaugh 2012), but this seems a very extreme situation.
relation shows a flattening at L[3.6] ≲ 3 × 10⁹ L⊙ (vertical dashed line). Consequently, the vast majority of dwarf irregulars are heavily gas dominated with fgas ≃ 0.8–1.0. Dwarf irregulars are generally thought to be gas dominated (e.g., McGaugh 2012), but this seems a very extreme situation. - 2.Several bright spirals (1010 < L[3.6]/L⊙ < 1011) have fgas ≳ 0.5. This also includes four early-type spirals (Sa to Sb), corresponding to T = 1–3. It is unclear how these bright galaxies could sustain stellar bars and grand-design spiral patterns in such gas-dominated disks (see, e.g., Athanassoula 1984).
This suggests that ϒ⋆ ≃ 0.5 M⊙/L⊙ gives a more realistic galaxy population than ϒ⋆ ≃ 0.2 M⊙/L⊙.
5.3. Baryonic Maximality
Historically, the degree of disk maximality is estimated by measuring the ratio V⋆/Vobs at 2.2Rd (Sackett 1997). This choice is inherited from early works on late-type spiral galaxies (e.g., van Albada et al. 1985) and is motivated by two facts: (i) in spiral galaxies Vgas is typically much smaller than V⋆, and (ii) for a pure exponential disk V⋆ peaks at 2.2Rd. When comparing galaxies of different masses and morphologies, however, this choice becomes inadequate because (i) in dwarf galaxies Vgas can be larger than V⋆, and (ii) the vast majority of spiral galaxies show deviations from exponential profiles in the inner parts due to bars, lenses, and bulges. Hence, we consider the ratio Vbar/Vobs (instead of V⋆/Vobs) and explore several characteristic radii.
5.3.1. The Choice of the Characteristic Radius
Figure 5 shows mass models for two galaxies with diametrically opposed properties: a bulge-dominated spiral galaxy (NGC 7814) and a gas-dominated dwarf galaxy (UGCA 442). Top panels show [3.6] surface brightness profiles and exponential fits to the outer disk; bottom panels show rotation curve decompositions adopting ϒdisk = 0.5 M⊙/L⊙ and ϒbul = 0.7 M⊙/L⊙. The arrows illustrate three different characteristic radii: (i) the commonly used radius at 2.2Rd (R2.2; gray), (ii) the effective radius encompassing half of the total [3.6] luminosity (Reff; red), and (iii) the radius where Vbar is maximum (Rbar; blue). The last radius was denoted as Rp by McGaugh (2005a).
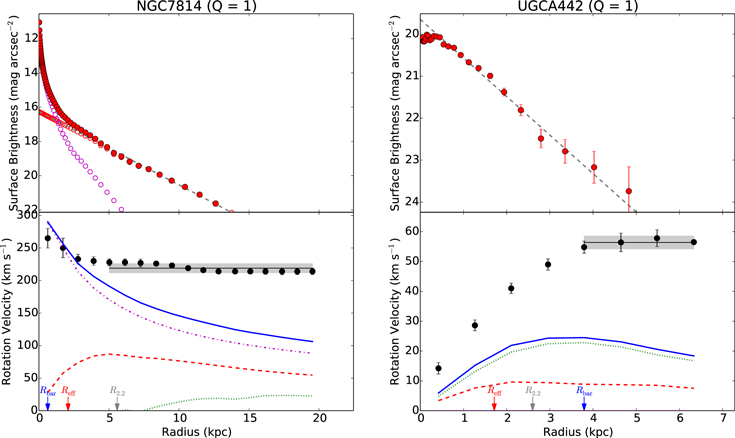
Figure 5.
Mass models for two SPARC galaxies adopting ϒdisk = 0.5 M⊙/L⊙ and ϒbu = 0.7 M⊙/L⊙. Top panels show the [3.6] surface brightness profiles (red dots) and exponential fits to the outer stellar disk (dashed line). Open circles show extrapolated values for bulge (purple) and disk (red) components. Bottom panels show the observed rotation curves (black dots) and the velocity contributions due to gas (green dotted line), stars (red dashed line), bulge (purple dot-dashed line), and total baryons (blue solid line). The arrows indicate three characteristic radii: 2.2Rd (gray), Reff (red), and Rbar (blue). The gray band shows the velocity points used to compute Vf (black solid line), as described in Lelli et al. (2016). (The complete figure set (175 images) is available.)
Download figure:
Standard image High-resolution imageNGC 7814 (left) is an early-type spiral (Sab). The surface brightness profile shows a central light enhancement due to the bulge. The rotation curve displays a very steep rise in the inner parts, a decline of ∼50 km s−1, and a flat outer portion. These are typical features for early-type spirals (Noordermeer et al. 2007). For ϒ⋆ = 0.5 M⊙/L⊙ baryons explain the inner parts of the rotation curve, while DM is needed at large radii. Note that Reff occurs along the declining part of the rotation curve, while R2.2 occurs along the flat part: Rbar is the only radius that captures the concept of baryonic maximality.
UGCA 442 (right) is a late-type dwarf (Sm). The surface brightness profile is well described by an exponential law, but there is a central flattening due to a cored light distribution. The rotation curve shows a slow rise in the central regions and a flat part beyond the stellar component. For ϒ⋆ = 0.5 M⊙/L⊙ baryons cannot fully explain the inner rise of the rotation curve and DM is needed down to small radii. This is a typical behavior for low-mass and LSB galaxies: maximum-disk decompositions require high values of ϒ⋆ that are ruled out by standard SPS models (de Blok & McGaugh 1997; Swaters et al. 2011). Note that the shape of Vbar is mostly driven by the gas contribution and Rbar occurs well beyond Reff or R2.2 due to the gas dominance.
These two examples illustrate that both R2.2 and Reff can be misleading in quantifying the baryonic maximality because they can be far from the radius where Vbar peaks. In the following, we consider Rbar as our fiducial characteristic radius, but we also show Vbar/Vobs at R2.2 (hereafter V2.2/Vobs) to compare with previous works.
In the previous examples, the value of Rbar does not depend on the assumed ϒ⋆ because the shape of Vbar is dominated by either V⋆ or Vgas. In galaxies where V⋆ ≃ Vgas, however, the value of Rbar may depend on the assumed ϒ⋆ because the overall shape of Vbar is affected by the relative contributions of V⋆ and Vgas: these cases represent a minority among SPARC galaxies.
Finally, we note that Vbar depends on galaxy distance as  other than on the assumed ϒ⋆. Uncertainties in galaxy distances, therefore, may affect the value of Vbar/Vobs. Moreover, the normalization of Vobs depends on the assumed inclination as
  , but this is a minor source of uncertainty for galaxies with i ≳ 30°.
5.3.2. The Effect of the Stellar Mass-to-light Ratio
Figures 6 and 7 show Vbar/Vobs measured at R2.2 and Rbar, respectively. We illustrate the covariance with L[3.6] (top) and Σeff (bottom). We consider two different normalizations of ϒ⋆ as described in Section 5.1. First, we note that the degree of maximality of dwarf galaxies does not strongly depend on ϒ⋆ because these objects are gas dominated: the values of Vbar/Vobs stay in the range of 0.3–0.6 (apart from a few outliers) using both R2.2 and Rbar. Conversely, the degree of maximality of spirals depends strongly on ϒ⋆.
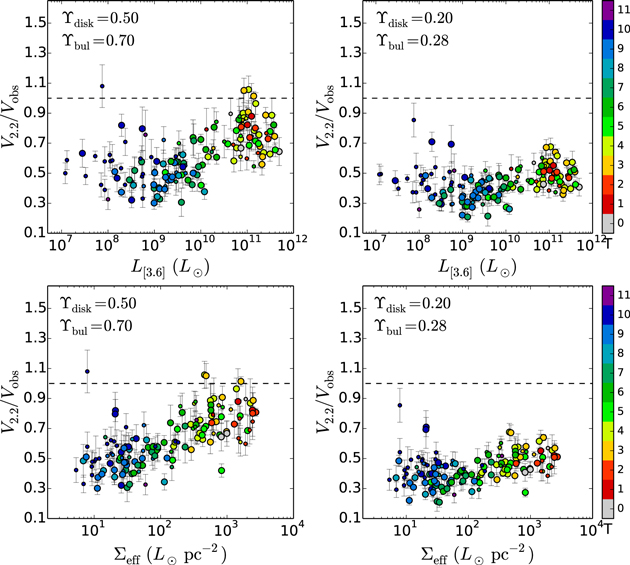
Figure 6. Ratio of baryonic to observed rotation velocity at 2.2 disk scale lengths (V2.2/Vobs). We show the covariance with the total [3.6] luminosity (top) and effective surface brightness (bottom). Two different normalizations of ϒ⋆ are illustrated. Galaxies are color-coded by Hubble type. In these plots we exclude galaxies with i < 30° and Q = 3. Large and small circles correspond to galaxies with Q = 1 and Q = 2, respectively. The dashed line shows Vbar/Vobs = 1, denoting the upper limit for physically acceptable disks.
Download figure:
Standard image High-resolution image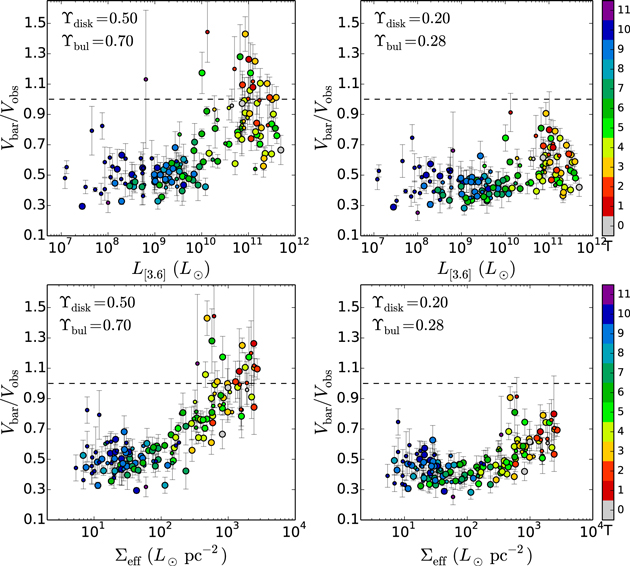
Figure 7. Same as Figure 6, but we now show the value of Vbar/Vobs measured at the peak of the baryonic contribution (Rbar).
Download figure:
Standard image High-resolution imageFor ϒ⋆ = 0.5 M⊙/L⊙, high-luminosity HSB galaxies are nearly maximal, whereas low-luminosity LSB galaxies are submaximal. By definition, the value of Vbar/Vobs is higher at Rbar than R2.2, especially in galaxies with bulges. Some objects have Vbar/Vobs ≳ 1, but this is not surprising. We expect some intrinsic scatter around the mean value of ϒ⋆ (of ∼0.1 dex; see Meidt et al. 2014; Lelli et al. 2016); hence, a few objects may have Vbar/Vobs > 1 for a fixed ϒ⋆. We also note that several galaxies with Vbar/Vobs > 1 have uncertain distances and are consistent with Vbar/Vobs ≲ 1 within the errors. The degree of baryonic maximality correlates better with surface brightness than luminosity, in line with previous studies (e.g., McGaugh 2005, 2016).
For ϒ⋆ = 0.2 M⊙/L⊙, spiral galaxies are submaximal as found by the DMS (Martinsson et al. 2013). For this low value of ϒ⋆, most spirals are nearly as submaximal as dwarf galaxies (which are not included in the DMS). This would imply that there is no strong dynamical difference among objects spanning ∼5 dex in luminosity and ∼4 dex in surface brightness. One does expect a difference over this range because HSB and LSB galaxies lie on the same BTFR. At a given baryonic mass, Vobs is nearly the same but Vbar goes as  ; hence, it is higher in HSB galaxies (with small Rbar) than in LSB galaxies (with large Rbar). Therefore, Vbar/Vobs should correlate with surface brightness, but this trend is barely perceptible for ϒ⋆ = 0.2 M⊙/L⊙. If Rbar is adopted, Vbar/Vobs shows a parabolic trend with Σeff (Figure 7, bottom right). The LSB end is driven by gas-dominated dwarf galaxies, while the HSB end is driven by bulge-dominated spiral galaxies: galaxies with intermediate surface brightnesses are generally disk dominated and would be less maximal than gas-dominated LSB galaxies for ϒ⋆ = 0.2 M⊙/L⊙. This seems strange.
It is important to derive an upper limit for the mean value of ϒ⋆ since this can be used to constrain different IMFs and SPS models. In Figure 8 we show Vbar/Vobs at Rbar for ϒ⋆ = 0.8 M⊙/L⊙. For this high normalization, a large fraction of high-mass HSB galaxies have Vbar/Vobs > 1. It is conceivable that ϒ⋆ may scatter up to 0.8 M⊙/L⊙ for some individual galaxies, but this cannot be the correct mean ϒ⋆. In the extreme scenario where the “true” mean ϒ⋆ gives Vbar/Vobs = 1 in bright galaxies, the scatter in ϒ⋆ should drive ∼50% of galaxies to values of Vbar/Vobs > 1. If we consider galaxies with L[3.6] > 2 × 10¹⁰ L⊙, a value of ϒ⋆ = 0.8 M⊙/L⊙ implies over-maximal disks in ∼67% of the cases, which is statistically unacceptable. For truly maximal disks with Vbar/Vobs = 1, we find that the upper limit on the mean value of ϒ⋆ is ∼0.7 M⊙/L⊙. If we adopt the customary definition of maximum disk as Vbar/Vobs = 0.85 (Sackett 1997), then the mean maximum-disk value of ϒ⋆ is ∼0.5 M⊙/L⊙, which is similar to the predictions of SPS models with standard IMFs (e.g., McGaugh & Schombert 2014; Meidt et al. 2014; Schombert & McGaugh 2014a).
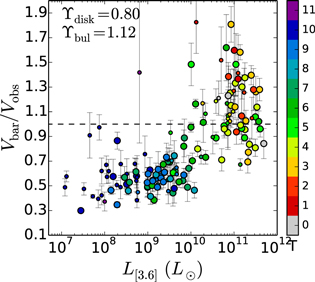


Figure 8. Same as Figure 7 (top), but adopting ϒ⋆ = 0.8 M⊙/L⊙. This value of ϒ⋆ gives unphysical results for high-mass galaxies.
Download figure:
Standard image High-resolution image

6. SUMMARY AND CONCLUSIONS
We introduce SPARC: a sample of 175 galaxies with new Spitzer photometry at 3.6 μm and high-quality rotation curves from previous H i/Hα works. We describe the galaxy sample, derive homogeneous [3.6] photometry, and study structural relations of stellar and H i disks. We find that the relation between stellar and H i mass has significant intrinsic scatter (σint ≃ 0.35 dex), as well as the relation between stellar and H i radius (σint ≃ 0.2 dex). Conversely, the H i mass–radius relation is extremely tight (σint ≃ 0.06 dex) and implies that H i disks have the same mean surface density within a factor of ∼2.
We build detailed mass models, which are available at astroweb.cwru.edu/SPARC. In this first SPARC paper, we investigate gas fractions (fgas = Mgas/Mbar) and the degree of baryonic maximality (Vbar/Vobs) for different values of the stellar mass-to-light ratio (ϒ⋆).
Assuming ϒ⋆ = 0.5 M⊙/L⊙, we find the usual picture for the overall composition of galaxy disks:
- 1.The relation between fgas and
![$\mathrm{log}({L}_{[3.6]})$](https://content.cld.iop.org/journals/1538-3881/152/6/157/revision1/ajaa3207ieqn11.gif) is roughly linear: dwarf galaxies are generally gas dominated but display a broad range in fgas from 0.5 to 0.9.
is roughly linear: dwarf galaxies are generally gas dominated but display a broad range in fgas from 0.5 to 0.9. - 2.The transition between spiral galaxies and dwarf irregulars roughly occurs at fgas ≃ 0.5, in line with the predictions of density wave theory: stellar bars and grand-design spiral arms are generally suppressed in gas-dominated disks.
- 3.The ratio Vbar/Vobs (measured at the peak of Vbar) varies with luminosity and surface brightness: high-mass HSB galaxies are nearly maximal, while low-mass LSB galaxies are submaximal. The degree of baryonic maximality correlates better with surface brightness than luminosity.
A mean value of ϒ⋆ ≳ 0.7 M⊙/L⊙ is statistically ruled out because it implies over-maximal baryonic contributions in high-mass HSB galaxies. If we adopt the customary definition of maximum disk as Vbar/Vobs = 0.85 (Sackett 1997), the mean maximum-disk value of ϒ⋆ is ∼0.5 M⊙/L⊙ for bright galaxies.
If the assumed value of ϒ⋆ is too low (like 0.2 M⊙/L⊙), we find some strange results:
- 1.The
![${f}_{{\rm{gas}}}\mbox{--}\mathrm{log}({L}_{[3.6]})$](https://content.cld.iop.org/journals/1538-3881/152/6/157/revision1/ajaa3207ieqn12.gif) relation shows a flattening at the low-luminosity end, implying that dwarf irregulars are extremely gas dominated (fgas ≃ 0.8–1.0).
relation shows a flattening at the low-luminosity end, implying that dwarf irregulars are extremely gas dominated (fgas ≃ 0.8–1.0). - 2.Several spiral galaxies (including Sa–Sb types) would be gas dominated (fgas ≳ 0.5). It would then be unclear how these spiral galaxies could sustain stellar bars and grand-design spiral patterns in such gas-dominated disks.
- 3.The ratio Vbar/Vobs would show a parabolic trend with surface brightness. Disk-dominated galaxies of intermediate surface brightnesses would be more submaximal than gas-dominated LSB dwarfs and bulge-dominated HSB spirals.
A value of ϒ⋆ = 0.2 M⊙/L⊙ at [3.6] (∼0.26 M⊙/L⊙ in the K band) is comparable to the results of the DMS (Martinsson et al. 2013; Swaters et al. 2014). Hence, one may wonder whether there are some systematics in the DMS or we should change our general view of the composition of galaxy disks. A possible solution to this controversy has been offered by Aniyan et al. (2016). They pointed out that the scale heights from the DMS are representative of old stellar populations, whereas the vertical velocity dispersions come from integrated light measurements containing contributions from K giants of different ages. In the solar vicinity, Aniyan et al. (2016) find that young K giants have significantly smaller velocity dispersion and scale height than old K giants; hence, the DMS may have systematically underestimated the disk surface densities by a factor of ∼2 due to the combination of light-integrated velocity dispersions from multiple stellar populations and scale heights from old stellar populations. If true, this would give ϒ⋆ ≃ 0.4–0.5 M⊙/L⊙, in agreement with stellar population synthesis models (McGaugh & Schombert 2014; Meidt et al. 2014), resolved stellar populations in the LMC (Eskew et al. 2012), the BTFR (McGaugh & Schombert 2015; Lelli et al. 2016), and the results presented in this paper.
This work would have not been possible without the high-quality rotation curves that were derived over the past 30 yr by many good people. In particular, we thank Erwin de Blok, Filippo Fraternali, Gianfranco Gentile, Rachel Kuzio de Naray, Renzo Sancisi, Bob Sanders, Rob Swaters, Thijs van der Hulst, Liese van Zee, and Marc Verheijen. This publication was made possible through the support of a grant from the John Templeton Foundation. The opinions expressed in this publication are those of the authors and do not necessarily reflect the views of the John Templeton Foundation.
Footnotes
- 3
The NASA/IPAC Extragalactic Database (NED) is operated by the Jet Propulsion Laboratory, California Institute of Technology, under contract with the National Aeronautics and Space Administration.