
Abstract
It is now known that proteins associated with neurodegenerative disease can spread throughout the brain in a prionlike manner. However, the mechanisms regulating the trans‐synaptic spread propagation, including the neuronal release of these proteins, remain unknown. The interaction of neurodegenerative disease‐associated proteins with the molecular chaperone Hsc70 is well known, and we hypothesized that much like disaggregation, refolding, degradation, and even normal function, Hsc70 may dictate the extracellular fate of these proteins. Here, we show that several proteins, including TDP‐43, α‐synuclein, and the microtubule‐associated protein tau, can be driven out of the cell by an Hsc70 co‐chaperone, DnaJC5. In fact, DnaJC5 overexpression induced tau release in cells, neurons, and brain tissue, but only when activity of the chaperone Hsc70 was intact and when tau was able to associate with this chaperone. Moreover, release of tau from neurons was reduced in mice lacking the DnaJC5 gene and when the complement of DnaJs in the cell was altered. These results demonstrate that the dynamics of DnaJ/Hsc70 complexes are critically involved in the release of neurodegenerative disease proteins.
Synopsis
The DnaJC5 protein, cysteine string protein‐α (CSPα), stimulates the release of neurodegenerative proteins through a non‐canonical exocytosis pathway.
-
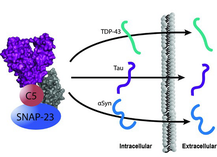
Increased expression of DnaJC5 promotes extracellular release of the microtubule‐associated protein tau, α‐synuclein, and TAR‐DNA binding protein.
-
Release of these proteins is dependent upon both the SNARE, SNAP‐23, and the constitutively expressed Hsp70 variant, Hsc70.
-
This function of DnaJC5 and the Hsc70 complex is unique as other DnaJs and Hsp70 variants do not promote this mechanism.
-
This finding provides a mechanism for how aggregate‐prone proteins can exit the cell and possibly seed propagation.
Introduction
The accumulation of pathological proteins associated with neurodegenerative disease, such as the microtubule‐associated protein tau, α‐synuclein, and huntingtin, follows distinct patterns, suggesting a spreading phenomenon (Braak & Braak, 1991; Spillantini et al, 1997; Guo & Lee, 2011; Hansen et al, 2011; de Calignon et al, 2012; Liu et al, 2012; Brettschneider et al, 2014; Polydoro et al, 2014; Babcock & Ganetzky, 2015; Iba et al, 2015). Despite accumulating evidence that neurodegenerative disease‐associated proteins are taken up by neurons and spread cell–cell through the brain (Holmes et al, 2013; Dujardin et al, 2014; Pecho‐Vrieseling et al, 2014; Calafate et al, 2015), there is no clear consensus that these neurodegenerative proteins behave in a canonical prionlike manner (Wegmann et al, 2015). Further, the mechanisms regulating the release of these proteins into the extracellular space remain unknown. We speculated that chaperone proteins could play a key part in this process.
The interaction of neurodegenerative disease‐associated proteins with the molecular chaperone Hsc70 in particular is well known (Auluck et al, 2002; Dou et al, 2003; Sarkar et al, 2008; Jinwal et al, 2010, 2013; Pemberton et al, 2011; Yu et al, 2014; Monsellier et al, 2015). Hsc70 is abundant in metazoans and constitutively expressed in cells (Finka & Goloubinoff, 2013). It is responsible for a myriad of processes to maintain proteostasis in the cell with roles in nascent polypeptide folding (Beckmann et al, 1990), protein degradation (Bercovich et al, 1997), and clathrin‐mediated endocytosis (Chappell et al, 1986; Black et al, 1991). Many of the important Hsc70 functions are coordinated by a complement of co‐chaperones including the DnaJ proteins (Cheetham et al, 1992, 1996). DnaJ proteins are structurally diverse, yet all contain a common J‐domain which coordinates Hsc70 binding via a HPD motif (Hennessy et al, 2000).
Hsc70/DnaJ complexes control refolding, disaggregation (Gao et al, 2015; Nillegoda et al, 2015), degradation (Jinwal et al, 2013; Fontaine et al, 2015a), and even normal function (Jinwal et al, 2010; Fontaine et al, 2015a) of neurodegenerative disease‐associated proteins. We hypothesized that an Hsc70/DnaJ interaction may dictate the extracellular fate of these proteins. A logical candidate for such a DnaJ is DnaJC5, a protein known to promote exocytosis (Jacobsson & Meister, 1996; Chamberlain & Burgoyne, 1997, 1998). DnaJC5 is a small, neuroprotective protein (Fernández‐Chacón et al, 2004; Chandra et al, 2005; García‐Junco‐Clemente et al, 2010; Tiwari et al, 2015) which chaperones SNAP‐25 to promote SNARE‐mediated exocytosis (Burré et al, 2010; Sharma et al, 2011) and is important in calcium sensitivity of synapses (Umbach & Gundersen, 1997; Seagar et al, 1999; Graham & Burgoyne, 2000; Ruiz et al, 2008; Weng et al, 2009; Rozas et al, 2012; Chiang et al, 2014). We hypothesized that a DnaJC5/Hsc70 complex could contribute to the extracellular release of neurodegenerative disease‐associated proteins.
Results
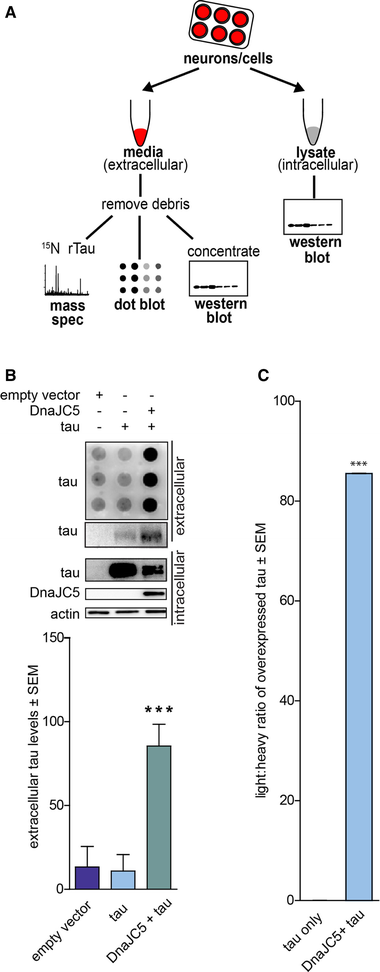
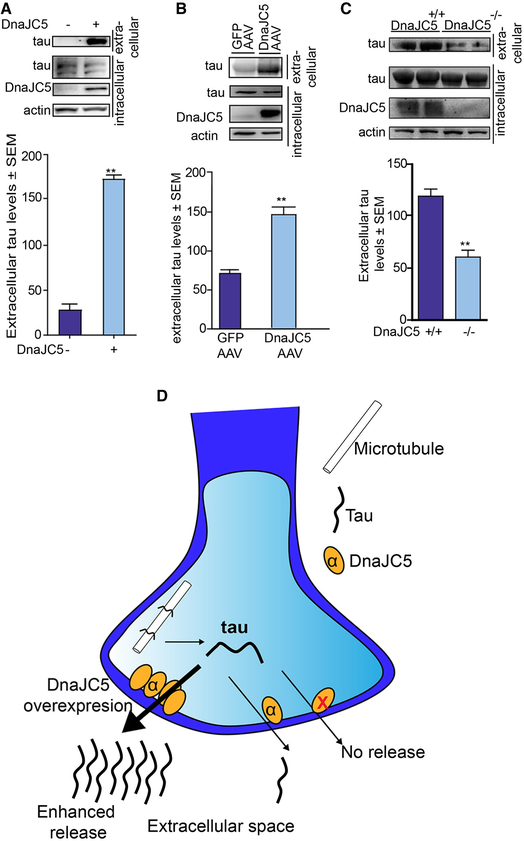
We first assessed whether DnaJC5 might regulate extracellular tau release, as the interaction with Hsc70 and tau is well described by our laboratory (Jinwal et al, 2010, 2013; Abisambra et al, 2013; Fontaine et al, 2015a,b). Using a cell model, proteins were overexpressed in HEK293T cells for 42 h, then cells were washed to remove traces of serum proteins prior to incubation in serum‐free media for 6 h to assay extracellular release, as detailed in Fig 1A. The conditioned media were free of intracellular contamination, and for mass spectroscopy analyses, vesicular‐bound proteins were neither liberated nor digested. Overexpression of DnaJC5 significantly facilitated extracellular tau release, as determined both by dot blot, Western blot, and by quantitative mass spectroscopy using 15N tau as an internal standard (Figs 1A–C and EV1). However, intracellular tau levels were decreased in cells overexpressing DnaJC5 (Fig 1B). To determine whether this was due to DnaJC5‐mediated decreases in translation, we performed qRT–PCR on cells overexpressing DnaJC5 and tau. mRNA production of tau was unchanged in DnaJC5‐overexpressing cells compared to control (Fig EV2A), suggesting reductions in intracellular tau levels were not due to aberrations in protein translation. Alternatively, intracellular tau reductions due to DnaJC5 overexpression could be attributed to degradation. Cells were treated with epoxomicin for 6 h to block proteasomal degradation, but inhibiting protein degradation did not prevent intracellular tau reductions (Fig EV2B). Finally, overexpression of DnaJC5 was non‐toxic by multiple measures (Fig EV2C). Together, these data indicate the reduction in intracellular tau levels following DnaJC5 overexpression was caused by enhanced extracellular release.
Source data are available online for this figure.
DnaJC5 overexpression facilitates tau release into the extracellular space
A. Schematic illustrating the preparation of samples for media analysis by dot blot/Western blot or mass spectroscopy.
B. Dot blot of tau levels in media from HEK293T cells overexpressing tau and FLAG‐DnaJC5 compared to empty vector and tau. Intracellular protein levels are shown by Western blot; DnaJC5 was detected by FLAG antibody. Quantification of extracellular tau levels is shown below; data are mean ± SEM, n = 8, ***P < 0.001.
C. Light/heavy ratio of tau peptides in label‐free mass spectroscopy of media from HEK293T cells overexpressing tau or tau and DnaJC5 compared to 100 ng 15N‐labeled recombinant tau. Light peptides represent endogenous tau peptides. Data are mean ± SEM, n = 3 biological repeats, ***P < 0.001.
Previous reports have shown that endogenous tau release is a normal, physiological process in the brain (Pooler et al, 2013; Yamada et al, 2014), thereby suggesting endogenous tau should also be released by DnaJC5. Indeed, DnaJC5 overexpression facilitated release of endogenous tau from M17 neuronal cell lines and organotypic brain slice cultures from wild‐type mice (Fig 2A and B). Endogenous tau was co‐localized with the pre‐synaptic proteins SNAP25 and synaptophysin in neurons (Fig EV3A, B, D and E) and DnaJC5 overexpression reduced levels of this pre‐synaptic tau (Fig EV3C and F), suggesting that DnaJC5 facilitates the release of this “primed” pre‐synaptic tau from neurons. To confirm that DnaJC5 is responsible for this enhanced release, extracellular tau levels were analyzed from organotypic slices prepared from mice lacking DnaJC5 (Fernández‐Chacón et al, 2004; Sharma et al, 2012) (Cspα−/− mice). DnaJC5/Cspa−/− had significantly reduced extracellular tau levels (Fig 2C), thereby confirming that DnaJC5 is a critical mediator of extracellular tau release (Fig 2D).
Source data are available online for this figure.
Release of tau is regulated by DnaJC5
A. Western blot of endogenous tau levels from M17 neuroblastoma cells overexpressing FLAG‐DnaJC5 or empty vector. Media were concentrated prior to analysis. Intracellular DnaJC5 was detected with FLAG antibody. Quantification of mean extracellular tau levels ± SEM, n = 3, **P < 0.01 one‐way analysis of variance with Tukey's multiple comparison post hoc analysis.
B. Western blot tau levels from concentrated media from ex vivo organotypic slice cultures of wild‐type mice overexpressing GFP‐AAV9 or FLAG‐DnaJC5‐AAV9. DnaJC5 is detected by FLAG antibody. Quantification of mean extracellular tau levels ± SEM, n = 3, **P < 0.01 one‐way analysis of variance with Tukey's multiple comparison post hoc analysis.
C. Western blot tau levels from concentrated media from ex vivo organotypic slice cultures of Cspa+/+ or Cspa−/− mice. DnaJC5 was detected by DnaJC5 antibody (Synaptic Systems). Quantification of mean extracellular tau levels ± SEM, n = 3, **P < 0.01 one‐way analysis of variance with Tukey's multiple comparison post hoc analysis.
D. Schematic showing that lack of DnaJC5 (yellow circles) reduces extracellular tau release, whereas overexpression of DnaJC5 results in enhanced release of tau.
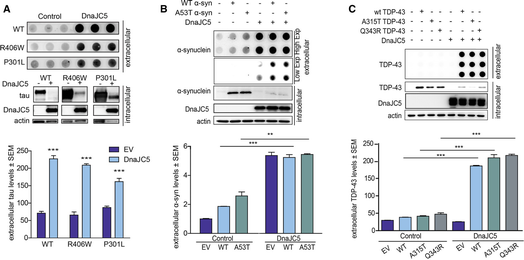
Not only is extracellular tau found in patients with tauopathies such as Alzheimer's disease, frontotemporal dementia, and other tauopathies (Medina & Avila, 2014), tau pathology is known to spread via synaptically connected brain regions. Therefore, it is likely that extracellular tau plays a critical role in the pathophysiology of these neurodegenerative diseases. DnaJC5‐induced release of tau was relevant to disease‐associated forms, as DnaJC5 not only facilitated the secretion of wild‐type tau, but also mutant tau species associated with tauopathies (Fig 3A). Trans‐neuronal spread and release of disease‐associated proteins has been described in other diseases as well, including synucleinopathies (Desplats et al, 2009; Hansen et al, 2011; Masuda‐Suzukake et al, 2013), polyQ disorders (Pecho‐Vrieseling et al, 2014; Babcock & Ganetzky, 2015; Pearce et al, 2015), and amyotrophic lateral sclerosis (ALS) (Kassubek et al, 2014). We speculated that DnaJC5 overexpression could also facilitate the release of some other pathological proteins associated with neurological disease. Indeed, in addition to tau, DnaJC5 facilitated the release of some other disease‐associated proteins, such as wild‐type and mutant TDP‐43 (Fig 3B) and α‐synuclein proteins in HEK293T (Fig 3C), but not a polyQ‐25 fragment (Fig EV2D), suggesting some level of client selectivity for this process. As with tau, overexpression of DnaJC5 did not reduce mRNA levels of either α‐synuclein or TDP‐43 (Fig EV2A) and distribution of these proteins in neuronal cells revealed expected subcellular localization without extravagant aggregation (Fig EV4). These results indicate that DnaJC5 could facilitate a common mechanism for the release of neurodegenerative proteins into the extracellular space.
Source data are available online for this figure.
DnaJC5 facilitates the release of neurodegenerative‐associated proteins into the extracellular space
A. FLAG‐DnaJC5 overexpression facilitates extracellular release of wild‐type (WT), P301L, and R406W tau by dot blot in HEK293T cells. Intracellular protein levels are shown by Western blot; DnaJC5 was detected by FLAG antibody. Quantification of extracellular tau levels is shown below; data are mean ± SEM, n = 3, ***P < 0.001 one‐way analysis of variance with Tukey's multiple comparison post hoc analysis.
B. Overexpression of FLAG‐DnaJC5 induces extracellular release of wild‐type (WT) and A53T α‐synuclein in HEK293T cells. Extracellular protein levels are shown by dot blot (quantification below, mean ± SEM, n = 3, ***P < 0.001, **P < 0.01 by one‐way analysis of variance with Tukey's multiple comparison post hoc analysis), and intracellular proteins levels were analyzed by Western blot; DnaJC5 was detected by FLAG antibody.
C. DnaJC5 overexpression induces extracellular release of GFP‐tagged wild‐type (WT), A315T, and Q343R TDP‐43 in HEK293T cells. Intracellular DnaJC5 was detected by FLAG antibody. Extracellular protein levels were analyzed by dot blot (quantification below, mean ± SEM, n = 4, ***P < 0.001 one‐way analysis of variance with Tukey's multiple comparison post hoc analysis).
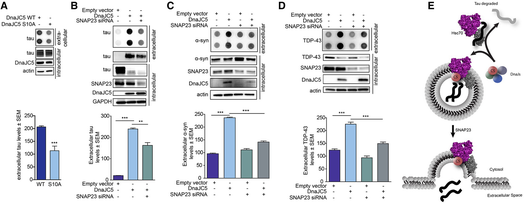
While DnaJC5 and Hsc70 have a known role in synaptic exocytosis through SNAP‐25, HEK cells do not express SNAP‐25. Despite this, DnaJC5 could facilitate the release of neurodegenerative proteins from these non‐neuronal cells. But when DnaJC5 was mutated in a way that reduced its exocytotic function (Evans et al, 2001), tau release was again abrogated even in HEK cells (Fig 4A). Thus, we hypothesized that a non‐canonical exocytosis mechanism was being engaged by DnaJC5. We speculated that the ubiquitously expressed SNARE, SNAP‐23, which is known to be involved in alternative exocytosis pathways including lysosomal exocytosis (Rao et al, 2004; Boddul et al, 2014) and is important for the extracellular release of a variety of molecules including metalloproteases, chemokines, and renin (Kean et al, 2009; Frank et al, 2011; Mendez & Gaisano, 2013), could be involved in this process. Indeed, siRNA‐mediated knockdown of SNAP‐23 blocked DnaJC5‐mediated extracellular release of tau (Fig 4B). Moreover, α‐synuclein (Fig 4C) and TDP‐43 (Fig 4D) release were also blocked by SNAP‐23 siRNA in M17 neuronal cells. Thus, DnaJC5‐stimulated release of neurodegenerative proteins occurs through a non‐canonical, SNAP‐23‐mediated exocytosis pathway, perhaps acting as a release valve for neurodegenerative proteins (Fig 4E).
Source data are available online for this figure.
DnaJC5 participates in an alternative exocytosis pathway important for extracellular release
A. Dot blot of tau levels in media of cells overexpressing the phospho‐deficient FLAG‐DnaJC5 S10A compared to FLAG‐DnaJC5 WT. Intracellular levels are shown by Western blot; DnaJC5 was detected by FLAG antibody. Quantification of mean tau levels ± SEM, n = 6, ***P < 0.001 one‐way analysis of variance with Tukey's multiple comparison post hoc analysis.
B. Knockdown of SNAP23 by siRNA inhibits DnaJC5‐mediated tau release in HEK293T cells as shown by dot blot. Quantification of mean extracellular levels ± SEM, n = 3, **P < 0.01, ***P < 0.001 one‐way analysis of variance with Tukey's multiple comparison post hoc analysis. DnaJC5 was detected by FLAG antibody.
C. Knockdown of SNAP23 by siRNA inhibits DnaJC5‐mediated α‐synuclein release in M17 cells as shown by dot blot. Quantification of mean extracellular levels ± SEM, n = 3, ***P < 0.001 by one‐way ANOVA with a Tukey's post hoc analysis. DnaJC5 was detected by FLAG antibody.
D. Knockdown of SNAP23 by siRNA inhibits DnaJC5‐mediated TDP‐43 release in M17 cells as shown by dot blot. Quantification of extracellular levels is mean ± SEM, n = 3, ***P < 0.001 one‐way analysis of variance with Tukey's multiple comparison post hoc analysis. DnaJC5 was detected by FLAG antibody.
E. Schematic representation of Hsp70 control of DnaJC5‐mediated tau release. DnaJ selection on Hsc70 dictates client fate: if a pro‐degradation DnaJ binds to Hsc70, clients are sent for degradation. If DnaJC5 binds to Hsc70, client proteins are sent for release by a SNAP23‐dependent pathway.
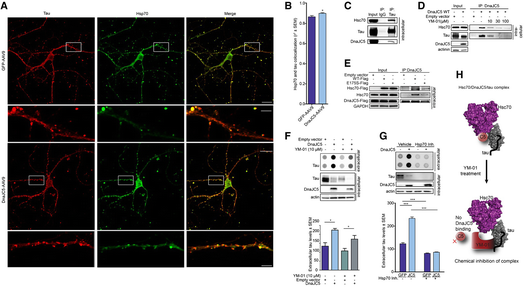
We next sought to identify the mechanism by which DnaJC5 was enhancing this extracellular triage of these neurodegenerative proteins. In wild‐type primary neurons, DnaJC5‐AAV overexpression enhanced the association of tau with Hsc70 at the pre‐synapse (Fig 5A and B), suggesting that DnaJC5, tau, and Hsc70 were in complex at the synapse. This arrangement is spatially possible as we have previously demonstrated that tau binds to the substrate‐binding domain (SBD) of Hsc70 and DnaJC5 binds to a separate region in the nucleotide‐binding domain (NDB) (Fontaine et al, 2015a). Immunoprecipitation revealed that Hsc70 and DnaJC5 can bind to tau, confirming that this tripartite complex can form (Fig 5C). Therefore, we sought to disrupt this complex and determine whether we could also prevent DnaJC5‐mediated tau release. YM‐01 is a small molecule inhibitor of Hsc70 which binds to the DnaJ‐binding region in the NBD of Hsc70 and inhibits the allosteric inter‐domain communication that controls Hsc70 activity (Rousaki et al, 2011). This compound does not inhibit the Hsc70–tau interaction, as tau binds to the substrate‐binding domain of Hsc70 (Fontaine et al, 2015a), but it can compete for DnaJ binding (Abisambra et al, 2013). DnaJC5 was immunoprecipitated from cell lysates, then treated with increasing doses of YM‐01. Both Hsc70 and tau binding to DnaJC5 decreased with increasing concentrations of YM‐01 (Fig 5D). We were also able to determine that the dominant‐negative Hsc70 variant E175S, which lacks Hsc70 activity yet can still bind tau (Fontaine et al, 2015b), was able to disrupt this complex as well (Fig 5E), thereby demonstrating that both genetic inhibition and chemical inhibition of Hsc70 disrupt this complex.
Source data are available online for this figure.
Tau release is controlled by chaperones
A. Confocal micrographs of tau (red pseudocolor) and Hsp70 (green pseudocolor) colocalization (merged image) levels in wild‐type primary neurons overexpressing GFP‐AAV9 or FLAG‐DnaJC5‐AAV9. Boxed area are 5× digital zoom on a 60× lens shown below. Scale bars are 20 μm and 5 μm (insets). Only neurons overexpressing virus were imaged.
B. Quantification of tau‐Hsp70 co‐localization (mean Pearson's coefficient ± SEM, n = 18, *P < 0.05, one‐way analysis of variance with Tukey's multiple comparison post hoc analysis).
C. Western blot of immunoprecipitated tau from HEK293T reveals tau exists in an intracellular complex with DnaJC5 and Hsc70. DnaJC5 was detected with FLAG antibody.
D. Western blot of HEK293T intracellular lysates shows the DnaJC5/Hsc70/tau complex is disrupted by the addition of increasing amounts of YM‐01 (0, 10, 30, 100 μM) in a dose‐dependent fashion. DnaJC5 was detected by FLAG antibody.
E. The DnaJC5/Hsc70 complex is disrupted when Hsc70 activity is inhibited by a dominant‐negative (DN) point mutation, E175S. Western blot of immunoprecipitated DnaJC5 from HEK293T cells overexpressing WT or DN E175S Hsc70. DnaJC5 was immunoprecipitated by DnaJC5 antibody (Synaptic Systems). DnaJC5 was detected on Western blot by FLAG antibody.
F. Dot blot of tau levels in media of M17 neuroblastoma cells treated with YM‐01. Quantification of mean extracellular tau levels ± SEM, n = 6, *P < 0.05 one‐way analysis of variance with Tukey's multiple comparison post hoc analysis. Intracellular levels shown by Western blot. DnaJC5 was detected on Western blot by FLAG antibody.
G. Dot blot of tau levels in media of primary neurons from transgenic overexpressing tau P301L mice treated with YM‐01 (10 μM). FLAG‐DnaJC5 was transduced into neurons using AAV9. Quantification of mean extracellular tau levels ± SEM, n = 6, ***P < 0.001 one‐way analysis of variance with Tukey's multiple comparison post hoc analysis. DnaJC5 was detected on Western blot by FLAG antibody.
H. Schematic illustrating that the Hsc70/DnaJC5/tau complex can be disrupted by chemical (YM‐01) inhibition.
We then tested the effects of YM‐01 in neuronal cells overexpressing DnaJC5. M17 cells were treated with 10 μM YM‐01 for 6 h, and the media were analyzed by dot blot. In agreement with previously published studies, YM‐01 treatment reduced intracellular tau levels via proteasomal degradation (Abisambra et al, 2013) and also reduced DnaJC5‐mediated extracellular tau release (Fig 5F). Further, while AAV‐mediated DnaJC5 overexpression facilitated tau release in neurons from transgenic mice overexpressing mutant human P301L tau (Fig 5G), treating neurons with YM‐01 blocked this DnaJC5‐enhanced release (Fig 5G). Thus, disruption of the Hsc70/DnaJC5 complex reduced extracellular tau release in neuronal cells (Fig 5G).
Similarly, DnaJC5‐mediated tau release was reduced in a dose‐dependent manner in HEK293T cells following YM‐01 treatment (Fig 6A), confirming that this mechanism is shared among neuronal and non‐neuronal cell types. YM‐01 also disrupted the release of α‐synuclein caused by DnaJC5 (Fig 6B). While TDP‐43 release did not respond well to YM‐01 treatment (not shown), a drug that primarily acts in the cytosol (Abisambra et al, 2013), it may that the TDP‐43 client changes the Hsc70/DnaJC5 complex rendering it insensitive to YM‐01. This would be consistent with our previous work showing that client binding can control chaperone complex activity to some extent (Jinwal et al, 2013) and suggests the TDP‐43‐induced structural alterations in Hsc70 were rendered incompatible with YM‐01 binding. It could also indicate an entirely distinct process related to trafficking of cytosolic TDP‐43 that remains unknown, yet proceeds through a SNAP‐23‐mediated mechanism.
Source data are available online for this figure.
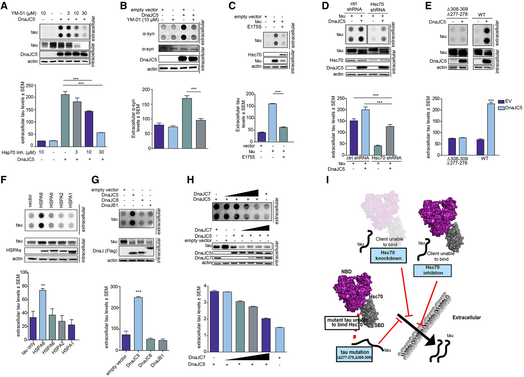
The Hsc70 chaperone is required for DnaJC5‐mediated release
A. Chemical inhibition of Hsc70 activity in HEK293T cells overexpressing FLAG‐DnaJC5 reduces extracellular tau levels as shown by dot blot. Intracellular levels are shown by Western blot; DnaJC5 was detected by FLAG antibody. Quantification of extracellular tau levels is shown as average ± SEM, n = 3, ***P < 0.001 one‐way analysis of variance with Tukey's multiple comparison post hoc analysis.
B. Chemical inhibition of Hsc70 activity in HEK293T cells overexpressing FLAG‐DnaJC5 reduces extracellular synuclein levels as shown by dot blot. Intracellular levels are shown by Western blot; DnaJC5 was detected by FLAG antibody. Quantification of extracellular synuclein levels is shown as average ± SEM, n = 3, ***P < 0.001 one‐way analysis of variance with Tukey's multiple comparison post hoc analysis.
C. Dominant‐negative Hsc70 E175S blocks tau release when overexpressed in HEK293T cells as shown by dot blot. Intracellular levels are shown by Western blot. Quantification of extracellular tau levels is shown as average ± SEM, n = 4, ***P < 0.001 one‐way analysis of variance with Tukey's multiple comparison post hoc analysis.
D. Knockdown of Hsc70 reduces extracellular tau release (dot blot) in HEK293T cells overexpressing FLAG‐DnaJC5. Intracellular levels are shown by Western blot; DnaJC5 was detected by FLAG antibody. Quantification of extracellular tau levels is shown as average ± SEM, n = 3, ***P < 0.001 one‐way analysis of variance with Tukey's multiple comparison post hoc analysis.
E. A mutant tau that does not bind Hsc70 is not released when FLAG‐DnaJC5 is overexpressed in HEK293T cells. Dot blot and quantification of extracellular tau levels are shown. Intracellular protein levels are shown with representative Western blot; DnaJC5 was detected by FLAG antibody. Data are mean ± SEM, n = 3, ***P < 0.001 one‐way analysis of variance with Tukey's multiple comparison post hoc analysis.
F. Dot blot of Hsp70 isoform overexpression effect on extracellular tau release in HEK293T cells. Intracellular protein levels are shown with representative Western blot. HSPA variants were detected with V5 antibody. Data are mean ± SEM, n = 3, **P < 0.01 one‐way analysis of variance with Tukey's multiple comparison post hoc analysis.
G. Dot blot of different FLAG‐DnaJ overexpression effect on extracellular tau release in HEK293T cells. Intracellular protein levels are shown with representative Western blot. DnaJ levels were detected by FLAG antibody. Data are mean ± SEM, n = 3, ***P < 0.001 one‐way analysis of variance with Tukey's multiple comparison post hoc analysis.
H. Dot blot of increasing FLAG‐DnaJC7 levels on FLAG‐DnaJC5 overexpression‐mediated extracellular tau release in HEK293T cells. Intracellular protein levels are shown with representative Western blot; DnaJ proteins were detected by FLAG antibody. Quantification of extracellular levels are mean ± SEM, n = 4.
I. Schematic representation of Hsp70 control of DnaJC5‐mediated tau release. When clients are unable to bind Hsc70, or if Hsc70 is inactive or knocked down, client proteins are sent for degradation instead of release. Thus, Hsc70 is important for upstream control of the DnaJC5‐mediated extracellular release.
The high transfection efficiency of HEK293T cells allowed for the overexpression of a dominant‐negative form of Hsc70 (E175S) that mimics Hsc70 when it is inhibited by YM‐01 (Fontaine et al, 2015b). This mutant also abrogated tau release by DnaJC5 (Fig 6C), highlighting that Hsc70 activity can control this DnaJC5‐mediated process for tau. To identify whether Hsc70 acted upstream of DnaJC5 in facilitating extracellular protein release, Hsc70 levels were knocked down via shRNA (Fig 6D). Reducing Hsc70 levels indeed blocked DnaJC5‐mediated extracellular tau release (Figs 6D and EV5). Finally, when tau was mutated to prevent its interaction with Hsc70 (Sarkar et al, 2008), tau release was reduced (Fig 6E), indicating that tau must be able to interact with Hsc70 in order to be released by the complex, and also confirming that DnaJC5 does not indiscriminately triage all overexpressed protein for release.
We next wondered whether other DnaJ/Hsp70 family complexes in addition to Hsc70 and DnaJC5 could also facilitate tau release. However, of the cytosolic Hsp70 variants, only Hsc70/HSPA8 facilitated tau release when overexpressed (Fig 6F). Similarly, while overexpression of other DnaJ proteins reduced intracellular tau levels, none facilitated tau release like DnaJC5 (Fig 6G). In fact, we suspected that shifting the balance of DnaJ proteins could also shift tau triage away from release and toward degradation. Indeed, increasing the expression of the pro‐degradation DnaJC7 dose‐dependently blocked DnaJC5‐mediated release, instead facilitating tau degradation (Fig 6H). Thus, the DnaJ and chaperone landscape within the cell not only controls protein folding and degradation, but also its release to the extracellular space (Fig 6I).
Discussion
Hsc70/DnaJ complexes are critical for mediating many aspects of the triage of neurodegenerative proteins, including their disaggregation (Gao et al, 2015; Nillegoda et al, 2015), stabilization (Abisambra et al, 2012), degradation (Jinwal et al, 2013; Fontaine et al, 2015b), and now, release. These findings suggest that neurodegenerative disease‐associated protein exocytosis from plasma and synaptic membranes is a regulated and physiological process that is still not well understood. The implication that chaperones, particularly the DnaJ/Hsc70 machinery, govern this process is not surprising.
These data illuminate a non‐canonical pathway to extracellular release mediated by a SNAP23‐dependent mechanism, suggesting a novel route for the release of tau from the neuron. SNARE proteins coordinate vesicle trafficking and exocytosis in all cells (Morelli et al, 2014; Rogers et al, 2014; Dubuke et al, 2015; Kuster et al, 2015; Zhu et al, 2015), and chaperones play an important role in several of these processes (Joglekar & Hay, 2005; Sharma et al, 2011). This has a number of important implications for understanding the propagation of pathological protein aggregates found in several neurodegenerative diseases. SNAP‐23 expression is critical for survival (Suh et al, 2011; Kaul et al, 2015), and found highly expressed in several tissues and both neuronal and non‐neuronal cells (Grant et al, 1999; Delgado‐Martínez et al, 2007; Mandolesi et al, 2009). While highly analogous to SNAP‐25, the SNARE involved in classical neurotransmitter release, SNAP‐23 is unique in that it cannot completely rescue SNAP‐25 release function in null mice and is not restricted to the synaptic active zone (Delgado‐Martínez et al, 2007). Thus, it is possible that extracellular protein release via a SNAP‐23 may arise in response to overwhelming protein burden of aggregation‐prone proteins. Hsc70 is known to direct neurodegenerative clients for degradation by both proteasomal and lysosomal mechanisms. In multicellular organisms, senescent cells in particular sequester misfolded protein aggregates for lysosomal‐mediated degradation. This pathway may become problematic if lysosome function becomes compromised (Fornai et al, 2008; Poehler et al, 2014; Bae et al, 2015) or the protein burden is too high, activating a non‐conventional secretion process, such as lysosomal exocytosis, or secretory autophagy (“exophagy”) (Broadwell & Balin, 1985; Ejlerskov et al, 2013). This release may be used as a mechanism of last resort to eject toxic multimers for processing by phagocytic cells. Over time, this degradation pathway itself may become overwhelmed, which then facilitates propagation of these disease proteins through both neurons and glial cells in the brain (Asai et al, 2015; Pearce et al, 2015).
But how neurodegenerative disease‐associated clients enter vesicles for release remains unclear. Since Hsc70 directly interacts with the plasma membrane (Arispe et al, 2002) and is known to facilitate the entry of client proteins into vesicular organelles (Bandyopadhyay et al, 2008), it is possible that Hsc70 (Fig 6D) is simply delivering neurodegenerative clients directly into the endosomal lumen for eventual extracellular sorting (Sahu et al, 2011). Whether this mechanism then directs a constructive or a destructive fate for neurodegenerative‐associated proteins remains unknown. It is possible that prionlike proteins are used by neurons to communicate with each other through a non‐genetic process (Li & Lindquist, 2000; Shorter & Lindquist, 2006), allowing for rapid communication about a changing environment within a network of multiple coexisting tissues. This process becomes pathogenic when neurodegenerative prionlike proteins misfold, allowing disease‐causing conformers to then propagate from neuron to neuron, or neuron–glia–neuron, a process that has been shown in S. cerevisiae and other model systems (Tuite et al, 2011; Frederick et al, 2014). It may be that Hsc70 chaperoning plays an integral role in this communication process, but this remains to be seen.
These data indicate for the first time that there is a unifying, chaperone‐dependent mechanism for the release of pathogenic proteins in human neurodegenerative diseases. Further work to delineate subtleties of this mechanism and whether it is for productive or destructive purposes will determine how it contributes to the propagation of these proteins through the brain.
Materials and Methods
Reagents, plasmids, and antibodies
Unless stated otherwise, all chemical reagents were purchased from Sigma‐Aldrich (St. Louis, MO, USA) including the Hsp70 inhibitor YM‐01. The following antibodies were purchased commercially: Hsc70 (Stressgen, Enzo Life Sciences, Farmingdale, NY, USA), tauH150, tau V20 (Santa Cruz Biotechnology, Santa Cruz, CA, USA), β‐actin, α‐synuclein, and M2‐Flag (Sigma‐Aldrich) and glyceraldehyde 3‐phosphate dehydrogenase (GAPDH), TDP‐43 (Cell Signaling Technologies, Danvers, MA, USA), SNAP25, synaptophysin, CSPα, SNAP23 (Synaptic Systems). Tau12 and Tau5 were a kind gift from the laboratory of Lester Binder, and PHF1 was a kind gift from Peter Davies.
For mammalian expression experiments, full‐length human Hsc70 and rat DnaJC5 (identical amino acid sequence to human DnaJC5) genes were cloned into pCMV6 (Origene, Rockville, MD, USA) vector with an N‐terminal FLAG tag to distinguish between endogenous and overexpressed isoforms. Plasmids for other HSPA isoforms were purchased from Addgene. WT 4R0N tau was cloned as previously described (Jinwal et al, 2013). WT, Q434R, and A315T TDP43 plasmids were a kind gift from Benjamin Wolozin. α‐Synuclein wt and A53T plasmids were a kind gift from Daniel Lee. Plasmids were cloned into pCMV6 before use for consistency and sequence verified before use. Mutations were introduced via site‐directed mutagenesis (Stratagene, La Jolla, CA, USA) and sequences verified before use.
Expression and purification of recombinant 15N‐labeled tau
Wild‐type 4R0N Tau in pET28a was purified as described previously (Fontaine et al, 2015b). Briefly, plasmids were transformed into E. coli OneShot BL21 Star (DE3) cells (Life Technologies, Carlsbad, CA, USA) and cultured in M9 minimal media supplemented with 1 g/l 15N‐ammonium chloride, 100 μM calcium chloride, 100 μM magnesium sulfate, 0.4% (w/v) glucose, and trace metals and vitamins, induced with 1 mM isopropyl β‐D‐1‐thiogalactopyranoside, and proteins were expressed at 37°C for 3 h. The cells were then harvested, and purification of protein from this resuspension was executed as described previously (Jinwal et al, 2013).
Mass spectroscopy
Media were collected from cells, concentrated using a 10,000 MWCO centrifugation filter (Millipore) then processed via filter‐aided sample preparation (FASP) as previously described (Wiśniewski et al, 2009; Bell‐Temin et al, 2013). After trypsin digestion using this procedure, samples were analyzed. Proteins were digested with trypsin (Promega) at 1:50 (w:w, enzyme:protein) overnight at 37°C. Peptides were desalted using C18 columns (The Nest Group) and dried in a vacuum centrifuge. Peptide samples were resuspended in 0.1% formic acid in H2O and analyzed on a Q‐Exactive Plus with a 50‐cm UPLC column using a 2‐h gradient (2–40% acetonitrile) on an EASY‐nLC 1000 system (Thermo Fisher). The data‐dependent mode of acquisition was utilized in which the top 10 most intense precursor ions were selected for collision‐induced dissociation over the course of a 180‐min linear HPLC gradient (to 40% acetonitrile). Dynamic exclusion was set for 45 s after one repeat count with a 50 exclusion list size. MS/MS spectra were extracted, and raw files were searched against the most current Mus musculus or Homo sapiens protein sequence database from UniprotKB using Maxquant (version 1.5.0.30) and Mascot Distiller (version 2.5.1.0) with 15N for quantification of labeled tau. Search parameters included the constant modification of cysteine by carbamidomethylation and variable modification of methionine oxidation. Statistical analysis was performed using Perseus software. Mascot score cutoffs were adjusted to achieve a false discovery rate of 1% for peptide and protein identification.
Cell culture, lysis, and immunoblotting
HEK293T and M17 cells were maintained, transfected, harvested, and immunoblotted as described previously (Dickey et al, 2006; Jinwal et al, 2013).
Collection of conditioned media from cultured cell, primary neurons, and slices
To collect cultured media, cells or slices were washed three times in PBS to remove serum proteins and incubated in dye‐free, serum‐free media for 6 h. After clearing debris by centrifugation at 1,467 g for 10 min, supernatants were transferred to a fresh tube, protease and phosphatase inhibitors added (EMD Millipore, Sigma‐Aldrich) and either processed for mass spectroscopy analysis, concentrated for Western blot analysis, or used directly for dot blot analysis.
Primary neurons
All procedures involving experimentation on animal subjects were done in accordance with the guidelines set forth by the Institutional Animal Care and Use Committee of the University of South Florida. Cspa+/− mice were a kind gift from Thomas Sudhof (Stanford University) and were maintained as described (Fernández‐Chacón et al, 2004). Primary neurons were isolated from E16 pups. Briefly, after euthanizing a pregnant dam, pups were extracted, brains removed, meninges removed, and cortices dissected in cold isotonic buffer. Following washing, cortices were minced, digested in trypsin, triturated, then resuspended in DMEM supplemented with 10% FBS, penicillin–streptomycin, and amphotericin B before plating on poly‐l‐lysine‐coated coverslips. The next day, the DMEM was exchanged for Neurobasal medium supplemented with Glutamax and B27 supplement (Life Technologies). For AAV transductions, AAV9 was prepared according to standard methods (Zolotukhin et al, 1999). Primary neurons were transduced at DIV4 with 5 μl AAV in PBS at 1011–1013 viral particles per μl. At DIV10, neurons were harvested for secreted tau and processed for Western blot as with HEK293T cells or for immunocytochemistry.
Organotypic slice culture and virus transduction
Organotypic cultures were prepared from wild‐type C57BL6 mice or Cspa+/+ and Cspa−/− litter mates at 14–21 days of age as previously described (Fontaine et al, 2015a,b). At least three litters, with at least three mice per genotype and mice of both sexes were used. DIV2 slices were incubated with 10 μl AAV9 DnaJC5‐Flag, or AAV9‐GFP at 1010 titer for 14 days. After transductions, slices were washed three times in cold PBS, scraped into lysis buffer (MPER; ThermoFisher) containing protease and phosphatase inhibitor cocktails, 50 μl per three sections), homogenized by pipetting then centrifuged for 20 min at 15,493 g to remove debris. Supernatants were adjusted for protein concentration and subjected to SDS–PAGE analysis. All Western blots are representative images of n = 3 animals, each culture containing 6–10 slices per animal.
siRNA‐ and shRNA‐mediated knockdown
HEK293T and M17 cells were co‐transfected with 40 nM siRNA (Dharmacon) or 2 μg shRNA (Sigma) in addition to 2 μg plasmid for overexpression as indicated. After 42 h, cells were then processed for collection of conditioned media and intracellular protein levels assayed by Western blot.
Hsp70 inhibitor treatment
HEK293T cells, M17 cells, and primary neurons were plated and transfected/transduced as indicated. At 42 h, cells were washed in HBSS and treated with 10 μM YM‐01 or vehicle control for 6 h prior to collection of conditioned media.
Immunocytochemistry
Primary neurons grown on coverslips were fixed in 4% paraformaldehyde in PBS, permeabilized, blocked, incubated in the appropriate primary antibodies overnight followed by appropriate Alexa‐Fluor‐conjugated secondary antibodies (Life Technologies). Coverslips were mounted on glass slides using ProLong antifade reagent (Life Technologies).
Microscopy and image analysis
All imaging was performed on an Olympus FV1200 MPE multiphoton laser scanning microscope. Optimal confocal z‐stack images (0.45 μm slices) were captured using a 60× objective from a minimum of four fields containing at least 10 neurons per condition and two independent primary neuron preps. Image analysis was performed using ImageJ. Briefly, z‐stacks were background subtracted, despeckled, and thresholds set in each channel to include regions of interest. For transduced primary neurons, masking was applied to include only neurons that expressed virus. To quantify within synapses, as second mask was applied for only the synaptic marker. These parameters were applied identically to all images and then analyzed with the colocalization plugin (Nakamura et al, 2007). Pearson's coefficients and mean red and green intensities were calculated.
Analysis of cell toxicity
HEK293T cells were seeded into 96‐well plates, transfected for 48 h then analyzed by Alamar Blue (Life Technologies), MTS (Promega), and LDH (ThermoFisher) methods per manufacturer's protocols.
mRNA analysis
Forty‐eight hours after transfection with indicated plasmids, the total RNA was extracted from the cells using TRIzol reagent (Life Technologies) according to the instruction and digested with RNase‐free DNase I (New England Biolabs). cDNA was prepared through reverse transcription (RT) using the iScript cDNA Synthesis Kit (Bio‐Rad), and qPCR was conducted using SYBR Green PCR Master Mix (Applied Biosystems). Triplicate PCRs were conducted, and glyceraldehyde 3‐phosphate dehydrogenase (GAPDH) mRNA expression was analyzed for each sample in parallel. The primers used for Tau are 5′‐caagatcggctccactgaga‐3′ (forward) and 5′‐caagatcggctccactgagaa‐3′ (reverse) and for GAPDH are ‘5‐catgttcgtcatgggtgtgaa‐3′ (forward) and 5′‐cacagtcttctgggtggcagt‐3′ (reverse). Data were analyzed according to the 2−ΔΔCt method (Livak & Schmittgen, 2001).
Statistical analyses
Statistical analyses were performed by one‐way ANOVA tests with Tukey's post hoc analyses, using GraphPad Prism 5.0 software. Any data more than two standard deviations from the mean were excluded.
References
Abisambra JF, Jinwal UK, Suntharalingam A, Arulselvam K, Brady S, Cockman M, Jin Y, Zhang B, Dickey CA (2012) DnaJA1 antagonizes constitutive Hsp70‐mediated stabilization of tau. J Mol Biol 421: 653–661
Abisambra J, Jinwal UK, Miyata Y, Rogers J, Blair L, Li X, Seguin SP, Wang L, Jin Y, Bacon J, Brady S, Cockman M, Guidi C, Zhang J, Koren J, Young ZT, Atkins CA, Zhang B, Lawson LY, Weeber EJ et al (2013) Allosteric heat shock protein 70 inhibitors rapidly rescue synaptic plasticity deficits by reducing aberrant tau. Biol Psychiatry 74: 367–374
Arispe N, Doh M, De Maio A (2002) Lipid interaction differentiates the constitutive and stress‐induced heat shock proteins Hsc70 and Hsp70. Cell Stress Chaperones 7: 330–338
Asai H, Ikezu S, Tsunoda S, Medalla M, Luebke J, Haydar T, Wolozin B, Butovsky O, Kügler S, Ikezu T (2015) Depletion of microglia and inhibition of exosome synthesis halt tau propagation. Nat Neurosci 18: 1584–1593
Auluck PK, Chan HYE, Trojanowski JQ, Lee VMY, Bonini NM (2002) Chaperone suppression of alpha‐synuclein toxicity in a Drosophila model for Parkinson's disease. Science 295: 865–868
Babcock DT, Ganetzky B (2015) Transcellular spreading of huntingtin aggregates in the Drosophila brain. Proc Natl Acad Sci USA 112: E5427–E5433
Bae E‐J, Yang NY, Lee C, Kim S, Lee H‐J, Lee S‐J (2015) Haploinsufficiency of cathepsin D leads to lysosomal dysfunction and promotes cell‐to‐cell transmission of α‐synuclein aggregates. Cell Death Dis 6: e1901
Bandyopadhyay U, Kaushik S, Varticovski L, Cuervo AM (2008) The chaperone‐mediated autophagy receptor organizes in dynamic protein complexes at the lysosomal membrane. Mol Cell Biol 28: 5747–5763
Beckmann RP, Mizzen LE, Welch WJ (1990) Interaction of Hsp 70 with newly synthesized proteins: implications for protein folding and assembly. Science 248: 850–854
Bell‐Temin H, Zhang P, Chaput D, King MA, You M, Liu B, Stevens SM (2013) Quantitative proteomic characterization of ethanol‐responsive pathways in rat microglial cells. J Proteome Res 12: 2067–2077
Bercovich B, Stancovski I, Mayer A, Blumenfeld N, Laszlo A, Schwartz AL, Ciechanover A (1997) Ubiquitin‐dependent degradation of certain protein substrates in vitro requires the molecular chaperone Hsc70. J Biol Chem 272: 9002–9010
Black MM, Chestnut MH, Pleasure IT, Keen JH (1991) Stable clathrin: uncoating protein (hsc70) complexes in intact neurons and their axonal transport. J Neurosci Off J Soc Neurosci 11: 1163–1172
Boddul SV, Meng J, Dolly JO, Wang J (2014) SNAP‐23 and VAMP‐3 contribute to the release of IL‐6 and TNFα from a human synovial sarcoma cell line. FEBS J 281: 750–765
Braak H, Braak E (1991) Neuropathological stageing of Alzheimer‐related changes. Acta Neuropathol 82: 239–259
Brettschneider J, Arai K, Del Tredici K, Toledo JB, Robinson JL, Lee EB, Kuwabara S, Shibuya K, Irwin DJ, Fang L, Van Deerlin VM, Elman L, McCluskey L, Ludolph AC, Lee VM‐Y, Braak H, Trojanowski JQ (2014) TDP‐43 pathology and neuronal loss in amyotrophic lateral sclerosis spinal cord. Acta Neuropathol 128: 423–437
Broadwell RD, Balin BJ (1985) Endocytic and exocytic pathways of the neuronal secretory process and trans‐synaptic transfer of wheat germ agglutinin‐horseradish peroxidase in vivo. J Comp Neurol 242: 632–650
Burré J, Sharma M, Tsetsenis T, Buchman V, Etherton MR, Südhof TC (2010) Alpha‐synuclein promotes SNARE‐complex assembly in vivo and in vitro. Science 329: 1663–1667
Calafate S, Buist A, Miskiewicz K, Vijayan V, Daneels G, de Strooper B, de Wit J, Verstreken P, Moechars D (2015) Synaptic contacts enhance cell‐to‐cell tau pathology propagation. Cell Rep 11: 1176–1183
de Calignon A, Polydoro M, Suárez‐Calvet M, William C, Adamowicz DH, Kopeikina KJ, Pitstick R, Sahara N, Ashe KH, Carlson GA, Spires‐Jones TL, Hyman BT (2012) Propagation of tau pathology in a model of early Alzheimer's disease. Neuron 73: 685–697
Chamberlain LH, Burgoyne RD (1997) The molecular chaperone function of the secretory vesicle cysteine string proteins. J Biol Chem 272: 31420–31426
Chamberlain LH, Burgoyne RD (1998) Cysteine string protein functions directly in regulated exocytosis. Mol Biol Cell 9: 2259–2267
Chandra S, Gallardo G, Fernández‐Chacón R, Schlüter OM, Südhof TC (2005) Alpha‐synuclein cooperates with CSP alpha in preventing neurodegeneration. Cell 123: 383–396
Chappell TG, Welch WJ, Schlossman DM, Palter KB, Schlesinger MJ, Rothman JE (1986) Uncoating ATPase is a member of the 70 kilodalton family of stress proteins. Cell 45: 3–13
Cheetham ME, Brion JP, Anderton BH (1992) Human homologues of the bacterial heat‐shock protein DnaJ are preferentially expressed in neurons. Biochem J 284(Pt 2): 469–476
Cheetham ME, Anderton BH, Jackson AP (1996) Inhibition of hsc70‐catalysed clathrin uncoating by HSJ1 proteins. Biochem J 319(Pt 1): 103–108
Chiang N, Hsiao Y‐T, Yang H‐J, Lin Y‐C, Lu J‐C, Wang C‐T (2014) Phosphomimetic mutation of cysteine string protein‐α increases the rate of regulated exocytosis by modulating fusion pore dynamics in PC12 cells. PLoS ONE 9: e99180
Delgado‐Martínez I, Nehring RB, Sørensen JB (2007) Differential abilities of SNAP‐25 homologs to support neuronal function. J Neurosci Off J Soc Neurosci 27: 9380–9391
Desplats P, Lee H‐J, Bae E‐J, Patrick C, Rockenstein E, Crews L, Spencer B, Masliah E, Lee S‐J (2009) Inclusion formation and neuronal cell death through neuron‐to‐neuron transmission of α‐synuclein. Proc Natl Acad Sci USA 106: 13010–13015
Dickey CA, Ash P, Klosak N, Lee WC, Petrucelli L, Hutton M, Eckman CB (2006) Pharmacologic reductions of total tau levels; implications for the role of microtubule dynamics in regulating tau expression. Mol Neurodegener 1: 6
Dou F, Netzer WJ, Tanemura K, Li F, Hartl FU, Takashima A, Gouras GK, Greengard P, Xu H (2003) Chaperones increase association of tau protein with microtubules. Proc Natl Acad Sci USA 100: 721–726
Dubuke ML, Maniatis S, Shaffer SA, Munson M (2015) The exocyst subunit Sec6 interacts with assembled exocytic SNARE complexes. J Biol Chem 290: 28245–28256
Dujardin S, Lécolle K, Caillierez R, Bégard S, Zommer N, Lachaud C, Carrier S, Dufour N, Aurégan G, Winderickx J, Hantraye P, Déglon N, Colin M, Buée L (2014) Neuron‐to‐neuron wild‐type Tau protein transfer through a trans‐synaptic mechanism: relevance to sporadic tauopathies. Acta Neuropathol Commun 2: 14
Ejlerskov P, Rasmussen I, Nielsen TT, Bergström A‐L, Tohyama Y, Jensen PH, Vilhardt F (2013) Tubulin polymerization‐promoting protein (TPPP/p25α) promotes unconventional secretion of α‐synuclein through exophagy by impairing autophagosome‐lysosome fusion. J Biol Chem 288: 17313–17335
Evans GJ, Wilkinson MC, Graham ME, Turner KM, Chamberlain LH, Burgoyne RD, Morgan A (2001) Phosphorylation of cysteine string protein by protein kinase A. Implications for the modulation of exocytosis. J Biol Chem 276: 47877–47885
Fernández‐Chacón R, Wölfel M, Nishimune H, Tabares L, Schmitz F, Castellano‐Muñoz M, Rosenmund C, Montesinos ML, Sanes JR, Schneggenburger R, Südhof TC (2004) The synaptic vesicle protein CSP alpha prevents presynaptic degeneration. Neuron 42: 237–251
Finka A, Goloubinoff P (2013) Proteomic data from human cell cultures refine mechanisms of chaperone‐mediated protein homeostasis. Cell Stress Chaperones 18: 591–605
Fontaine SN, Martin MD, Akoury E, Assimon VA, Borysov S, Nordhues BA, Sabbagh JJ, Cockman M, Gestwicki JE, Zweckstetter M, Dickey CA (2015a) The active Hsc70/tau complex can be exploited to enhance tau turnover without damaging microtubule dynamics. Hum Mol Genet 24: 3971–3981
Fontaine SN, Rauch JN, Nordhues BA, Assimon VA, Stothert AR, Jinwal UK, Sabbagh JJ, Chang L, Stevens SM, Zuiderweg ERP, Gestwicki JE, Dickey CA (2015b) Isoform‐selective genetic inhibition of constitutive cytosolic Hsp70 activity promotes client tau degradation using an altered co‐chaperone complement. J Biol Chem 290: 13115–13127
Fornai F, Longone P, Cafaro L, Kastsiuchenka O, Ferrucci M, Manca ML, Lazzeri G, Spalloni A, Bellio N, Lenzi P, Modugno N, Siciliano G, Isidoro C, Murri L, Ruggieri S, Paparelli A (2008) Lithium delays progression of amyotrophic lateral sclerosis. Proc Natl Acad Sci USA 105: 2052–2057
Frank SPC, Thon K‐P, Bischoff SC, Lorentz A (2011) SNAP‐23 and syntaxin‐3 are required for chemokine release by mature human mast cells. Mol Immunol 49: 353–358
Frederick KK, Debelouchina GT, Kayatekin C, Dorminy T, Jacavone AC, Griffin RG, Lindquist S (2014) Distinct prion strains are defined by amyloid core structure and chaperone binding site dynamics. Chem Biol 21: 295–305
Gao X, Carroni M, Nussbaum‐Krammer C, Mogk A, Nillegoda NB, Szlachcic A, Guilbride DL, Saibil HR, Mayer MP, Bukau B (2015) Human Hsp70 disaggregase reverses Parkinson's‐linked α‐synuclein amyloid fibrils. Mol Cell 59: 781–793
García‐Junco‐Clemente P, Cantero G, Gómez‐Sánchez L, Linares‐Clemente P, Martínez‐López JA, Luján R, Fernández‐Chacón R (2010) Cysteine string protein‐alpha prevents activity‐dependent degeneration in GABAergic synapses. J Neurosci Off J Soc Neurosci 30: 7377–7391
Graham ME, Burgoyne RD (2000) Comparison of cysteine string protein (Csp) and mutant alpha‐SNAP overexpression reveals a role for csp in late steps of membrane fusion in dense‐core granule exocytosis in adrenal chromaffin cells. J Neurosci Off J Soc Neurosci 20: 1281–1289
Grant NJ, Hepp R, Krause W, Aunis D, Oehme P, Langley K (1999) Differential expression of SNAP‐25 isoforms and SNAP‐23 in the adrenal gland. J Neurochem 72: 363–372
Guo JL, Lee VM‐Y (2011) Seeding of normal Tau by pathological Tau conformers drives pathogenesis of Alzheimer‐like tangles. J Biol Chem 286: 15317–15331
Hansen C, Angot E, Bergström A‐L, Steiner JA, Pieri L, Paul G, Outeiro TF, Melki R, Kallunki P, Fog K, Li J‐Y, Brundin P (2011) α‐Synuclein propagates from mouse brain to grafted dopaminergic neurons and seeds aggregation in cultured human cells. J Clin Invest 121: 715–725
Hennessy F, Cheetham ME, Dirr HW, Blatch GL (2000) Analysis of the levels of conservation of the J domain among the various types of DnaJ‐like proteins. Cell Stress Chaperones 5: 347–358
Holmes BB, DeVos SL, Kfoury N, Li M, Jacks R, Yanamandra K, Ouidja MO, Brodsky FM, Marasa J, Bagchi DP, Kotzbauer PT, Miller TM, Papy‐Garcia D, Diamond MI (2013) Heparan sulfate proteoglycans mediate internalization and propagation of specific proteopathic seeds. Proc Natl Acad Sci USA 110: E3138–E3147
Iba M, McBride JD, Guo JL, Zhang B, Trojanowski JQ, Lee VM‐Y (2015) Tau pathology spread in PS19 tau transgenic mice following locus coeruleus (LC) injections of synthetic tau fibrils is determined by the LC's afferent and efferent connections. Acta Neuropathol 130: 349–362
Jacobsson G, Meister B (1996) Molecular components of the exocytotic machinery in the rat pituitary gland. Endocrinology 137: 5344–5356
Jinwal UK, O'Leary JC, Borysov SI, Jones JR, Li Q, Koren J, Abisambra JF, Vestal GD, Lawson LY, Johnson AG, Blair LJ, Jin Y, Miyata Y, Gestwicki JE, Dickey CA (2010) Hsc70 rapidly engages tau after microtubule destabilization. J Biol Chem 285: 16798–16805
Jinwal UK, Akoury E, Abisambra JF, O'Leary JC, Thompson AD, Blair LJ, Jin Y, Bacon J, Nordhues BA, Cockman M, Zhang J, Li P, Zhang B, Borysov S, Uversky VN, Biernat J, Mandelkow E, Gestwicki JE, Zweckstetter M, Dickey CA (2013) Imbalance of Hsp70 family variants fosters tau accumulation. FASEB J Off Publ Fed Am Soc Exp Biol 27: 1450–1459
Joglekar AP, Hay JC (2005) Evidence for regulation of ER/Golgi SNARE complex formation by hsc70 chaperones. Eur J Cell Biol 84: 529–542
Kassubek J, Müller H‐P, Del Tredici K, Brettschneider J, Pinkhardt EH, Lulé D, Böhm S, Braak H, Ludolph AC (2014) Diffusion tensor imaging analysis of sequential spreading of disease in amyotrophic lateral sclerosis confirms patterns of TDP‐43 pathology. Brain J Neurol 137: 1733–1740
Kaul S, Mittal SK, Feigenbaum L, Kruhlak MJ, Roche PA (2015) Expression of the SNARE protein SNAP‐23 is essential for cell survival. PLoS ONE 10: e0118311
Kean MJ, Williams KC, Skalski M, Myers D, Burtnik A, Foster D, Coppolino MG (2009) VAMP3, syntaxin‐13 and SNAP23 are involved in secretion of matrix metalloproteinases, degradation of the extracellular matrix and cell invasion. J Cell Sci 122: 4089–4098
Kuster A, Nola S, Dingli F, Vacca B, Gauchy C, Beaujouan J‐C, Nunez M, Moncion T, Loew D, Formstecher E, Galli T, Proux‐Gillardeaux V (2015) The Q‐soluble‐N‐ethylmaleimide‐sensitive factor attachment protein receptor (Q‐SNARE) SNAP‐47 regulates trafficking of selected vesicle‐associated membrane proteins (VAMPs). J Biol Chem 290: 28056–28069
Li L, Lindquist S (2000) Creating a protein‐based element of inheritance. Science 287: 661–664
Liu L, Drouet V, Wu JW, Witter MP, Small SA, Clelland C, Duff K (2012) Trans‐synaptic spread of tau pathology in vivo. PLoS ONE 7: e31302
Livak KJ, Schmittgen TD (2001) Analysis of relative gene expression data using real‐time quantitative PCR and the 2(‐Delta Delta C(T)) method. Methods San Diego Calif 25: 402–408
Mandolesi G, Vanni V, Cesa R, Grasselli G, Puglisi F, Cesare P, Strata P (2009) Distribution of the SNAP25 and SNAP23 synaptosomal‐associated protein isoforms in rat cerebellar cortex. Neuroscience 164: 1084–1096
Masuda‐Suzukake M, Nonaka T, Hosokawa M, Oikawa T, Arai T, Akiyama H, Mann DMA, Hasegawa M (2013) Prion‐like spreading of pathological α‐synuclein in brain. Brain 136(pt 4): 1128–1138
Medina M, Avila J (2014) The role of extracellular tau in neurofibrillary pathology. Front Cell Neurosci 8: 113
Mendez M, Gaisano HY (2013) Role of the SNARE protein SNAP23 on cAMP‐stimulated renin release in mouse juxtaglomerular cells. Am J Physiol Renal Physiol 304: F498–F504
Monsellier E, Redeker V, Ruiz‐Arlandis G, Bousset L, Melki R (2015) Molecular interaction between the chaperone Hsc70 and the N‐terminal flank of huntingtin exon 1 modulates aggregation. J Biol Chem 290: 2560–2576
Morelli E, Ginefra P, Mastrodonato V, Beznoussenko GV, Rusten TE, Bilder D, Stenmark H, Mironov AA, Vaccari T (2014) Multiple functions of the SNARE protein Snap29 in autophagy, endocytic, and exocytic trafficking during epithelial formation in Drosophila. Autophagy 10: 2251–2268
Nakamura K, Watakabe A, Hioki H, Fujiyama F, Tanaka Y, Yamamori T, Kaneko T (2007) Transiently increased colocalization of vesicular glutamate transporters 1 and 2 at single axon terminals during postnatal development of mouse neocortex: a quantitative analysis with correlation coefficient. Eur J Neurosci 26: 3054–3067
Nillegoda NB, Kirstein J, Szlachcic A, Berynskyy M, Stank A, Stengel F, Arnsburg K, Gao X, Scior A, Aebersold R, Guilbride DL, Wade RC, Morimoto RI, Mayer MP, Bukau B (2015) Crucial HSP70 co‐chaperone complex unlocks metazoan protein disaggregation. Nature 524: 247–251
Pearce MMP, Spartz EJ, Hong W, Luo L, Kopito RR (2015) Prion‐like transmission of neuronal huntingtin aggregates to phagocytic glia in the Drosophila brain. Nat Commun 6: 6768
Pecho‐Vrieseling E, Rieker C, Fuchs S, Bleckmann D, Esposito MS, Botta P, Goldstein C, Bernhard M, Galimberti I, Müller M, Lüthi A, Arber S, Bouwmeester T, van der Putten H, Di Giorgio FP (2014) Transneuronal propagation of mutant huntingtin contributes to non‐cell autonomous pathology in neurons. Nat Neurosci 17: 1064–1072
Pemberton S, Madiona K, Pieri L, Kabani M, Bousset L, Melki R (2011) Hsc70 protein interaction with soluble and fibrillar alpha‐synuclein. J Biol Chem 286: 34690–34699
Poehler A‐M, Xiang W, Spitzer P, May VEL, Meixner H, Rockenstein E, Chutna O, Outeiro TF, Winkler J, Masliah E, Klucken J (2014) Autophagy modulates SNCA/α‐synuclein release, thereby generating a hostile microenvironment. Autophagy 10: 2171–2192
Polydoro M, Dzhala VI, Pooler AM, Nicholls SB, McKinney AP, Sanchez L, Pitstick R, Carlson GA, Staley KJ, Spires‐Jones TL, Hyman BT (2014) Soluble pathological tau in the entorhinal cortex leads to presynaptic deficits in an early Alzheimer's disease model. Acta Neuropathol 127: 257–270
Pooler AM, Phillips EC, Lau DHW, Noble W, Hanger DP (2013) Physiological release of endogenous tau is stimulated by neuronal activity. EMBO Rep 14: 389–394
Rao SK, Huynh C, Proux‐Gillardeaux V, Galli T, Andrews NW (2004) Identification of SNAREs involved in synaptotagmin VII‐regulated lysosomal exocytosis. J Biol Chem 279: 20471–20479
Rogers JV, McMahon C, Baryshnikova A, Hughson FM, Rose MD (2014) ER‐associated retrograde SNAREs and the Dsl1 complex mediate an alternative, Sey1p‐independent homotypic ER fusion pathway. Mol Biol Cell 25: 3401–3412
Rousaki A, Miyata Y, Jinwal UK, Dickey CA, Gestwicki JE, Zuiderweg ERP (2011) Allosteric drugs: the interaction of antitumor compound MKT‐077 with human Hsp70 chaperones. J Mol Biol 411: 614–632
Rozas JL, Gómez‐Sánchez L, Mircheski J, Linares‐Clemente P, Nieto‐González JL, Vázquez ME, Luján R, Fernández‐Chacón R (2012) Motorneurons require cysteine string protein‐α to maintain the readily releasable vesicular pool and synaptic vesicle recycling. Neuron 74: 151–165
Ruiz R, Casañas JJ, Südhof TC, Tabares L (2008) Cysteine string protein‐alpha is essential for the high calcium sensitivity of exocytosis in a vertebrate synapse. Eur J Neurosci 27: 3118–3131
Sahu R, Kaushik S, Clement CC, Cannizzo ES, Scharf B, Follenzi A, Potolicchio I, Nieves E, Cuervo AM, Santambrogio L (2011) Microautophagy of cytosolic proteins by late endosomes. Dev Cell 20: 131–139
Sarkar M, Kuret J, Lee G (2008) Two motifs within the tau microtubule‐binding domain mediate its association with the hsc70 molecular chaperone. J Neurosci Res 86: 2763–2773
Seagar M, Lévêque C, Charvin N, Marquèze B, Martin‐Moutot N, Boudier JA, Boudier JL, Shoji‐Kasai Y, Sato K, Takahashi M (1999) Interactions between proteins implicated in exocytosis and voltage‐gated calcium channels. Philos Trans R Soc Lond B Biol Sci 354: 289–297
Sharma M, Burré J, Südhof TC (2011) CSPα promotes SNARE‐complex assembly by chaperoning SNAP‐25 during synaptic activity. Nat Cell Biol 13: 30–39
Sharma M, Burré J, Bronk P, Zhang Y, Xu W, Südhof TC (2012) CSPα knockout causes neurodegeneration by impairing SNAP‐25 function. EMBO J 31: 829–841
Shorter J, Lindquist S (2006) Destruction or potentiation of different prions catalyzed by similar Hsp104 remodeling activities. Mol Cell 23: 425–438
Spillantini MG, Schmidt ML, Lee VM, Trojanowski JQ, Jakes R, Goedert M (1997) Alpha‐synuclein in Lewy bodies. Nature 388: 839–840
Suh YH, Yoshimoto‐Furusawa A, Weih KA, Tessarollo L, Roche KW, Mackem S, Roche PA (2011) Deletion of SNAP‐23 results in pre‐implantation embryonic lethality in mice. PLoS ONE 6: e18444
Tiwari SS, d'Orange M, Troakes C, Shurovi BN, Engmann O, Noble W, Hortobágyi T, Giese KP (2015) Evidence that the presynaptic vesicle protein CSP alpha is a key player in synaptic degeneration and protection in Alzheimer's disease. Mol Brain 8: 6
Tuite MF, Marchante R, Kushnirov V (2011) Fungal prions: structure, function and propagation. In Prion Proteins, Tatzelt J (ed.), pp 257–298. Berlin, Heidelberg: Springer Available at: http://link.springer.com/chapter/10.1007/128_2011_172 [Accessed September 30, 2015]
Umbach JA, Gundersen CB (1997) Evidence that cysteine string proteins regulate an early step in the Ca2+‐dependent secretion of neurotransmitter at Drosophila neuromuscular junctions. J Neurosci Off J Soc Neurosci 17: 7203–7209
Wegmann S, Maury EA, Kirk MJ, Saqran L, Roe A, DeVos SL, Nicholls S, Fan Z, Takeda S, Cagsal‐Getkin O, William CM, Spires‐Jones TL, Pitstick R, Carlson GA, Pooler AM, Hyman BT (2015) Removing endogenous tau does not prevent tau propagation yet reduces its neurotoxicity. EMBO J 34: 3028–3041
Weng N, Baumler MD, Thomas DDH, Falkowski MA, Swayne LA, Braun JEA, Groblewski GE (2009) Functional role of J domain of cysteine string protein in Ca2+‐dependent secretion from acinar cells. Am J Physiol Gastrointest Liver Physiol 296: G1030–G1039
Wiśniewski JR, Zougman A, Nagaraj N, Mann M (2009) Universal sample preparation method for proteome analysis. Nat Methods 6: 359–362
Yamada K, Holth JK, Liao F, Stewart FR, Mahan TE, Jiang H, Cirrito JR, Patel TK, Hochgräfe K, Mandelkow E‐M, Holtzman DM (2014) Neuronal activity regulates extracellular tau in vivo. J Exp Med 211: 387–393
Yu A, Shibata Y, Shah B, Calamini B, Lo DC, Morimoto RI (2014) Protein aggregation can inhibit clathrin‐mediated endocytosis by chaperone competition. Proc Natl Acad Sci USA 111: E1481–E1490
Zhu Q, Yamakuchi M, Lowenstein CJ (2015) SNAP23 regulates endothelial exocytosis of von willebrand factor. PLoS ONE 10: e0118737
Zolotukhin S, Byrne BJ, Mason E, Zolotukhin I, Potter M, Chesnut K, Summerford C, Samulski RJ, Muzyczka N (1999) Recombinant adeno‐associated virus purification using novel methods improves infectious titer and yield. Gene Ther 6: 973–985
Acknowledgements
The authors wish to thank Thomas Südhof (Stanford University) for the Cspa+/− mouse line and Joe Abisambra (University of Kentucky). This material is the result of work supported with resources and the use of facilities at the James A. Haley Veteran's Hospital. The contents of this publication do not represent the views of the Department of Veterans Affairs or the United States Government. This work was supported by NS073899 and BX001637 to C.A.D.
Author information
Authors and Affiliations
Contributions
SNF and CAD designed study, analyzed and interpreted results, and wrote the manuscript. SNF and JJS performed microscopy and imaging analysis. SNF, MDM, JJS, DZ, ARS, MK, and JHT performed cell biology experiments. SNF, AL, LJB, LS, JB, and JHT prepared primary and organotypic cultures. AD and DZ prepared AAV. SNF, BAN, DC, and SMS performed and analyzed mass spectroscopy experiments.
Corresponding authors
Ethics declarations
The authors declare that they have no conflict of interest.
Additional information
The EMBO Journal (2016) 35: 1537–1549
Supplementary Information
EV1
Tau is detected in the secretome of DnaJC5‐expressing cells only
A, B Extracted ion chromatographs of DnaJC5‐overexpressing cells compared to control within the same time and mass window. Tau peptide is only detected in the 15N recombinant standard; no endogenous tau is shown. Overlay of DnaJC5 (blue) and control (red) peak intensities indicates that endogenous peptide is only detected in DnaJC5‐expressing cells.
EV2
DnaJC5 does not decrease mRNA levels, proteasomal turnover, or cell toxicity
A. mRNA levels of human tau, α‐synuclein, and TDP‐43 mRNA expression in HEK293T cells overexpressing FLAG‐DnaJC5 at 24 and 48 h post‐transfection. Data are mean ± SEM and are representative of three independent repeats.
B. Proteasome inhibition does not block FLAG‐DnaJC5‐mediated tau release. Cells were treated for 6 h with the proteasome inhibitor epoxomicin. Extracellular protein levels were analyzed by dot blot (quantification below, mean ± SEM, n = 3), and intracellular proteins levels were analyzed by Western blot; DnaJC5 was detected by FLAG antibody.
C. DnaJC5 overexpression does not cause cell toxicity. Cytotoxicity was analyzed using LDH, MTS, and Alamar Blue assays performed 48 h post‐transfection on HEK293T cells overexpressing FLAG‐DnaJC5 and tau. Data are mean ± SEM, n = 8.
D. Wild‐type Ataxin‐3 (25Q) is not released by DnaJC5. Media dot blot from HEK293T cells overexpressing tau or ATX325Q‐myc with DnaJC5 and DnaJC8 as a control.
EV3
Tau levels are reduced in DnaJC5‐overexpressing synapses
A. Confocal micrographs of tau (red pseudocolor) and SNAP25 (green pseudocolor) colocalization (merged image) in primary neurons overexpressing GFP‐AAV9 or DnaJC5‐AAV9. Only neurons overexpressing virus were imaged. Boxed areas are 5× digital zoom on a 60× lens shown below. Scale bars are 20 μm and 5 μm (insets).
B. Quantification of tau–SNAP25 colocalization (mean Pearson's coefficient ± SEM, n = 16, *P < 0.05 by one‐way analysis of variance with Tukey's multiple comparisons post hoc analysis).
C. Quantification of tau intensity ± SEM, n = 16, *P < 0.05 by one‐way analysis of variance with Tukey's multiple comparisons post hoc analysis in SNAP25 colocalization experiment.
D. Confocal micrographs of tau (red pseudocolor) and synaptophysin (green pseudocolor) colocalization (merged image) in primary neurons overexpressing GFP‐AAV9 or DnaJC5‐AAV9. Only neurons overexpressing virus were imaged. Boxed areas are 5× digital zoom on a 60× lens shown below. Scale bars are 20 μm and 5 μm (insets).
E. Quantification of tau–synaptophysin colocalization (mean Pearson's coefficient ± SEM, n = 14, **P < 0.01 by one‐way analysis of variance with Tukey's multiple comparisons post hoc analysis).
F. Quantification of tau intensity ± SEM, n = 16, *P < 0.05 by one‐way analysis of variance with Tukey's multiple comparisons post hoc analysis in synaptophysin colocalization experiment.
EV4
Subcellular localization of TDP‐43, α‐synuclein, and tau
M17 neuroblastoma cells were transfected with TDP‐43, α‐synuclein, and tau (green, all panels) co‐expressed with empty vector or DnaJC5 and counterstained with DAPI (blue, all panels). Images were taken with a 60× objective. At least 10 fields containing 5 or more positive cells were imaged. Scale bar represents 20 μm.
Rights and permissions
Copyright: The Authors
About this article
Cite this article
Fontaine, S.N., Zheng, D., Sabbagh, J.J. et al. DnaJ/Hsc70 chaperone complexes control the extracellular release of neurodegenerative‐associated proteins. EMBO J 35, 1537–1549 (2016). https://doi.org/10.15252/embj.201593489
Received:
Revised:
Accepted:
Published:
Issue date:
DOI: https://doi.org/10.15252/embj.201593489