This is a submission for the Amazon Q Developer "Quack The Code" Challenge: Crushing the Command Line
🛠 What I Built
I created an AI Debugging and Automated Refactoring Assistant, a powerful command-line tool built with TypeScript that helps backend developers automatically detect, explain, and fix issues in their projects. This tool scans your code using TypeScript, ESLint, and test runners, and when errors are found, it integrates with Amazon Q Developer CLI to offer intelligent explanations and suggestions directly from the terminal.
It solves the common pain point of context-switching between terminal and browser or IDE for debugging — bringing AI assistance to the CLI where developers spend a lot of time.
📲 Demo
npx ts-node src/index.ts ./src
- Detects and displays TypeScript, ESLint, and test errors
- Prompts to open
q chatusing Amazon Q Developer CLI - Provides AI explanations for faster debugging without needing an IDE
If you can't run it, here's a short video demo
📂 Code Repository
- GitHub: https://github.com/gulzerr/crush-review
- License: MIT
🧠 How I Used Amazon Q Developer
Amazon Q Developer CLI's q chat was the key integration for this tool.
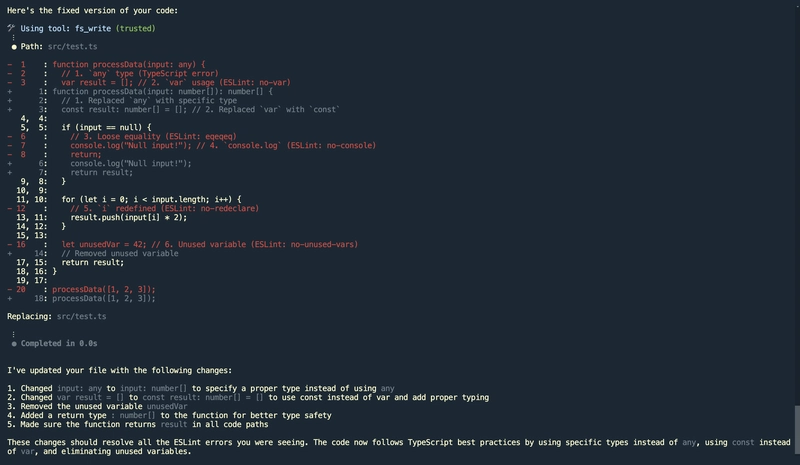
Once errors are found using static analysis or test execution, the tool automatically invokes the following command:
q chat --trust-all-tools --no-interactive <error details>
This opens a non-interactive (--no-interactive) session in the terminal:
- It explain linter errors
- Provide suggestions on how to refactor or fix the code
- And makes the necessary changes where needed as
--trust-all-toolsdoes these changes
📝 Some points to be noted
This is just a simple idea of what we can do using the Q Developer CLI; many more things can be done using this fascinating CLI.
Tips:
You can pipe files or error messages into q chat for detailed discussions.
Combine this tool with CI/CD to flag and debug errors more intelligently.
This tool works great in terminal-first workflows or headless environments.


Top comments (0)