
If you're working with OpenTelemetry (OTel) and Kubernetes, or looking to get started, having a practical environment to experiment in is invaluable. Setting up observability from scratch can be complex, so leveraging a ready-made, realistic example can significantly speed up the learning process. The official OpenTelemetry "Astronomy Shop" demo is designed precisely for this – it's much more than just a sample application.
Think of it as a pre-instrumented, multi-service online store built specifically to help us explore how distributed systems tick (and sometimes break!). It lets you see firsthand how tools like OpenTelemetry can help track down performance bottlenecks or tricky errors in a microservices setup.
In this post, I'll walk you through setting up this fantastic demo environment on your own Kubernetes cluster. We'll cover the deployment process and touch on how to connect it to an observability backend so you can actually see the telemetry data (logs, metrics, traces) in action. I'll even share a few practical tips I picked up along the way.
By the end, you'll have a working setup perfect for experimenting with OTel and gaining practical insights into application performance. Ready to dive in?
What is the Astronomy Shop Demo?
So, what exactly is this Astronomy Shop? Imagine a mini e-commerce site selling cool space gear - telescopes, maybe some fancy star charts. But behind the scenes, it's a cleverly designed microservices application.
What makes it special for us developers?
- It's Realistic: It uses different programming languages and communication methods (like gRPC and HTTP), just like many real-world applications. It’s complex enough to feel authentic.
- It's an Observability Sandbox: The best part? It comes pre-instrumented with OpenTelemetry right out of the box! This means it's already generating logs, metrics, and traces for you to capture and analyze.
- It's Made for Learning (and Breaking!): You can actually trigger simulated problems (like service errors or slowdowns) and then use observability tools to figure out what went wrong. It’s a safe space to practice troubleshooting distributed systems.

Why Use OpenTelemetry?
So, why is OpenTelemetry (OTel) such a big deal in the observability world? At its core, OTel provides a standardized, vendor-neutral way to generate, collect, and export telemetry data – namely traces, metrics, and logs. Think of it as a common language for observability.
This standardization is incredibly powerful because it means you're not locked into a specific monitoring vendor's tools or agents. You instrument your code once with OpenTelemetry, and then you can choose (and even switch!) where you want to send that data for analysis.
But beyond vendor freedom, OTel is invaluable for several reasons:
- Understanding Distributed Systems: When you have multiple microservices talking to each other, OTel traces let you visualize the entire journey of a request across those services. This is crucial for understanding dependencies and pinpointing where things slow down.
- Troubleshooting Proactively: With comprehensive metrics and logs alongside traces, you get a much richer picture of your system's health. This allows you to spot potential issues or anomalies before they cause major outages.
- Flexibility and Integration: OTel is designed to integrate with a wide array of observability backends – open source tools like Jaeger or Prometheus, cloud provider services, and commercial platforms. This flexibility lets you pick the analysis and visualization tools that best fit your needs.
Architecture & Components
To understand how we can observe the Astronomy Shop, let's peek under the hood at its architecture. As mentioned, it mimics a real e-commerce site, so it's built as a collection of interconnected microservices.
You'll find services for typical functions like:
→ Frontend UI
→ User Authentication
→ Product Catalog
→ Recommendations
→ Checkout & Payment
→ Shipping
→ ...and several others!
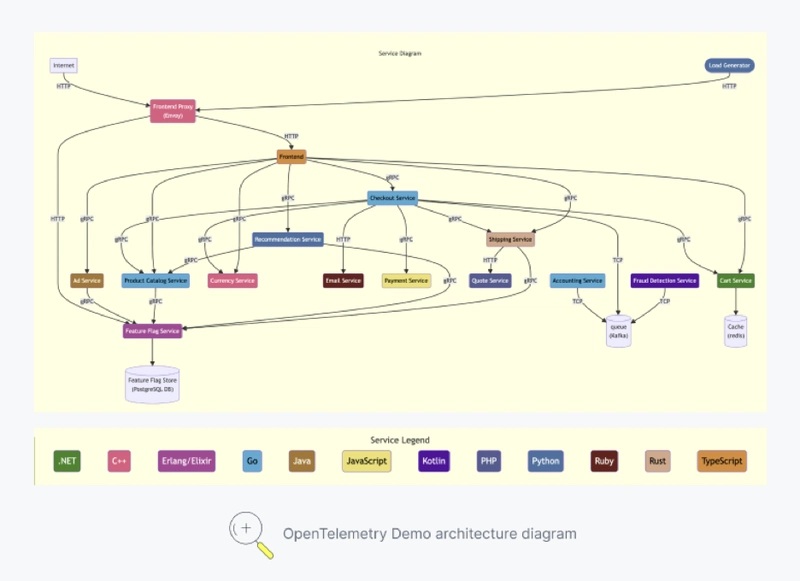
What makes it particularly useful is that these services are written in different languages (Go, Java, Python, Node.js, etc.) and use different ways to communicate (like HTTP and gRPC), just like you'd find in many real-world companies.
When we start looking at telemetry data later, we'll often focus on interactions between key services like the frontend, productcatalogservice, and recommendationservice to see how tracing and metrics help us understand their behavior.
Introducing Controlled Bugs for Observability
Okay, this is where the Astronomy Shop demo gets really interesting for learning. It doesn't just run smoothly; it's designed to let you intentionally introduce problems in controlled ways! Why? So you can practice using OpenTelemetry data (your traces, metrics, and logs) to figure out what's going wrong, just like you would during a real production incident, but without the real-world stress.
The demo includes built-in scenarios to simulate common headaches:
- Memory Leaks: Practice diagnosing memory consumption issues using metrics.
- Specific API Errors: See what happens when certain product lookups start failing.
- Random Service Failures: Observe the impact when critical services like ads or the shopping cart become unreliable.
How does it simulate these issues? The demo cleverly uses feature flags to turn these problems on and off. For instance, there's a flag named recommendationCache that can be used to disrupt the recommendation service. Toggling this flag can put the service into a "broken state" where it might start returning errors or become significantly slower, mimicking real-world failures like timeouts or bad deployments.
The beauty of this setup is that once you have your observability tools connected (which we'll get to!), you can flip one of these flags, watch the telemetry data light up – maybe error rates spike, latency metrics jump, traces show failed requests – and practice your diagnostic skills. It’s like a flight simulator for observability and troubleshooting!
Deploying the Demo on Kubernetes
In this section, we’ll walk you through deploying the demo to an existing Kubernetes cluster using Helm, then integrating it for observability.
Step 1: Installing Helm and Deploying the OpenTelemetry Demo
Alright, let's get the Astronomy Shop running on your Kubernetes cluster! We'll use Helm, which is the standard package manager for Kubernetes. If you haven't used it before or don't have it installed, the official Helm installation guide is the best place to start .
Once you have Helm ready, the first step is to add the official OpenTelemetry Helm repository. Open your terminal and run:
helm repo add open-telemetry https://open-telemetry.github.io/opentelemetry-helm-charts

helm repo update # Ensures you have the latest chart list
Now, you can install the demo chart onto your cluster. This command usually installs the latest version of the chart:
# Replace <your-release-name> with your Helm release name
helm install <your-release-name> open-telemetry/opentelemetry-demo
💡 Troubleshooting Tip: Helm installs the latest chart version by default. Occasionally, the very latest version might have minor bugs or templating issues. If you run into errors during installation, try finding the most recent stable version number by checking the chart's page on Artifact Hub (look under "Versions") or the OpenTelemetry Helm Charts GitHub releases. Then, try installing again using the --version flag, like this:
helm install <your-release-name> open-telemetry/opentelemetry-demo --version <stable-version-number>
This command tells Helm to deploy the opentelemetry-demo chart. It will spin up all the necessary microservices along with the built-in OpenTelemetry instrumentation. Give it a few minutes for all the pods to start up. You can check the status using kubectl get pods -w.
Once the deployment finishes successfully, Helm prints out some very useful information right in your terminal – specifically, look for the NOTES: section provided by the chart authors. This section contains the key details you'll need to actually access the demo application.
Step 2: Accessing the Demo and Jaeger UI
After a successful installation, your terminal output will include that important NOTES: section, which should look something like this:

NOTES section with the kubectl port-forward command needed to access the demo.]
This output is key! Notice the kubectl port-forward command it provides [Image 4]. This command creates a secure tunnel from your local machine (port 8080) directly to the frontendproxy service running inside your Kubernetes cluster (on its port 8080).
1. Start Port-Forwarding:
Open a new terminal window (as this command needs to keep running) execute the port-forward command:
kubectl --namespace default port-forward svc/<your-release-name>-frontendproxy 8080:8080
You should see output like Forwarding from 127.0.0.1:8080 -> 8080. Keep this terminal running in the background.
2. Explore the Astronomy Shop:
Now, open your web browser and navigate to:
You should see the Astronomy Shop frontend! Click around a bit – browse some products, maybe add something to your cart. This user activity will generate requests that flow through the microservices, creating the traces we want to see.
3. View Traces in Jaeger:
This is the exciting part! Open a new browser tab and go to the Jaeger UI path listed in the Helm notes [Image 4]:
http://localhost:8080/jaeger/ui/
Welcome to the Jaeger UI! This is where you can visualize the distributed traces captured by OpenTelemetry.
- In the Jaeger UI sidebar (under "Search"), select one of the services from the dropdown –
frontendorfrontendproxyare good starting points. - Click the "Find Traces" button.
You should see a list of recent traces.

frontend service.]
Click on one of them (preferably one generated by your clicking around in the shop) to see the detailed trace view.

Look at that! You can see the entire journey of a request as it travels from the frontend through various backend services (like productcatalogservice, recommendationservice, etc.). You can see how long each step took, making it easy to spot bottlenecks or errors. This visual insight is incredibly powerful for understanding and debugging distributed systems.
4. What About Metrics?
While we focused on traces with Jaeger here because it's often the most visually impactful for understanding distributed flows, the demo also generates metrics! As shown in the Helm NOTES [Image 4], a Grafana instance is typically included and accessible at:
http://localhost:8080/grafana/
Feel free to explore the Grafana UI to see what metrics dashboards might be available for the demo services. Exploring metrics and logs in detail is beyond the scope of this introductory guide, but let me know in the comments if you'd be interested in a follow-up post diving deeper into Grafana or log exploration with this demo!
Step 3: Seeing OTel in Action: Simulating an Error
Okay, we've seen "healthy" traces in Jaeger, but the real power of observability shines when things go wrong. Remember how we discussed that the Astronomy Shop demo has built-in "controlled bugs" activated by feature flags? Let's try one out!
1. Access the Feature Flag UI:
The Helm NOTES [Image 4] showed us the path for the Feature Flag service. With your kubectl port-forward still running, open this URL in your browser:
http://localhost:8080/feature/
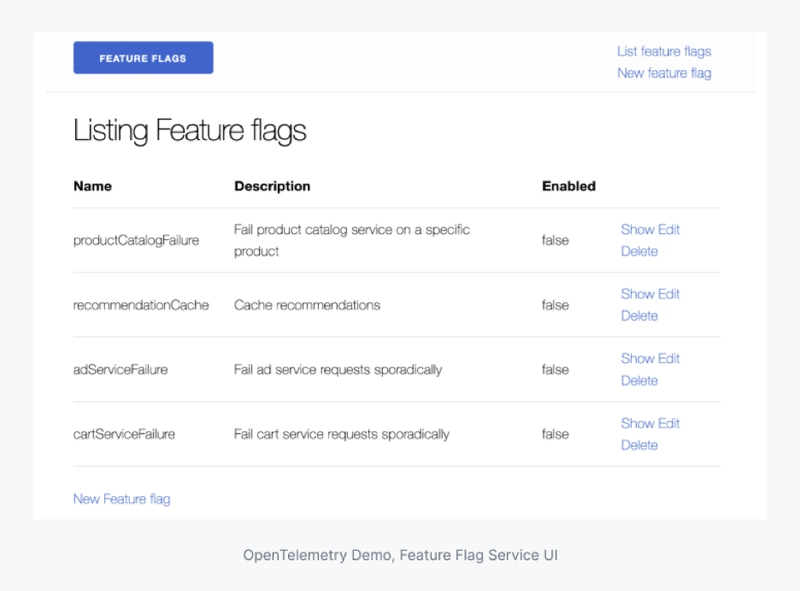
You should see a simple UI listing various feature flags [Image 3] that can simulate problems in different microservices.
2. Enable a Failure:
Let's pick a simple one to start. Find the flag named productCatalogFailure (which simulates errors in the Product Catalog service ) and click its toggle or button to enable it.

productCatalogFailure simulation by setting the 'Enabled' value to 1.0.]
3. Trigger the Error:
Now, go back to the Astronomy Shop UI tab in your browser (http://localhost:8080/). Try to browse the products. Since we enabled failures in the productcatalogservice, you might see errors on the page, or products might fail to load. Perform a few actions that would require fetching product details.
4. Observe in Jaeger:
Head back to the Jaeger UI tab (http://localhost:8080/jaeger/ui/).
- Change the selected Service in the search sidebar to productcatalogservice (or search for frontend again, as requests often flow through it).
- Click "Find Traces" to see the latest traces generated after you enabled the feature flag.
You should now see some traces marked with errors! Jaeger typically highlights failed traces or spans with red icons or tags.

frontend and productcatalogservice after enabling the feature flag.]
Click on one of these error traces. You can now investigate the spans within the trace to see exactly where the failure occurred (likely within the productcatalogservice span) and potentially view error logs or tags associated with that span.
This is observability in action! We intentionally caused a problem using a feature flag and immediately saw the impact reflected in our distributed traces, pinpointing the affected service. This is precisely how these tools help us diagnose real-world issues much faster. Feel free to experiment by disabling the flag and enabling others to see their effects!
Cleanup
When you're finished experimenting, you can remove all the demo components from your cluster by running:
# Replace <your-release-name> with your Helm release name!
helm uninstall <your-release-name>
Conclusion 🎉
And there you have it! We've successfully deployed the OpenTelemetry Astronomy Shop demo onto a Kubernetes cluster using Helm, explored its microservices via the browser, and visualized distributed traces using the built-in Jaeger UI. We even simulated a failure using a feature flag and saw how OpenTelemetry data immediately helped us pinpoint the issue within our traces.
The OpenTelemetry demo provides a fantastic, hands-on playground for anyone looking to understand observability concepts in a realistic, distributed environment. Because OpenTelemetry is vendor-neutral, the skills you practice here are applicable whether you use open-source tools like Jaeger and Prometheus or commercial observability platforms.
We focused mainly on visualizing traces with Jaeger today. Exploring the metrics in Grafana or diving deep into the logs generated by the demo could be topics for another time. Let me know in the comments if a follow-up post on those aspects would be helpful!
I encourage you to keep exploring the demo – try out different feature flags, examine the metrics in Grafana, and get comfortable navigating the telemetry data. Happy observing!👋

Top comments (0)