Range maps
Exactly where a species occurs on the planet is a critical piece of information for its conservation. Our goal in Birds of the World is to provide accurate and up-to-date range information for every species. In every species account, you will find several types of maps. In long format accounts, these maps will be displayed in the Introduction and Distribution sections. In short format accounts, all available maps will be displayed on the right-hand side of the three-column layout. Below you will learn more about each type of map and our rationale for including them in our accounts.
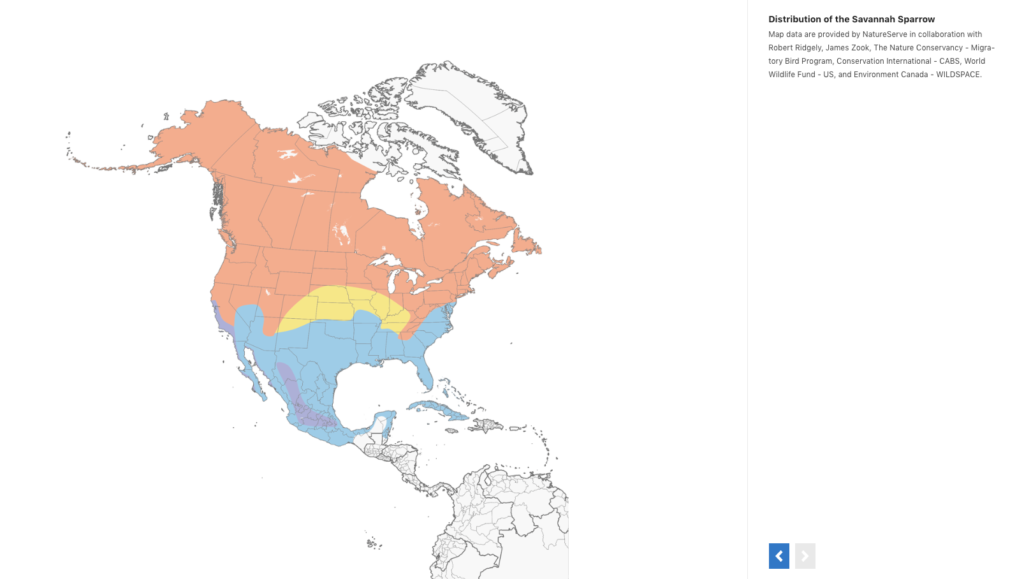
Basic Range Maps
These maps offer a rather traditional depiction of a species range, with seasonal occurrence represented as colored polygons. These maps are similar to what you’d find in any field guide, and they offer a quick, though often coarse, overview of where a species occurs. Our goal is to have a basic range map like this for every species in Birds of the World, but there may be gaps created by annual taxonomic updates. In cases where we are either lacking a basic range map altogether, or the range map we have does not adequately cover the current taxon’s range, we have opted to instead show the ‘eBird Range Map’ (see below). If you see a basic range map that you feel should be updated, please do not hesitate to reach out to us with your comments.
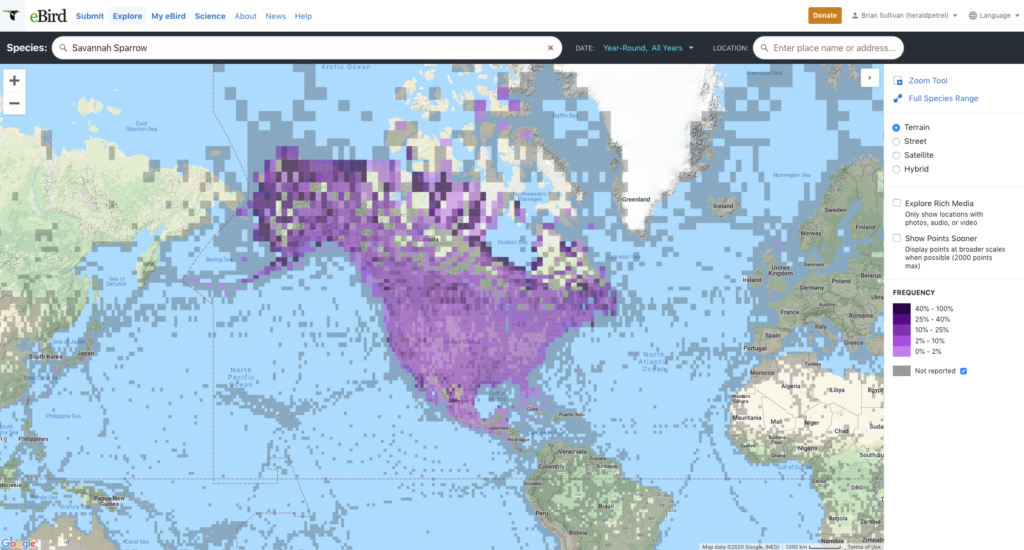
eBird Range Maps
These maps depict frequency of occurrence based on eBird observational data as 100 or 20km grids. Higher frequencies denote higher occurrence. In other words, you’re more likely to find the bird in the deeper purple shaded zones. By clicking through to eBird to explore further, you can enable negative data, which shows where observation data exist and where the species was not recorded. Zooming in farther reveals the underlying data points for each observation, and their associated checklists and media. Because eBird is underpinned by the same taxonomy as Birds of the World, these eBird range maps are available for all taxa (as well as subspecies groups).
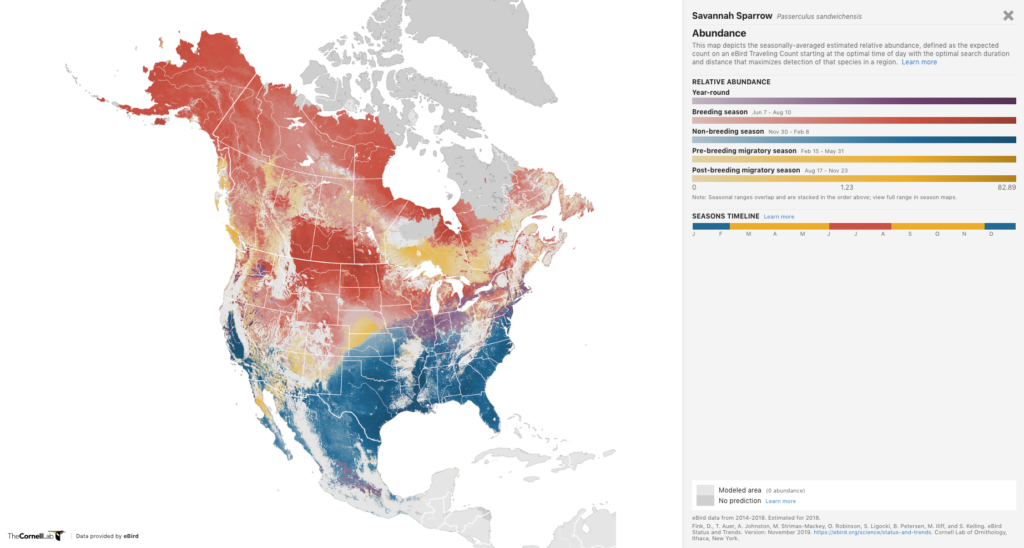
eBird Status and Trends Abundance Maps
We are now showcasing the abundance/range maps developed by the eBird Status and Trends team at the Cornell Lab. These maps are more detailed than anything previously generated, and they represent the best-in-class for a static range map covering the full annual cycle of a species. When available for a species, these maps can be found in the Distribution section of long format accounts. These maps are readily available to download from the eBird Status and Trends website for inclusion in your research.
__
Our goal is to create a more uniform user experience for range maps moving forward, with the same set of maps available for all taxa. In the meantime, we’ll continue to feature the best of what is at hand.
Requesting maps and media
Should you like to make a request to use any media files from Birds of the World (including maps, photographs, figures, audio and video files) please read our data and media policies.
Features
Content

Partnerships
A global alliance of nature organizations working to document the natural history of all bird species at an unprecedented scale.