

Abstract
Older adults (OA) show more diffuse brain activity than young adults (YA) during the performance of cognitive, motor, and perceptual tasks. It is unclear whether this over-activation reflects compensation or dedifferentiation. Typically, these investigations have not evaluated the organization of the resting brain, which can help to determine whether more diffuse representations reflect physiological or task- dependent effects. In the present study we used transcranial magnetic stimulation (TMS) to determine whether there are differences in motor cortex organization of both brain hemispheres in YA and OA. We measured resting motor threshold, motor evoked potential (MEP) latency and amplitude, and extent of first dorsal interosseous representations, in addition to a computerized measure of reaction time. There was no significant age difference in motor threshold, but we did find that OA had larger contralateral MEP amplitudes and a longer contralateral MEP latency. Furthermore, the spatial extent of motor representations in OA was larger. We found that larger dominant hemisphere motor representations in OA were associated with higher reaction times, suggesting dedifferentiation rather than compensation effects.
Keywords: aging, transcranial magnetic stimulation, motor cortex
1. Introduction
Substantial evidence has accumulated over the last decade demonstrating that task-related brain activity is more diffuse and bilaterally symmetrical in older than young adults (YA; cf. Cabeza, 2002; Reuter-Lorenz and Lustig, 2005). While the bulk of this work has been targeted at understanding age differences in cognitive function, a burgeoning literature documents that similar over-activation is observed when participants perform motor tasks (Mattay et al., 2002; Naccarato et al., 2006; Ward & Frackowiak, 2003; Riecker et al., 2006; Ward, 2006; Calautti et al., 2001; Hutchinson et al., 2002; Talelli et al., 2008a; Heunickx et al., 2005; 2008; Langan et al., 2010). Debate lingers as to whether and how such over-activation is related to changes in brain structure, function, and biochemistry with age, as well as whether more diffuse activation patterns reflect compensatory processes or dedifferentiation of (i.e., less distinctive) representations (for a recent review see Seidler et al. 2010).
Increased activation in prefrontal regions during the performance of cognitive tasks has been shown to improve performance in older adults (OA) suggesting that, at least under some circumstances, additional activation is compensatory (Cabeza 2002; Carp et al., 2010). Dedifferentiation, as defined by excess (less distinct) brain recruitment in OA (Park et al., 2001) is not mutually exclusive from compensation, and is frequently reported in the literature on cognitive aging. In visual areas there is evidence for dedifferentiation such that OA have less specific neural representations for different categories of visual stimuli (Park et al., 2004; Carp et al., In Press). Furthermore, recent work by Carp and colleagues (2010) has shown decreased distinctiveness in visual regions of the brain during the performance of a working memory task. The visual cortex voxels activated for verbal and visuospatial working memory tasks were overlapping. In the same participants performing the same tasks, activity in prefrontal regions during maintenance and retrieval was indicative of compensatory processes. The pattern of findings for motor tasks is less consistent. While some work suggests that bilateral activation in the motor cortex is compensatory (Mattay et al., 2002) resulting in better performance, there is also evidence demonstrating that this overactivation is associated with poorer motor task performance (Langan et al., 2010). Any excess recruitment in OA that results in behavioral deficits will be referred to here as dedifferentiation, whereas compensation will refer to any excess recruitment that results in performance benefits.
More symmetrical activation of the motor system is predominantly associated with increased engagement of the motor cortex ipsilateral to the moving hand in OA (Mattay et al., 2002; Ward & Frackowiak, 2003; Heuninckx et al., 2005, 2008). Given that OA have reduced interhemispheric inhibition between the motor cortices compared to YA (Talelli et al., 2008a, 2008b), greater activation in the ipsilateral motor cortex may be a result of release from inhibition by the contralateral motor cortex. Indeed, Talelli and colleagues (2008a, 2008b) have demonstrated that OA do not modulate interhemispheric inhibition when going from a state of rest to muscle contraction to the same extent that YA do. Moreover, the authors found that the degree of change in interhemispheric inhibition from rest to muscle contraction was associated with the extent of fMRI activation in the ipsilateral sensorimotor cortex, regardless of age (Talelli et al. 2008a).
Less lateralized brain processing has been shown to be associated with reductions in callosal cross sectional area in OA as well (Müller-Oehring et al., 2007). It is unclear, however, whether greater interhemispheric crosstalk and more diffuse motor recruitment reflect brain organizational features that are present at rest, or are instead only associated with task performance. For example, it has been shown that recruitment of ipsilateral motor cortex increases with task difficulty in YA (Seidler et al. 2004; Verstynen et al., 2005). Greater ipsilateral motor cortical activation in OA may in part be a reflection of heightened task difficulty for older versus young adults. Or, it may be due to a reduced ability to modulate inhibitory processes to suit varying task demands (Talelli et al., 2008a, 2008b; Fujiyama et al., 2009).
Thus, the primary purpose of the current study was to compare motor cortical representations of the first dorsal interosseous (FDI) finger muscle between YA and OA and to investigate whether the extent of these representations influences motor performance. We applied transcranial magnetic stimulation (TMS) to the motor cortex when participants were at rest. We hypothesized that OA would exhibit a greater number of ipsilateral motor evoked potentials (MEPs) elicited by TMS, which are typically not observed in the resting state in healthy YA (although we have recently shown that they occur in some YA, particularly those with low handedness scores; Bernard et al., 2011). We also predicted that the spatial extent of motor representations in OA would be more extensive than that of YA. Additionally, we predicted that these more diffuse representations in OA would have a negative impact on motor performance resulting in higher reaction times, consistent with the pattern of dedifferentiation seen in the motor cortex with age that we have recently reported (Langan et al., 2010).
A secondary purpose of this study was to evaluate whether there are age differences in MEP amplitude and latency. It is important to delineate age differences in motor cortical excitability and motor map characteristics because reorganization (expansion and contraction) of such maps is routinely tracked during the time course of physical rehabilitation interventions in patients who have suffered from stroke, who have Parkinson's disease, or other neurological impairments that exhibit increasing frequency with age. Moreover, the reorganization capacity of the motor cortex has been shown to vary with the MEP amplitude that can be evoked prior to intervention (Pitcher & Miles, 2002). Previous work has shown that OA have reductions in motor cortical plasticity based on studies using paired-associative stimulation (Tecchio et al., 2008) and motor training (Sawaki et al., 2003; Rogasch et al., 2009). The literature is mixed, however, in terms of whether OA have smaller MEP amplitudes than YA. Some studies have reported smaller MEPs in OA (Fujiyama et al., 2009; Oliviero et al., 2006; Talleli et al., 2008b), while others have found no age differences in MEP amplitudes (Tecchio et al., 2008).
We also wished to evaluate whether motor threshold differs with age. Some studies have reported no difference (Fujiyama et al., 2009; Pitcher et al., 2003; Talelli et al., 2008b; Rogasch et al., 2009), while others have reported that OA have lower motor thresholds than YA (Tecchio et al., 2008) or higher motor thresholds (Rossini et al., 1992; Oliviero et al. 2006 report a nonsignificant trend in this direction). These conflicting results may be due to the broad age range of OA tested across these studies (55 years up to 94 years old). Interestingly, in their sample of participants aged 70 to 94 years old, Silbert et al. (2006) found that resting motor threshold decreased with age, and lower thresholds were associated with increased white matter hyperintensities and increased cerebrospinal fluid volume. A larger scalp to cortex distance was associated with a larger resting motor threshold as well (Silbert et al., 2006). It is therefore of interest to compare motor threshold between young and older participants of a more restricted age range.
In the current study we mapped M1 representations of the first dorsal interosseous muscle in YA and OA in both the dominant (left) and nondominant (right) hemisphere. We recorded MEPs bilaterally allowing us to quantify resting motor threshold, ipsilateral and contralateral MEP amplitudes and latencies, and the extent of contralateral and ipsilateral motor representations. We hypothesized that OA would have more diffuse motor representations than YA, and would have a greater propensity to exhibit ipsilateral representations. We also predicted that OA would have smaller MEP amplitudes and larger resting motor thresholds.
2. Methods
2.1 Participants
16 young adult (21 ± 1.83 years, 4 male) and 17 older adult (69.53 ± 4.05 years, 7 males) participants were recruited from the University of Michigan and the surrounding community and were paid for their participation. Participants responded to recruitment fliers placed around the community and on an online recruitment website. Additionally, we directly recruited individuals interested in participating in research through a database. A subset of the data from the YA was previously reported (Bernard et al., 2011). Upon enrollment in the study participants signed an IRB-approved informed consent form. Exclusion criteria included a history of neurological disease or damage, migraines, arthritis, head injury, or psychiatric disorder. All participants were cognitively healthy as measured by the Mini-Mental State Exam (MMSE; Folstein et al., 1975; mean ± SD; YA= 29.69 ±.60, OA=28.76 ± 1.64) and the Mattis Dementia Rating Scale (Mattis, 1976; YA=142.87 ± 1.20, OA=142.23 ± 1.56). Participants were all strongly right-handed based on their laterality scores from the Tapping Circles portion of the Hand Dominance Test (Steingrüber, 1971), which we have previously shown are correlated with the number of ipsilateral MEPs in YA (Bernard et al, 2011).
2.2 Experimental Set-Up and Procedure
Testing occurred on two separate days. During one session participants completed the Edinburgh Handedness Inventory (Oldfield, 1971) to provide a self-report measure of handedness. We administered the Tapping Circles and Tapping Squares from the Hand Dominance Test (Steingrüber, 1971) to provide a graphomotor measure of handedness and dexterity for each hand. Participants had 30 seconds to tap on small circles or squares using a marker with their left and right hands. The order of hands was counterbalanced across participants. The number of circles and squares tapped with each hand was counted and used to calculate a laterality index. Participants also performed the Purdue Pegboard Test (right hand, left hand, bilateral, and assembly tasks, 30 seconds per trial, 3 trials per task; Tiffin & Asher, 1948) and a grip strength assessment. For the Edinburgh Handedness Inventory, the Hand Dominance Test, and the unimanual conditions of the Purdue Pegboard, we calculated laterality indices in the following manner: (R−L)/(R+L), where R and L indicate right and left hand responses, respectively. Finally, we measured reaction time of the dominant (right) hand using a computer task implemented with E-Prime 1.1 software (Psychology Software Tools, Inc). Participants responded with their right hand as quickly as possible to white dots (subtending 0.61° of visual angle) presented on a black background in either the left or right visual field (center of circle subtending 6.02° of visual angle to the left or right of a central fixation cross). The fixation cross was presented for a variable foreperiod (500, 650, 800, or 1000 ms) to prevent anticipatory responses. Left and right visual field presentations were pooled for the calculation of reaction time (RT) and any responses under 100 ms were eliminated.
On the second test day, participants underwent a TMS motor-mapping procedure. All participants were screened for any potential contraindications for TMS, following the guidelines of Rossi et al. (2009). Participants sat comfortably in a chair with their head resting in a chin rest and their hands relaxed. A tight-fitting lycra swim cap was placed on the head to allow for the marking of stimulation locations. We recorded motor-evoked potentials (MEPs) from the first dorsal interosseous muscle bilaterally using 4 mm Ag/AgCl− electrodes placed on the muscle in a belly-tendon arrangement. A ground electrode was placed on the right wrist. MEP data were recorded and digitized at 2000 Hz using Biopac hardware and AcqKnowledge software (BIOPAC Systems Inc., Goleta, CA). Our system was carefully shielded by twisting the electrode wires, and all leads were secured in place so that they were not in contact with one another. A Magstim 70 mm figure of eight coil with a Magstim Rapid stimulator (Magstim Company Ltd, Wales, UK) was used for TMS stimulation. We localized the motor hot spot for the first dorsal interosseous muscle for each hand by stimulating at a supra-threshold level of intensity. Resting motor threshold was then determined to the nearest two percent of stimulator output that elicited MEPs of at least 50 μV on three out of six consecutive stimulations while the target muscle was at rest (cf. Triggs et al, 1994, 1999; Bernard et al., 2011). We utilized a 6 × 6 grid of points 12 mm apart for motor mapping in each hemisphere, located to encompass the majority of the motor cortical hand representation. Grid location was determined based on anatomical landmarks such that the top of the grid was placed 2 cm infero-laterally from point Cz (Sparing et al., 2008; Bernard et al., 2011). The grid extended 4.8 cm in the anterior direction and 2.4 cm in the posterior direction (Figure 1). Each site was stimulated 6 times at 110% of motor threshold with at least 6 seconds between stimulations. Stimulation was performed while the first dorsal interosseous was at rest, as determined with EMG monitoring. Mapping was performed in both the left (dominant) and right (non-dominant) hemispheres in a counterbalanced fashion across participants.
Figure 1.
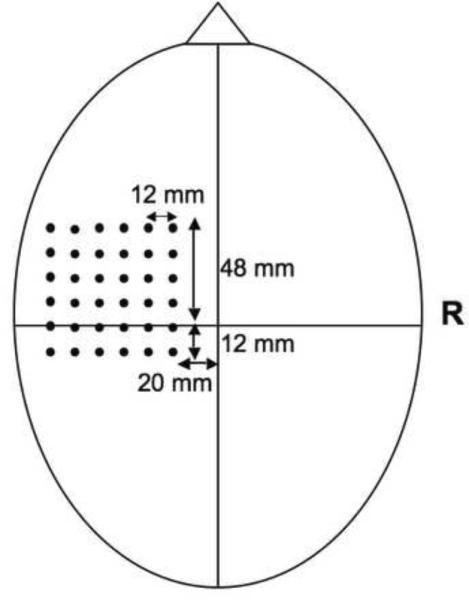
Grid placement for the TMS mapping procedure. All points were 12 mm apart and placement was based upon anatomical landmarks. Mapping was done bilaterally.
2.3 Data Processing
EMG data were filtered online and digitized (10 and 500 Hz bandwidth filtering) using a Biopac MP100 system with EMG 100C amplifiers and AcqKnowledge software (BIOPAC Systems Inc., Goleta, CA). MEP onset latency was calculated as the point at which the MEP amplitude reached two standard deviations above the mean of the amplitude of the resting state muscle activity from 500 ms before and after stimulation. The peak-to-peak amplitude was also calculated. Ipsilateral MEPs were defined as those having peak-to-peak amplitude of at least 15 μVolts (Wasserman et al., 1992; Bernard et al., 2011). The difference in onset latency between contralateral and ipsilateral MEPs (for the subset of participants who exhibited ipsilateral MEPs) was also calculated. Contralateral map areas were calculated as the number of points from which a minimum of three out of six stimulations elicited suprathreshold MEPs, similar to the cutoff of 60% employed by Pascual-Leone and colleagues (1995), whereas ipsilateral map areas were calculated as the number of points from which suprathreshold MEPs were elicited.
2.4 Statistical Analyses
Statistical analyses were performed using R software (www.r-project.org/). The cognitive and motor functional assessment scores were compared across the two age groups using independent sample t-tests. The following TMS variables were analyzed using two (age group, between subjects factor) by two (hemisphere, within subjects factor) mixed model ANOVAs: number of contralateral and ipsilateral MEPs, mean peak-to-peak amplitude of contralateral and ipsilateral MEPs, mean latency of contralateral and ipsilateral MEPs, mean latency difference between contralateral and ipsilateral MEPs, and contralateral and ipsilateral map areas. One YA was excluded from analyses of ipsilateral MEP effects and representations because their number of ipsilateral MEPs was greater than 3 standard deviations from the average.
3. Results
3.1 Age Differences in Cognitive and Motor Assessments
YA performed significantly better on the MMSE than OA (t(31)=−2.11, p<.05; see section 2.1 for means), but participants in both age groups were approaching ceiling performance. Table 1 shows the mean and standard deviation of scores on the laterality and motor assessments for both age groups. Importantly, there were no age group differences in laterality of dexterity as measured by Tapping Circles (t(31)=.90, p>.3; see Figure 2 for the distributions), or Edinburgh Handedness Inventory scores (t(31)=1.37, p>.1). There were also no age differences in laterality on the Tapping Squares test (t(31)=.54, p>.5), nor were there any differences in laterality of dexterity as measured using grip strength (t(30)=1.04, p>.3). Interestingly, there was a significant age difference in laterality of dexterity when looking at the Purdue Pegboard test (t(30)=−2.57, p<.05). YA also exhibited better performance on both the bilateral (t(31).=−4.83, p<.001) and the assembly (t(31)= −6.37, p<.001) conditions of the Purdue Pegboard test. There were no age differences in reaction time (t(31)=1.69, p>.1).
Table 1.
Mean (± SD) laterality indices (LI) and scores on motor assessments.
| Laterality & Motor Assessments | YA | OA |
|---|---|---|
| Laterality Assessments (LI) | ||
| Edinburgh Handedness Inventory | .72 (.16) | .81 (.22) |
| Tapping Circles | .13 (.06) | .14 (.05) |
| Tapping Squares | .09 (.05) | .11 (.07) |
| Grip Strength | .03 (.05) | .05 (.05) |
| Purdue Pegboard* | .06 (.03) | .02 (.05) |
| Motor Assessments | ||
| Bilateral Pegboard (Number of Pairs)* | 12.33 (1.62) | 9.72 (1.48) |
| Pegboard Assembly (Number of Pieces)* | 20.83 (3.49) | 13.70 (2.92) |
| Dominant Hand Reaction Time (ms) | 253.05 (56.16) | 284.49 (50.63) |
Significant age differences are indicated with an.
Figure 2.

Distribution of laterality indices for YA and OA on the Tapping Circles measure of laterality. All participants were right-handed based on self-report.
3.2 Motor Threshold
A 2 × 2 ANOVA (age by hemisphere) revealed a trend for higher motor threshold in OA (F(1,28)=3.34, p=.08). There was no significant main effect of hemisphere on motor threshold (F(1,28)=.03, p>.8) nor was there an age by hemisphere interaction (F(1,28)=.01, p>.9). Given the trend for an age difference in motor threshold, additional analyses were run using motor threshold as a covariate.
3.3 Contralateral and Ipsilateral MEP Characteristics
Table 2 contains a summary of the means and standard deviations of the TMS measures. The number of contralateral and ipsilateral MEPs was quantified and compared across age groups. OA showed a significantly larger number of MEPs contralateral to the stimulated hemisphere when controlling for motor threshold (F(1,53)=10.07, p<.01). There was no significant main effect of hemisphere (dominant versus nondominant) nor was there a significant age by hemisphere interaction (F<1, p>.3 in both cases). There was a trend indicating that OA also showed a greater number of ipsilateral MEPs (F(1,52)=3.37, p=.07), though again, there was no main effect of hemisphere nor an interaction (F<1.5, p>.3 in both cases).
Table 2.
Mean (SD) of TMS measures.
| TMS Measures | YA | OA |
|---|---|---|
| Motor Threshold (% Stimulator Output) | ||
| Dominant Hemisphere | 57.60 (4.91) | 62.75 (11.83) |
| Non-Dominant Hemisphere | 57.67(5.72) | 63 (9.00) |
| Contralateral MEP Amplitude ( μ Volts) * | ||
| Dominant Hemisphere | 136.75 (72.79) | 209.09 (135.06) |
| Non-Dominant Hemisphere | 132.72 (93.45) | 166.48 (178.80) |
| Ipsilateral MEP Amplitude ( μ Volts) | ||
| Dominant Hemisphere | 28.86 (13.54) | 37.86 (17.57) |
| Non-Dominant Hemisphere | 29.37 (18.79) | 35.41 (26.08) |
| Contralateral MEP Latency (ms) | ||
| Dominant Hemisphere | 21.44 (3.11) | 20.61 (3.25) |
| Non-Dominant Hemisphere | 24.13 (3.99) | 22.64 (4.47) |
| Ipsilateral MEP Latency (ms) | ||
| Dominant Hemisphere | 23.59 (7.02) | 24.57 (8.44) |
| Non-Dominant Hemisphere | 25.40 (12.15) | 24.71 (7.90) |
An by the metric indicates a significant main effect of age.
There were no age differences in peak-to-peak amplitude of ipsilateral MEPs (F<1, p>.2). However, there was a significant main effect of age when looking at the amplitude of contralateral MEPs (F(1,57)=6.71, p<.05; Figure 3) indicating that OA had larger MEPs when controlling for motor threshold, though there was no main effect of hemisphere nor an age by hemisphere interaction (F<1, p>.5 in all cases).
Figure 3.

Average (SD) contralateral (left) and ipsilateral (right) MEP amplitude. Contralateral MEP amplitude shows a significant main effect of age wherein OA have larger amplitude MEPs (while controlling for motor threshold; F(1,57)=6.71, p<.05), *p<.05.
We also investigated the latency of both contralateral and ipsilateral MEPs, as well as the difference between the two latencies. There was a non-significant trend for an age difference in the latency of contralateral MEPs (F(1,57)=3.75, p<.06), though there was no main effect of hemisphere, nor an age by hemisphere interaction (F<1.5, p>.2 in all cases). Onset latency of contralateral MEPs trended towards being longer in OA. Ipsilateral latencies were examined in those individuals that showed ipsilateral MEP activity. There were no age, hemisphere, nor interaction effects when looking at the latencies of ipsilateral MEPs (F<.5, p>.6 in all cases).
3.4 Motor Cortical Representations
We also evaluated whether there were age differences in the extent of the motor representations. For contralateral representations, we ran an ANOVA (age by hemisphere) on the number of points in the grid which resulted in MEPs on at least 3 stimulations (50%). Supporting our hypothesis that OA would show more diffuse motor cortical representations, a significant main effect of age (F(1,57)=5.75, p<.05; Figure 4) indicated that OA had larger contralateral motor cortical representations. There was no significant main effect of hemisphere, nor was there an age by hemisphere interaction (F<1.5, p>.2 in both cases). Ipsilateral motor representations were quantified by counting the number of points in the grid that resulted in any ipsilateral MEPs given that ipsilateral MEPs were relatively scarce (9.7% of all stimulations in OA, and 2.8% of all stimulations in YA). There was a significant main effect of age on ipsilateral representations with OA representations spanning a larger number of points (F(1,49)=4.72, p<.05). Main and interaction effects with hemisphere were not significant (F<1.5, p>.2 in both instances). Figure 5 presents the contralateral and ipsilateral motor representations for representative young and older adult participants.
Figure 4.

Average (SD) number of points with MEPs on at least 50% of stimulations making up the contralateral representations (left) and average number of points with MEP activity making up ipsilateral representations (right). Significant main effects of age for both contralateral (F(1,57)=5.75, p<.05) and ipsilateral (F(1,49)=4.72, p<.05) representations indicate that OA have larger motor representations, *p<.05.
Figure 5.

Representative contralateral and ipsilateral motor maps for a YA and an OA (MEP amplitude indicated by color, blue to red in ascending order). Both individuals are female with scores of 1.00 on the Edinburgh Handedness Inventory. The contralateral and ipsilateral maps for the left hemisphere placed on the left, and likewise for the right hemisphere.
Finally, to investigate whether or not the extent of contralateral representations serves a compensatory mechanism or rather is reflective of dedifferentiation, we evaluated correlations with reaction time measures using Spearman's rank correlation. In OA, there was a significant relationship indicating that a larger dominant contralateral representation was associated with higher reaction times (rho=.59, p<.05, Figure 6a) while in YA there was no significant relationship (rho=−.10, p>.6). Furthermore, the correlation coefficients were significantly different between the two age groups (Z=2.02, p<.05). A similar pattern is seen when we use a more lenient measure of contralateral representations including all points showing MEP activity (as opposed to on a minimum of 3/6 trials; OA: rho=.55, p<.05; YA: rho=−.02, p>.9; Z=1.66, p<.1; Figure 6b). Thus, it seems that the more spatially extensive contralateral representations in the dominant hemisphere of OA may be a form of less distinctive motor representations, resulting in prolonged reaction times.
Figure 6.

A. Correlation between the contralateral representation and reaction time (RT) of the dominant hand in both YA and OA. There is a significant correlation in the OA (rho=.59, p<.05) but not in the YA (rho=−.10, p>.6). B. Correlations in OA (rho=.55, p<.05) and YA (rho= −.02, p>.9) when using a more lenient definition of contralateral representations.
4. Discussion
We found that OA have more spatially extensive contralateral and ipsilateral motor cortical representations than YA. Furthermore, the extent of contralateral representations in OA is associated with longer reaction times indicating dedifferentiation. Additionally, the characteristics of the motor evoked potentials themselves differ across the two age groups. These conclusions are supported by the following results: 1) a greater number of contralateral MEPs elicited in OA and a trend for a greater number of ipsilateral MEPs in this group; 2) larger spatial extent of contralateral and ipsilateral MEPs in OA; and 3) a larger amplitude and a trend indicating longer latency for contralateral MEPs in OA. Additionally, we observed a trend for OA to exhibit higher motor thresholds.
OA show a pattern of decreased distinctiveness in their cortical representations (Li & Lindenberger, 1999). This is particularly evident in studies focusing on the sensory systems (Li et al., 2001; Li & Sickstrom, 2002). For example, Park and colleagues (2004) have shown less specialized neural representations in the visual cortex for different categories of visual stimuli, and this finding has been recently replicated (Carp et al., In Press). Here dedifferentiation more specifically refers to when this decreased distinctiveness results in performance deficits. This is contrasted with compensation. Over-activation in prefrontal regions that is associated with better performance for cognitive tasks in OA suggests that it serves a compensatory function (Cabeza et al., 2002; Reuter-Lorenz et al., 2000; Reuter-Lorenz & Lustig, 2005).
The literature is mixed as to whether or not motor system over-activation is compensatory for OA. While some studies have shown that increased bilateral activation is associated with better task performance for older individuals, indicative of compensation (Mattay et al., 2002; for a review see Ward, 2006), there is also evidence to the contrary. For example, we recently demonstrated that activity in the primary motor cortex ipsilateral to the performing hand was correlated with higher reaction times for OA (Langan et al., 2010), supporting a dedifferentiation interpretation. The current finding of larger motor cortical representations (both contralateral and ipsilateral) in OA at rest indicates that there is a fundamental age difference in motor cortical organization such that there may be decreased distinctiveness in the motor cortex, perhaps due to decreased intracortical inhibition reported in OA (Peinemann et al., 2001). Additionally, we found that larger contralateral representations in the dominant (left) hemisphere were associated with higher reaction times for OA. This further supports the notion of age-related dedifferentiation in the motor cortex, which may contribute to age deficits in fine motor control. Though our results indicate dedifferentiation as evidenced by a decrease in the distinctiveness of motor cortical representations and concomitant behavioral deficits, to more conclusively support this it would be necessary to map other digits within the motor cortex.
The more extensive motor cortical representations may also be due in part to age-related changes in muscle architecture (Andersen, 2003; Fling et al., 2009). With age, larger motoneurons are lost, and muscle fibers are often reinnervated by smaller neighboring motoneurons resulting in larger motor units in OA (Fling et al., 2009). Thus, this peripheral reorganization may also explain the spreading of the first dorsal interosseous representation that we observed. A similar mechanism may underlie the reduced distinctiveness of visual cortical representations in older adults. Work by Eliasieh and colleagues (2007) has demonstrated that the human retina undergoes dendritic reorganization in OA, particularly in rod, cone, and horizontal cells, though the thickness of the retina decreases with age (Polidori et al., 1993). It is therefore possible that the decrease in distinctiveness reported in the visual system is also due in part to peripheral reorganization.
A change in the architecture of motor units in OA may also underlie our findings of a larger number of MEPs, and higher contralateral MEP amplitude in OA. While it is possible that this is due to an overall increase in motor cortical excitability, it is unlikely given that we note a trend for higher motor threshold in OA. Increased excitability would predict a lower motor threshold. Though motor unit architecture changes with age (Andersen, 2003; Fling et al., 2009), OA still appear to recruit motor units in accord with the size principle (Olson et al., 1968). Thus, motor units recruited at similar thresholds are likely to be significantly larger in OA. These larger motor units may underlie the greater MEP amplitude we see in OA (Fling et al., 2009). Furthermore, age-related reinnervation may also underlie the larger number of MEPs seen in OA. Because superficial motor fibers are more likely to be reinnervated due to the loss of larger motoneurons, more MEPs may result due to recruitment according to the size principle. Activity in these more superficial fibers is likely to be picked up with surface EMG, thus resulting in the larger number of MEPs seen in OA.
Increased recruitment of the ipsilateral motor cortex during motor task performance has been related to task difficulty (Verstynen et al., 2005; Seidler et al., 2004). Thus, increased recruitment of the ipsilateral motor cortex seen for OA (Mattay et al., 2002; Naccarato et al., 2006; Ward & Frackowiak, 2003) may be due to increased task demands. What is a simple task for YA may be more complex for OA resulting in modulation of brain activity. However, the current findings argue against this interpretation. That is, we observed more extensive motor cortical representations, particularly ipsilaterally, when participants were at rest.
Ipsilateral MEPs are not typically seen at rest in YA (Bawa et al., 2004; Carr et al., 1994; Netz et al., 1997; Ziemann et al., 1999), though we have previously shown that their presence is related to degree of handedness (Bernard et al., 2011). Thus, the mechanisms underlying the increased ipsilateral motor cortical representations, and similarly the trend indicating an overall larger number of ipsilateral MEPs in OA is of interest. Talelli et al. (2008a, 2008b) have demonstrated that with increasing age there is a decrease in interhemispheric inhibition during the performance of a background task. Furthermore, this task-related decrease in inhibition has been shown to correlate with increased ipsilateral brain recruitment during motor task performance (Talelli et al., 2008a). Perhaps then, the trend for increased ipsilateral MEPs and the corresponding more extensive ipsilateral motor representations that we observed in OA are due to differences in interhemispheric inhibition. Future studies would benefit from a direct test of the relationship between interhemishperic inhibition as measured using paired-pulse TMS and the extent of ipsilateral motor cortical representations.
Additionally, it is also important to consider the possibility that the greater amount of ipsilateral activity in OA arises due to differences in corticospinal tract organization. That is, the level of the central nervous system at which ipsilateral MEPs are generated is unclear. While callosal mechanisms as described above have been proposed (Dassonville et al., 1997), the majority of the literature on ipsilateral MEPs suggests that they are due to ipsilateral projections of the corticospinal tract (Jung & Ziemann, 1996; Ziemann et al., 1999), though these projections primarily innervate proximal muscles (Brinkman & Kuypers, 1973). Thus, while there are documented changes in interhemispheric inhibition with age, which could result in an increase in ipsilateral motor activity due to TMS stimulation, there may also be changes in the ipsilateral corticospinal tract resulting in this phenomenon. Because we did not investigate this directly, it remains an open question as to what mechanism causes ipsilateral MEPs in OA.
Characterizing the resting organization of the motor cortex in OA is important for rehabilitation interventions. TMS mapping is often used to assess damage following stroke (Liepert et al., 2000b) as well as the underlying mechanisms of treatment interventions (Liepert et al., 2000a, 2000b; Cramer & Bastings, 2000; Wittenberg et al., 2003; for a review see Hallett, 2003). However, the patients themselves often serve as their own controls, and little is known about the baseline characteristics of motor representations measured with TMS in OA. Assessing damage is therefore difficult without an appropriate point of comparison. Our analyses of the extent of motor cortical maps and number of MEPs, in addition to the characteristics of both the contralateral and ipsilateral MEPs, will provide an important reference for those assessing rehabilitation following stroke. This also may prove to be a useful point of reference for other studies looking at neurological diseases typically associated with aging, such as Parkinson's disease.
5. Conclusions
We found that OA exhibit more diffuse motor cortical representations in the hemisphere both contralateral and ipsilateral to the recorded MEP, with larger representations correlated with higher reaction times. This indicates that increased functional activity seen during task performance in OA may not be due to task difficulty per se, but rather may be due to differences in the resting organization of the motor cortex and / or peripheral motor unit reorganization resulting in less distinctive cortical representations. Furthermore, the greater ipsilateral representations are consistent with findings of decreased interhemispheric inhibition with age.
Acknowledgements
The authors wish to thank A. Bosma, S. Chung, S. Gluhm, N. Goodman, T. Lodgson, and R. Trivedi for help with data collection and processing. J.A.B. is supported by NIA T32 AG000114 (R. Miller, PI). Both authors are members of The LIFE Course: Evolutionary and Ontogenetic Dynamics.
Footnotes
Publisher's Disclaimer: This is a PDF file of an unedited manuscript that has been accepted for publication. As a service to our customers we are providing this early version of the manuscript. The manuscript will undergo copyediting, typesetting, and review of the resulting proof before it is published in its final citable form. Please note that during the production process errors may be discovered which could affect the content, and all legal disclaimers that apply to the journal pertain.
Disclosure Statement. There are no conflicts of interest. This research was approved by the University of Michigan Institutional Review Board.
References
- Andersen JL. Muscle fiber type adaptation in the elderly human muscle. Scandinavian Journal of Medicine & Science in Sports. 2003;13:40–47. doi: 10.1034/j.1600-0838.2003.00299.x. [DOI] [PubMed] [Google Scholar]
- Baumann SB, Wozny DR, Kelly SK, Meno FM. The electrical conductivity of human cerebrospinal fluid at body temperature. IEEE Transaction on Biomedical Engineering. 1997;44:220–223. doi: 10.1109/10.554770. [DOI] [PubMed] [Google Scholar]
- Bawa P, Hamm JD, Dhillon P, Gross PA. Bilateral responses of upper limb muscles to transcranial magnetic stimulation in human subjects. Experimental Brain Research. 2004;158:385–390. doi: 10.1007/s00221-004-2031-x. [DOI] [PubMed] [Google Scholar]
- Bernard JA, Taylor SF, Seidler RD. Handedness, dexterity, and motor cortical representations. Journal of Neurophysiology. 2011;105:88–99. doi: 10.1152/jn.00512.2010. [DOI] [PubMed] [Google Scholar]
- Brinkman J, Kuypers HG. Cerebral control of contralateral and ipsilateral arm, hand and finger movements in the split-brain rhesus monkey. Brain. 1973;96:653–674. doi: 10.1093/brain/96.4.653. [DOI] [PubMed] [Google Scholar]
- Cabeza R. Hemispheric asymmetry reduction in older adults: the HAROLD model. Psychology and Aging. 2002;17:85–100. doi: 10.1037//0882-7974.17.1.85. [DOI] [PubMed] [Google Scholar]
- Calautti C, Serrati C, Baron JC. Effects of age on brain activation during auditory-cued thumb-to-index opposition: a positron emission tomorgraphy study. Stroke. 2001;32:139–146. doi: 10.1161/01.str.32.1.139. [DOI] [PubMed] [Google Scholar]
- Carp J, Gmeindl L, Reuter-Lorenz PA. Age differences in the neural representation of working memory revealed by multi-voxel pattern analysis. Frontiers in Human Neuroscience. 2010;4:1–10. doi: 10.3389/fnhum.2010.00217. [DOI] [PMC free article] [PubMed] [Google Scholar]
- Carp J, Park J, Polk TA, Park DC. Age differences in neural distinctiveness revealed by multi-voxel pattern analysis. NeuroImage. doi: 10.1016/j.neuroimage.2010.04.267. In Press. [DOI] [PMC free article] [PubMed] [Google Scholar]
- Carr LJ, Harrison LM, Stephens JA. Evidence for bilateral innervation of certain homologous motoneurone pools in man. Journal of Physiology. 1994;475:217–227. doi: 10.1113/jphysiol.1994.sp020063. [DOI] [PMC free article] [PubMed] [Google Scholar]
- Cramer SC, Bastings EP. Mapping clinically relevant plasticity after stroke. Neuropharmacology. 2000;39:842–851. doi: 10.1016/s0028-3908(99)00258-0. [DOI] [PubMed] [Google Scholar]
- Dassonville P, Zhu X-H, Ugurbil K, Kim S-G, Ashe J. Functional activation in motor cortex reflects the direction and degree of handedness. Proceedings of the National Academy of Sciences of the United States of America. 1997;94:14015–14018. doi: 10.1073/pnas.94.25.14015. [DOI] [PMC free article] [PubMed] [Google Scholar]
- Elbert T, Candia V, Altenmüller E, Rau H, Sterr A, Rockstroh B, Pantev C, Taub E. Alteration of digital representations in somatosensory cortex in focal hand dystonia. Neuroreport. 1998;9:3571–3575. doi: 10.1097/00001756-199811160-00006. [DOI] [PubMed] [Google Scholar]
- Eliasieh K, Liets LC, Chalupa LM. Cellular reorganization in the human retina during normal aging. Investigative Opthalmology & Visual Science. 2007;48:2824–2830. doi: 10.1167/iovs.06-1228. [DOI] [PubMed] [Google Scholar]
- Fling BW, Knight CA, Kamen G. Relationships between motor unit size and recruitment threshold in older adults: implications for the size principle. Experimental Brain Research. 2009;197:125–133. doi: 10.1007/s00221-009-1898-y. [DOI] [PubMed] [Google Scholar]
- Folstein MF, Folstein SE, McHugh PR. Mini-mental state: a practical method for grading the cognitive state of patients for the clinician. Journal of Psychiatric Research. 1975;12:189–198. doi: 10.1016/0022-3956(75)90026-6. [DOI] [PubMed] [Google Scholar]
- Fujiyama H, Garry MI, Levin O, Swinnen SP, Summers JJ. Age-related differences in inhibitory processes during interlimb coordination. Brain Research. 2009;1262:38–47. doi: 10.1016/j.brainres.2009.01.023. [DOI] [PubMed] [Google Scholar]
- Hallett M. Plasticity of the human motor cortex and recovery from stroke. Brain Research Reviews. 2001;36:169–174. doi: 10.1016/s0165-0173(01)00092-3. [DOI] [PubMed] [Google Scholar]
- Heuninckx S, Wenderoth N, Debaere F, Peeters R, Swinnen SP. Neural Basis of aging: the penetration of cognition into action control. The Journal of Neuroscience. 2005;25:6787–6796. doi: 10.1523/JNEUROSCI.1263-05.2005. [DOI] [PMC free article] [PubMed] [Google Scholar]
- Heuninckx S, Wenderoth N, Swinnen SP. Systems neuroplasticity in the aging brain: recruiting additional neural resources for successful motor performance in elderly persons. The Journal of Neuroscience. 2008;28:91–99. doi: 10.1523/JNEUROSCI.3300-07.2008. [DOI] [PMC free article] [PubMed] [Google Scholar]
- Hutchinson S, Kobayashi M, Horkan CM, Pascual-Leone A, Alexander MP, Schlaug G. Age-related differences in movement representation. NeuroImage. 2002;17:1720–1728. doi: 10.1006/nimg.2002.1309. [DOI] [PubMed] [Google Scholar]
- Jung P, Ziemann U. Differences of the ipsilateral silent period in small hand muscles. Muscle Nerve. 2006;34:431–436. doi: 10.1002/mus.20604. [DOI] [PubMed] [Google Scholar]
- Langan J, Peltier SJ, Bo. J, Fling BW, Welsh RC, Seidler RD. Functional implications of age differences in motor system connectivity. Frontiers in Systems Neuroscience. 2010;4:1–11. doi: 10.3389/fnsys.2010.00017. [DOI] [PMC free article] [PubMed] [Google Scholar]
- Liepert J, Bauder H, Miltner WHR, Taub E, Weiller C. Treatment-induced cortical reorganization after stroke in humans. Stroke. 2000a;31:1210–1216. doi: 10.1161/01.str.31.6.1210. [DOI] [PubMed] [Google Scholar]
- Liepert J, Graef S, Uhde I, Leidner O, Weiller C. Training-induced changes of motor cortex representations in stroke patients. Acta Neurologica Scnadanavia. 2000b;101:321–326. doi: 10.1034/j.1600-0404.2000.90337a.x. [DOI] [PubMed] [Google Scholar]
- Li SC, Lindenberger U. Cross-level unification: a computational exploration of the link between deterioration of the neurotransmitter systems and the dedifferentiation of cognitive abilities in old age. 1999. [Google Scholar]
- Li SC, Lindenberger U, Sickström S. Aging cognition: from neuromodulation to representation. Trends in Cognitive Science. 2001;5:421–426. doi: 10.1016/s1364-6613(00)01769-1. [DOI] [PubMed] [Google Scholar]
- Li SC, Sikström S. Integrative neurocomputational perspectives on cognitive aging, neuromodulation, and representation. Neuroscience and Biobehavioral Reviews. 2002;26:795–808. doi: 10.1016/s0149-7634(02)00066-0. [DOI] [PubMed] [Google Scholar]
- Mattay VS, Fera F, Tessitore A, Hariri AR, Das JH, Callicott JH, et al. Neurophysiological correlates of age-related changes in human motor function. Neurology. 2002;58:630–635. doi: 10.1212/wnl.58.4.630. [DOI] [PubMed] [Google Scholar]
- Mattis S. Mental status examination for organic mental syndrome in the elderly patient. In: Bellak L, Karasu TB, editors. Geriatric Psychiatry: A Handbook for Psychiatrists and Primary Care Physicians. Grune & Stratton; NY: 1976. pp. 77–121. [Google Scholar]
- Müller-Oehring EM, Schulte T, Raassi C, Pfefferbaum A, Sullivan EV. Local-global interference is modulated by age, sex, and anterior corpus callosum size. Brain Research. 2007;1142:189–205. doi: 10.1016/j.brainres.2007.01.062. [DOI] [PMC free article] [PubMed] [Google Scholar]
- Naccarato M, Calautti C, Jones PS, Day DJ, Carpenter TA, Baron J-C. Does healthy aging affect the hemispheric activation balance during paced index-to-thumb opposition task? An fMRI study. NeuroImage. 2006;32:1250–1256. doi: 10.1016/j.neuroimage.2006.05.003. [DOI] [PubMed] [Google Scholar]
- Netz J, Lammers T, Homberg V. Reorganization of motor output in the non-affected hemisphere after stroke. Brain. 1997;120:1579–1586. doi: 10.1093/brain/120.9.1579. [DOI] [PubMed] [Google Scholar]
- Oldfield RC. The assessment and analysis of handedness: the Edinburgh inventory. Neuropsychologia. 1971;9:97–113. doi: 10.1016/0028-3932(71)90067-4. [DOI] [PubMed] [Google Scholar]
- Oliviero A, Profice P, Tonali PA, Pilato F, Saturno E, Dileone M, Ranieri F, Di Lazzaro V. Effects of aging on motor cortex excitability. Neuroscience Research. 2006);55:74–77. doi: 10.1016/j.neures.2006.02.002. [DOI] [PubMed] [Google Scholar]
- Olson CB, Carpenter DO, Henneman E. Orderly recruitment of muscle action potentials. Archives of Neurology. 1968;19:591–597. doi: 10.1001/archneur.1968.00480060061008. [DOI] [PubMed] [Google Scholar]
- Park DC, Polk TA, Park R, Minear M, Savage A, Smith MR. Aging reduces neural specialization in ventral visual cortex. Proceedings of the National Academy of Sciences of the United States of America. 2004;101:13091–13095. doi: 10.1073/pnas.0405148101. [DOI] [PMC free article] [PubMed] [Google Scholar]
- Pascual-Leone A, Dang N, Cohen LG, Brasil-Neto JP, Cammarota A, Hallett M. Modulation of muscle responses evoked by transcranial magnetic stimulation during the acquisition of new fine motor skills. Journal of Neurophysiology. 1995;74:1037–1045. doi: 10.1152/jn.1995.74.3.1037. [DOI] [PubMed] [Google Scholar]
- Peinemann A, Lehner C, Conrad B, Siebner HR. Age-related decrease in paired-pulse intracortical inhibition in the human primary motor cortex. Neuroscience Letters. 2001;313:33–36. doi: 10.1016/s0304-3940(01)02239-x. [DOI] [PubMed] [Google Scholar]
- Pitcher JB, Miles TS. Alterations in corticospinal excitability with imposed vs. voluntary fatigue in human hand muscles. Journal of Applied Physiology. 2002;92:2131–2138. doi: 10.1152/japplphysiol.00835.2001. [DOI] [PubMed] [Google Scholar]
- Pitcher JB, Ogston KM, Miles TS. Age and sex differences in human motor cortex input and output statistics. Journal of Physiology. 2003;546:605–613. doi: 10.1113/jphysiol.2002.029454. [DOI] [PMC free article] [PubMed] [Google Scholar]
- Polidori C, Zeng Y-C, Zaccheo D, Amenta F. Age-related changes in the visual cortex: a review. Archives of Gerontology and Geriatrics. 1993;17:145–164. doi: 10.1016/0167-4943(93)90047-l. [DOI] [PubMed] [Google Scholar]
- Reuter-Lorenz PA. New visions of the aging mind and brain. Trends in Cognitive Science. 2002;6:394–400. doi: 10.1016/s1364-6613(02)01957-5. [DOI] [PubMed] [Google Scholar]
- Reuter-Lorenz PA, Jonides J, Smith EE, Hartley A, Miller A, Marshuetz C, Koeppe RA. Age differences in the frontal lateralization of verbal and spatial working memory revealed by PET. Journal of Cognitive Neuroscience. 2000;12:174–187. doi: 10.1162/089892900561814. [DOI] [PubMed] [Google Scholar]
- Reuter-Lorenz PA, Lustig C. Brain aging: reorganizing discoveries about the aging mind. Current Opinion in Neurobiology. 2005;15:245–251. doi: 10.1016/j.conb.2005.03.016. [DOI] [PubMed] [Google Scholar]
- Riecker A, Groschel K, Ackermann H, Steinbrink C, Witter O, Kastrup A. Functional significance of age-related differences in motor activation patterns. NeuroImage. 2006;32:1345–1354. doi: 10.1016/j.neuroimage.2006.05.021. [DOI] [PubMed] [Google Scholar]
- Rogasch NC, Dartnall TJ, Cirillo J, Nordstrom MA, Semmler JG. Corticomotor plasticity and learning of a ballistic thumb training task are diminished in older adults. Journal of Applied Physiology. 2009;107:1874–1883. doi: 10.1152/japplphysiol.00443.2009. [DOI] [PubMed] [Google Scholar]
- Rossini PM, Desiato MT, Caramia MD. Age-related changes of motor evoked potentials in healthy humans: non-invasive evaluation of central and peripheral motor tracts excitability and conductivity. Brain Research. 1992;593:14–19. doi: 10.1016/0006-8993(92)91256-e. [DOI] [PubMed] [Google Scholar]
- Sawaki L, Yaseen Z, Kopylev L, Cohen LG. Age-dependent changes in the ability to encode a novel motor memory. Annals of Neurology. 2003;53:521–524. doi: 10.1002/ana.10529. [DOI] [PubMed] [Google Scholar]
- Seidler RD, Bernard JA, Burutolu TB, Fling BW, Gordon MT, Gwin JT, Kwak Y, Lipps D. Motor control and aging: links to age-related brain structural, functional, and biochemical effects. Neuroscience & Biobehavioral Reviews. 2010;34:721–733. doi: 10.1016/j.neubiorev.2009.10.005. [DOI] [PMC free article] [PubMed] [Google Scholar]
- Seidler RD, Noll DC, Theirs G. Feedforward and feedback processes in motor control. NeuroImage. 2004;22:1775–1783. doi: 10.1016/j.neuroimage.2004.05.003. [DOI] [PubMed] [Google Scholar]
- Silbert LC, Nelson C, Homan S, Eaton R, Oken BS, Lou JS, Kaye JA. Cortical excitability and age-related volumetric MRI changes. Clinical Neurophysiology. 2006;117:1029–1036. doi: 10.1016/j.clinph.2006.02.003. [DOI] [PubMed] [Google Scholar]
- Sparing R, Buelte D, Meister IG, Paus T, Fink GR. Transcranial magnetic stimulation and the challenge of coil placement: a comparison of conventional and stereotaxic neuronavigational strategies. Human Brain Mapping. 2008;29:82–96. doi: 10.1002/hbm.20360. [DOI] [PMC free article] [PubMed] [Google Scholar]
- Steingrüber HJ. Zur messung der hädigkeit. Zeitschrift für Experiementelle und Angewandte Psychologie. 1971;18:337–357. [PubMed] [Google Scholar]
- Talelli P, Ewas A, Waddingham W, Rothwell JC, Ward NS. Neural correlates of age-related changes in cortical neurophysiology. NeuroImage. 2008a;40:1772–1781. doi: 10.1016/j.neuroimage.2008.01.039. [DOI] [PMC free article] [PubMed] [Google Scholar]
- Talelli PM, Waddingham W, Ewas A, Rothwell JC, Ward NS. The effect of age on task-related modulation of interhemispheric balance. Experimental Brain Research. 2008b;186:59–66. doi: 10.1007/s00221-007-1205-8. [DOI] [PMC free article] [PubMed] [Google Scholar]
- Tecchio F, Zappasodi F, Pasqualetti P, DeGennaro L, Pellicciari MC, Ercolani M, Squitti R, Rossini PM. Age dependence of primary motor cortex plasticity induced by paired associative stimulation. Clinical Neurophysiology. 2008;119:675–682. doi: 10.1016/j.clinph.2007.10.023. [DOI] [PubMed] [Google Scholar]
- Tiffin J, Asher EJ. The Purdue pegboard; norms and studies of reliability and validity. Journal of Applied Psychology. 1948;32:234–247. doi: 10.1037/h0061266. [DOI] [PubMed] [Google Scholar]
- Triggs WJ, Calvanio R, Macdonell RAL, Cros D, Chiappa KH. Physiological motor asymmetry in human handedness: evidence from transcranial magnetic stimulation. Brain Research. 1994;636:270–276. doi: 10.1016/0006-8993(94)91026-x. [DOI] [PubMed] [Google Scholar]
- Triggs WJ, Subramanian B, Rossi F. Hand preference and transcranial magnetic stimulation asymmetry of cortical motor representation. Brain Research. 1999;835:3294–329. doi: 10.1016/s0006-8993(99)01629-7. [DOI] [PubMed] [Google Scholar]
- Verstynen T, Diedrichsen J, Albert N, Aparicio P, Ivry RB. Ipsilateral motor cortex activity during unimanual hand movements relates to task complexity. Journal of Neurophysiology. 2005;93:1209–1222. doi: 10.1152/jn.00720.2004. [DOI] [PubMed] [Google Scholar]
- Ward NS. Compensatory mechanisms in the aging motor system. Ageing Research Reviews. 2006;5:239–254. doi: 10.1016/j.arr.2006.04.003. [DOI] [PubMed] [Google Scholar]
- Ward NS, Frackowiak RS. Age-related changes in the neural correlates of motor performance. Brain. 2003;126:873–888. doi: 10.1093/brain/awg071. [DOI] [PMC free article] [PubMed] [Google Scholar]
- Wassermann EM, McShane LM, Hallett M, Cohen LG. Noninvasive mapping of muscle representations in human motor cortex. Electroencephalography and Clinical Neurophysiology. 1992;85:1–8. doi: 10.1016/0168-5597(92)90094-r. [DOI] [PubMed] [Google Scholar]
- Wittenberg GF, Chen R, Ishii K, Bushara KO, Taub E, Gerber LH, Hallett M, Cohen LG. Constraint-induced therapy in stroke: magnetic-stimulation motor maps and cerebral activation. Neurorehabilitation and Neural Repair. 2003;17:48–57. doi: 10.1177/0888439002250456. [DOI] [PubMed] [Google Scholar]
- Ziemann U, Ishii K, Borgheresi A, Yaseen Z, Battaglia F, Hallett M, et al. Dissociation of the pathways mediating ipsilateral and contralateral motor-evoked potentials in human hand and arm muscles. Journal of Physiology. 1999;518:895–906. doi: 10.1111/j.1469-7793.1999.0895p.x. [DOI] [PMC free article] [PubMed] [Google Scholar]