Races in Hilo, Hawaii (HI) Detailed Stats
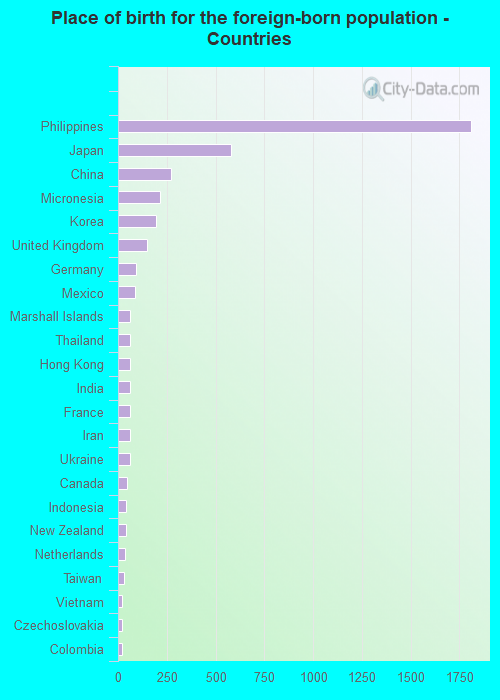
Ancestries, Foreign-born residents, place of birth
Latest news about races in Hilo, HI collected exclusively by city-data.com from local newspapers, TV, and radio stations
According to 2024 data, the most numerous races in Hilo, HI are Asian alone (17,790 residents), Two or more races (12,987 residents), and White alone (7,420 residents). 78.3% of Hilo residents speak English at home. 11.5% of Hilo, HI residents are foreign-born (8.2% born in Asia, 1.6% born in Oceania), which is 48.3% less than the foreign-born rate of 17.0% across the entire state of Hawaii.
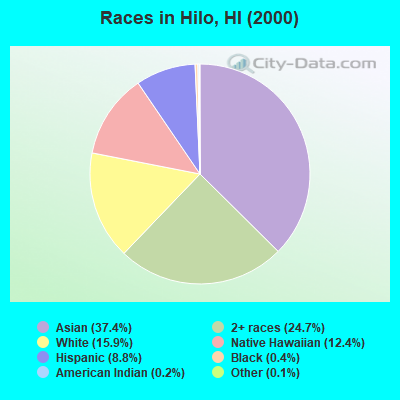
Race distribution in Hilo
2000
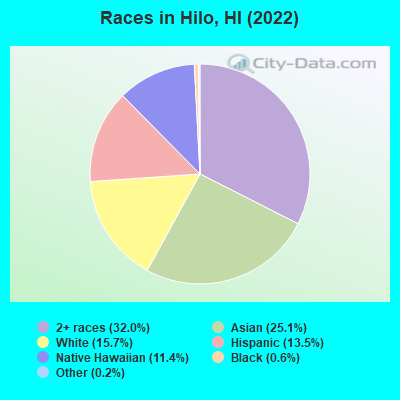
2024

- 15,25937.4%Asian alone
- 10,05024.7%Two or more races
- 6,49115.9%White alone
- 5,06612.4%Native Hawaiian and Other
Pacific Islander alone
- 3,5798.8%Hispanic
- 1620.4%Black alone
- 910.2%American Indian alone
- 610.1%Other race alone
-
- 17,79034.6%Asian alone
- 12,98725.3%Two or more races
- 7,42014.4%White alone
- 6,76113.2%Native Hawaiian and Other
Pacific Islander alone
- 5,84211.4%Hispanic
- 3140.6%Black alone
- 1910.4%Other race alone
- 390.08%American Indian alone
2000
2024
-
- 494,14940.8%Asian alone
- 277,09122.9%White alone
- 218,70018.1%Two or more races
- 108,4419.0%Native Hawaiian and Other
Pacific Islander alone
- 87,6997.2%Hispanic
- 20,8291.7%Black alone
- 2,0890.2%Other race alone
- 2,5390.2%American Indian alone
-
- 514,88035.6%Asian alone
- 320,66322.2%Two or more races
- 299,57320.7%White alone
- 147,89610.2%Hispanic
- 132,2669.1%Native Hawaiian and Other
Pacific Islander alone
- 23,5421.6%Black alone
- 5,2640.4%Other race alone
- 2,0620.1%American Indian alone
Income and house value in Hilo
- Median household income in 2024
- $78,843White non-Hispanic householders
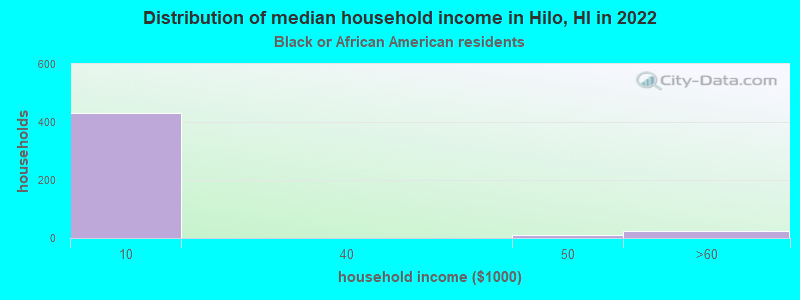
- $2,618Black householders
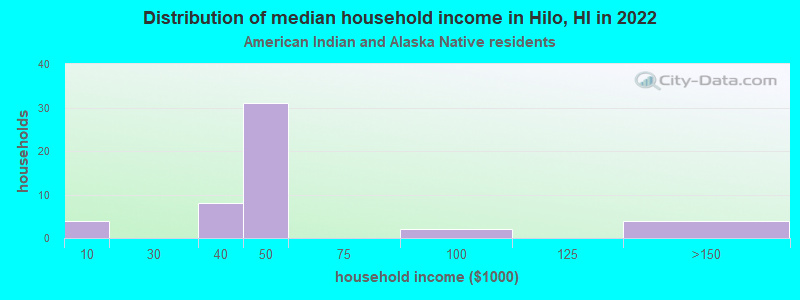
- $106,628American Indian and Alaska Native householders
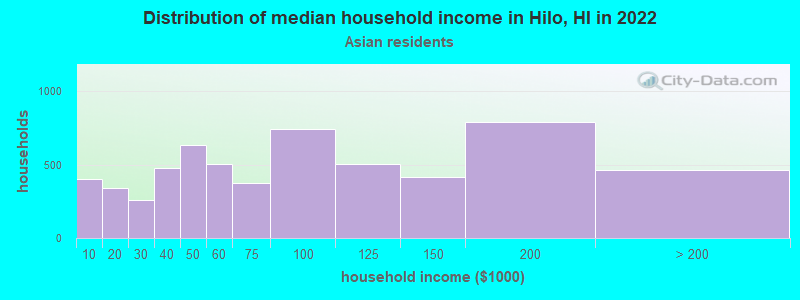
- $95,112Asian householders
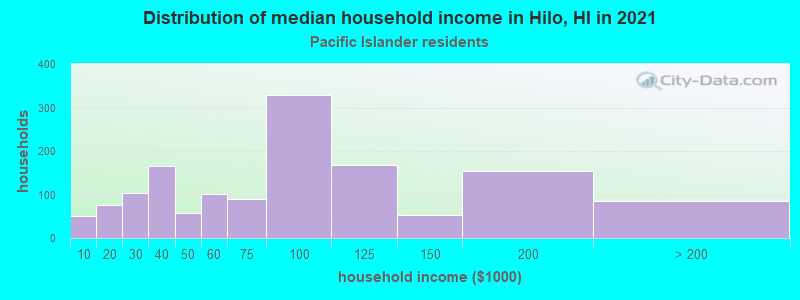
- $58,025Native Hawaiian and other Pacific Islander householders
- $45,081Some other race householders
- $76,755Two or more races householders
- $71,210Hispanic or Latino race householders
- Median 2024 house value
- $580,130White Non-Hispanic householders
- $590,011Black or African American householders
- $492,617American Indian or Alaska Native householders
- $542,372Asian householders
- $460,152Native Hawaiian and other Pacific Islander householders
- $444,978Some other race householders
- $532,845Two or more races householders
- $509,555Hispanic or Latino householders
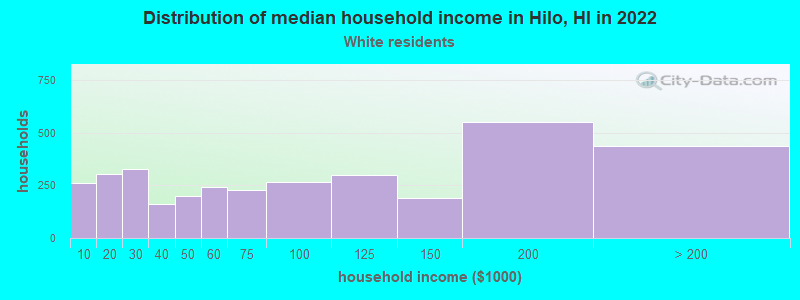
Household income for White non-Hispanic householders

Household income for Black householders
Household income for American Indian and Alaska Native householders
Household income for Asian householders
Household income for Native Hawaiian and other Pacific Islander householders
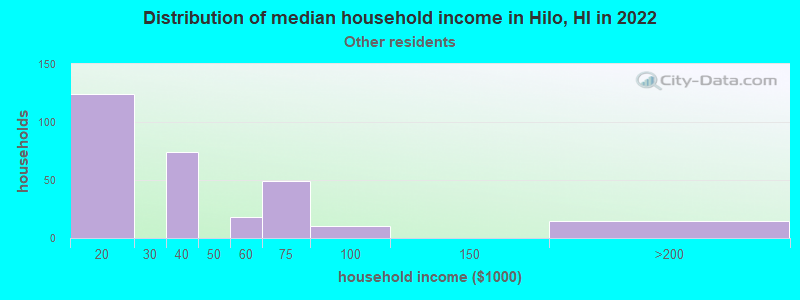
Household income for Some other race householders
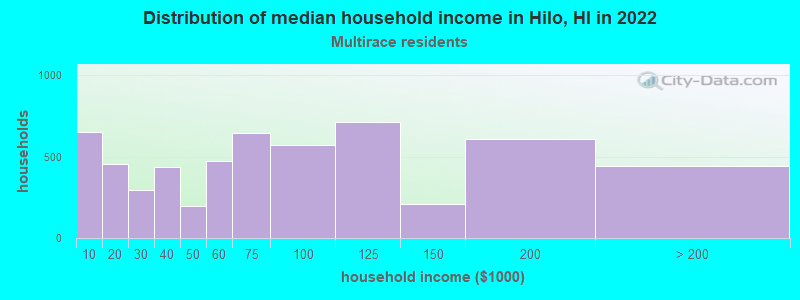
Household income for Two or more races householders
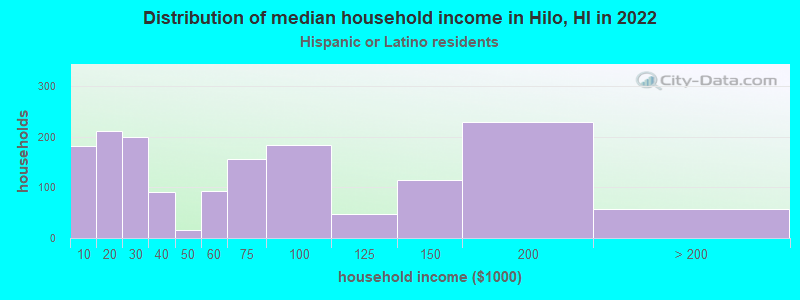
Household income for Hispanic or Latino race householders
Median age by race in Hilo
- 55.5Median age for White residents
- 50.9Males
- 57.8Females
- 30.1Median age for Black or African American residents
- 39.0Males
- 58.2Females
- 32.6Median age for American Indian / Alaska Native residents
- -656,976,743.5Males
- 33.4Females
- 51.1Median age for Asian residents
- 49.2Males
- 52.1Females
- 40.6Median age for Native Hawaiian / Pacific Islander residents
- 40.0Males
- 40.8Females
- 17.1Median age for Other race residents
- 67.4Males
- 0.0Females
- 31.6Median age for Two or more races residents
- 25.5Males
- 36.6Females
- 57.1Median age for White alone residents
- 51.7Males
- 58.4Females
- 23.0Median age for Hispanic or Latino residents
- 20.6Males
- 26.5Females
Owner/renter occupied households by race in Hilo
- House owners and renters - White residents
- 2,24660.3%Owner occupied
- 1,47839.7%Renter occupied
- House owners and renters - Black or African American residents
- 62.2%Owner occupied
- 25397.8%Renter occupied
- House owners and renters - American Indian / Alaska Native residents
- 15290.3%Owner occupied
- 169.7%Renter occupied
- House owners and renters - Asian residents
- 4,83071.1%Owner occupied
- 1,96028.9%Renter occupied
- House owners and renters - Native Hawaiian / Pacific Islander residents
- 1,27855.1%Owner occupied
- 1,04044.9%Renter occupied
- House owners and renters - Other race residents
- 11042.4%Owner occupied
- 15057.6%Renter occupied
- House owners and renters - Two or more races residents
- 3,12071.4%Owner occupied
- 1,24728.6%Renter occupied
- House owners and renters - White alone residents
- 2,16861.7%Owner occupied
- 1,34438.3%Renter occupied
- House owners and renters - Hispanic or Latino residents
- 86245.6%Owner occupied
- 1,03054.4%Renter occupied
Language usage in Hilo
- English speakers - Total
- 78.3% of residents of Hilo speak English at home.
- 1.7% of residents speak Spanish at home
- 63277.0%Speak English very well
- 18923.0%Speak English less than very well
- 19.4% of residents speak other language at home
- 6,20564.9%Speak English very well
- 3,36335.1%Speak English less than very well
- English speakers - Born in the United States
- 87.3% of residents of Hilo speak English at home.
- 4.9% of residents speak Spanish at home
- 39396.6%Speak English very well
- 143.4%Speak English less than very well
- 7.0% of residents speak other language at home
- 55896.0%Speak English very well
- 234.0%Speak English less than very well
- English speakers - Native, born elsewhere
- 68.5% of residents of Hilo speak English at home.
- 0.5% of residents speak Spanish at home
- 6100.0%Speak English very well
- 29.8% of residents speak other language at home
- 37899.7%Speak English very well
- 10.3%Speak English less than very well
- English speakers - Foreign-born
- 20.0% of residents of Hilo speak English at home.
- 2.5% of residents speak Spanish at home
- 4531.2%Speak English very well
- 9968.8%Speak English less than very well
- 72.9% of residents speak other language at home
- 1,76541.4%Speak English very well
- 2,50058.6%Speak English less than very well
White (Caucasian) - Speak only English| Native: | 93.8% (6,826) |
| Foreign-born: | 61.9% (248) |
White (Caucasian) - Speak another language| Native: | 6.2% (450) |
| Foreign-born: | 38.0% (152) |
American Indian / Alaska Native - Speak another language| Native: | 71.6% (102) |
| Foreign-born: | 100.0% (2) |
Asian - Speak only English| Native: | 94.1% (13,580) |
| Foreign-born: | 26.4% (979) |
Asian - Speak another language| Native: | 7.6% (1,100) |
| Foreign-born: | 75.0% (2,779) |
Native Hawaiian / Pacific Islander - Speak only English| Native: | 68.9% (3,906) |
| Foreign-born: | 11.9% (113) |
Native Hawaiian / Pacific Islander - Speak another language| Native: | 30.8% (1,745) |
| Foreign-born: | 76.5% (726) |
Other race - Speak only English| Native: | 63.0% (218) |
| Foreign-born: | 0.5% (1) |
Other race - Speak another language| Native: | 35.5% (123) |
| Foreign-born: | 100.0% (192) |
Two or more races - Speak only English| Native: | 86.4% (12,973) |
| Foreign-born: | 8.3% (27) |
Two or more races - Speak another language| Native: | 13.3% (1,991) |
| Foreign-born: | 93.7% (309) |
White alone - Speak only English| Native: | 94.3% (6,476) |
| Foreign-born: | 61.0% (248) |
White alone - Speak another language| Native: | 5.6% (387) |
| Foreign-born: | 38.8% (158) |
Hispanic or Latino - Speak only English| Native: | 74.3% (3,729) |
| Foreign-born: | 4.6% (11) |
Hispanic or Latino - Speak another language| Native: | 25.9% (1,301) |
| Foreign-born: | 100.0% (241) |
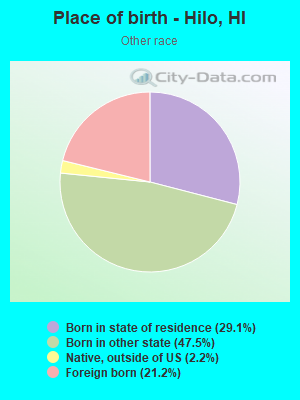
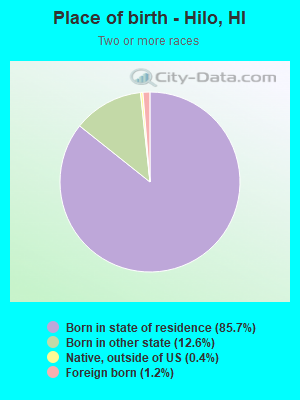
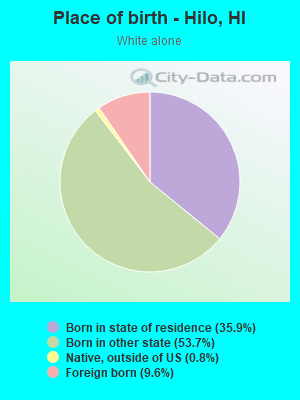
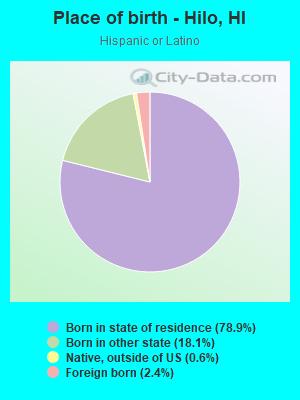
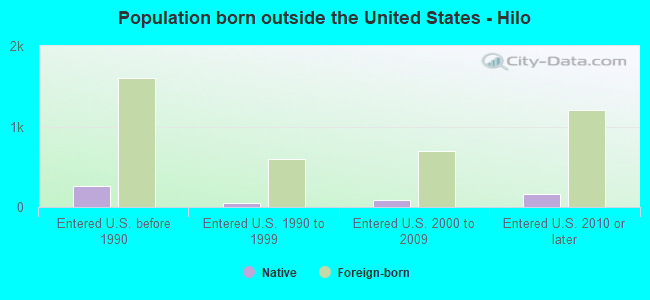
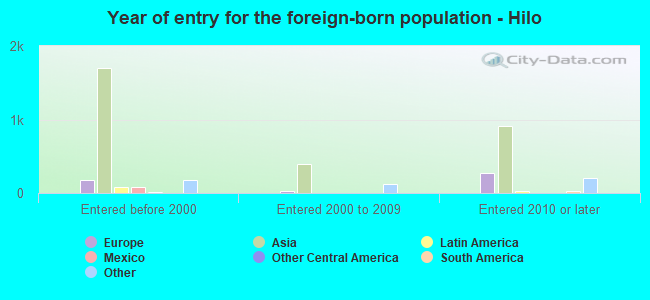
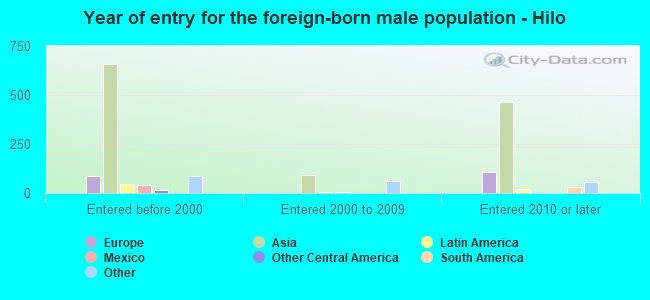
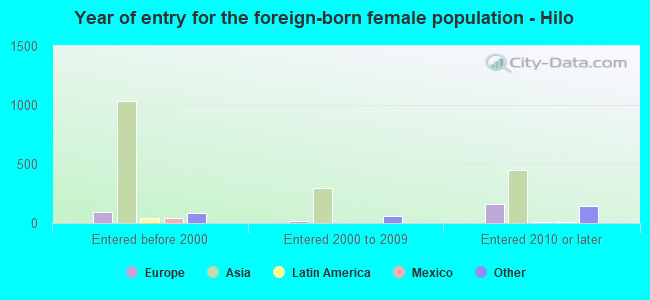
Foreign-born residents in Hilo
5,889 residents are foreign born (8.2% Asia, 1.6% Oceania).
| This city: | 11.5% |
| Hawaii: | 17.9% |
Marital status for residents in Hilo
Marital status - White (Caucasian) population 15 years and over
- Males
- 33.2%Never married
- 49.0%Now married
- 1.2%Separated
- 3.9%Widowed
- 12.8%Divorced
- Females
- 28.0%Never married
- 37.2%Now married
- 0.6%Separated
- 17.1%Widowed
- 17.1%Divorced
Women who gave birth in the past 12 months| Now married: | 0.0% (0) |
| Unmarried: | 100.0% (15) |
Women who did not give birth in the past 12 months| Now married: | 32.1% (501) |
| Unmarried: | 67.9% (1,061) |
Marital status - Black or African American population 15 years and over
- Males
- 88.6%Never married
- 8.8%Now married
- 0.0%Separated
- 0.0%Widowed
- 2.5%Divorced
- Females
- 22.0%Never married
- 64.4%Now married
- 0.0%Separated
- 13.6%Widowed
- 0.0%Divorced
Women who did not give birth in the past 12 months| Now married: | 92.0% (19) |
| Unmarried: | 8.0% (2) |
Marital status - American Indian / Alaska Native population 15 years and over
- Males
- 0.0%Never married
- 100.0%Now married
- 0.0%Separated
- 0.0%Widowed
- 0.0%Divorced
- Females
- 100.0%Never married
- 0.0%Now married
- 0.0%Separated
- 0.0%Widowed
- 0.0%Divorced
Women who gave birth in the past 12 months| Now married: | 0.0% (0) |
| Unmarried: | 100.0% (91) |
Women who did not give birth in the past 12 months| Now married: | 0.0% (0) |
| Unmarried: | 100.0% (38) |
Marital status - Asian population 15 years and over
- Males
- 31.1%Never married
- 58.4%Now married
- 1.9%Separated
- 2.4%Widowed
- 6.2%Divorced
- Females
- 20.9%Never married
- 49.9%Now married
- 1.4%Separated
- 18.2%Widowed
- 9.6%Divorced
Women who gave birth in the past 12 months| Now married: | 37.7% (73) |
| Unmarried: | 62.3% (122) |
Women who did not give birth in the past 12 months| Now married: | 46.3% (1,658) |
| Unmarried: | 53.7% (1,923) |
Marital status - Native Hawaiian / Pacific Islander population 15 years and over
- Males
- 45.0%Never married
- 43.3%Now married
- 4.6%Separated
- 2.4%Widowed
- 4.6%Divorced
- Females
- 36.3%Never married
- 40.0%Now married
- 1.0%Separated
- 8.1%Widowed
- 14.5%Divorced
Women who gave birth in the past 12 months| Now married: | 35.7% (21) |
| Unmarried: | 64.3% (37) |
Women who did not give birth in the past 12 months| Now married: | 34.9% (631) |
| Unmarried: | 65.1% (1,179) |
Marital status - Other race population 15 years and over
- Males
- 17.0%Never married
- 61.0%Now married
- 0.0%Separated
- 0.9%Widowed
- 21.1%Divorced
- Females
- 63.4%Never married
- 29.0%Now married
- 0.0%Separated
- 2.1%Widowed
- 5.5%Divorced
Women who did not give birth in the past 12 months| Now married: | 9.3% (10) |
| Unmarried: | 90.7% (99) |
Marital status - Two or more races population 15 years and over
- Males
- 51.0%Never married
- 36.6%Now married
- 2.6%Separated
- 2.1%Widowed
- 7.8%Divorced
- Females
- 45.5%Never married
- 33.3%Now married
- 1.6%Separated
- 6.4%Widowed
- 13.3%Divorced
Women who gave birth in the past 12 months| Now married: | 60.4% (108) |
| Unmarried: | 39.6% (71) |
Women who did not give birth in the past 12 months| Now married: | 31.9% (1,213) |
| Unmarried: | 68.1% (2,593) |
Marital status - White alone, not Hispanic / Latino population 15 years and over
- Males
- 33.0%Never married
- 49.2%Now married
- 1.2%Separated
- 4.0%Widowed
- 12.6%Divorced
- Females
- 25.5%Never married
- 38.6%Now married
- 0.7%Separated
- 17.9%Widowed
- 17.3%Divorced
Women who gave birth in the past 12 months| Now married: | 0.0% (0) |
| Unmarried: | 100.0% (14) |
Women who did not give birth in the past 12 months| Now married: | 34.3% (490) |
| Unmarried: | 65.7% (941) |
Marital status - Hispanic or Latino population 15 years and over
- Males
- 53.3%Never married
- 33.3%Now married
- 3.0%Separated
- 0.8%Widowed
- 9.5%Divorced
- Females
- 56.2%Never married
- 25.2%Now married
- 3.0%Separated
- 3.1%Widowed
- 12.5%Divorced
Women who gave birth in the past 12 months| Now married: | 16.5% (33) |
| Unmarried: | 83.5% (168) |
Women who did not give birth in the past 12 months| Now married: | 25.2% (362) |
| Unmarried: | 74.8% (1,076) |
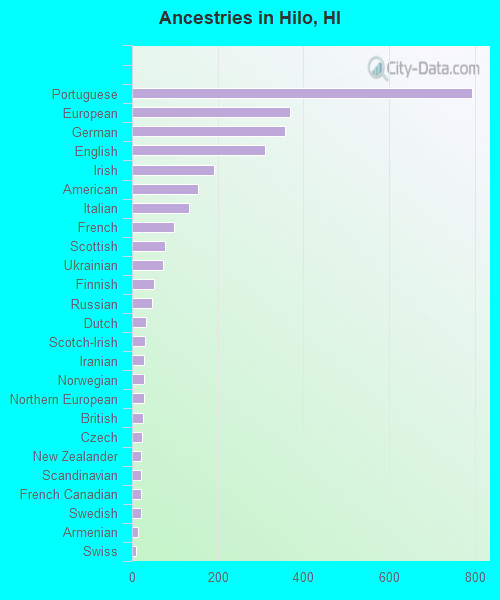
Ancestries in Hilo

- 7453.0%Portuguese
- 4691.9%European
- 3351.3%English
- 3251.3%German
- 3041.2%Italian
- 1720.7%Irish
- 1210.5%American
- 730.3%French
- 700.3%Russian
- 680.3%Scottish
- 570.2%Brazilian
- 510.2%Northern European
- 370.1%Polish
- 330.1%Dutch
- 320.1%French Canadian
- 300.1%Ukrainian
- 290.1%Scandinavian
- 240.10%Greek
- 210.08%New Zealander
- 210.08%Swedish
- 200.08%Norwegian
- 160.06%Hungarian
- 110.04%British
- 110.04%Welsh
- 100.04%Lithuanian
- 100.04%Slovak
- 90.04%Eastern European
- 90.04%Swiss
- 70.03%Scotch-Irish
- 60.02%Finnish
- 50.02%Croatian
- 30.01%Australian
- 30.01%Czech
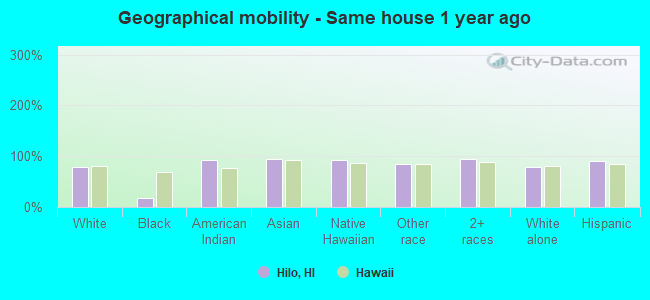
Geographical mobility in Hilo

- Same house 1 year ago
- 6,40381.6%White (Caucasian)
- 329.0%Black or African American
- 5738.4%American Indian / Alaska Native
- 16,89791.6%Asian
- 5,78190.6%Native Hawaiian / Pacific Islander
- 34175.5%Other race
- 14,31888.2%Two or more races
- 6,08281.8%White alone, not Hispanic / Latino
- 4,77983.9%Hispanic or Latino
-
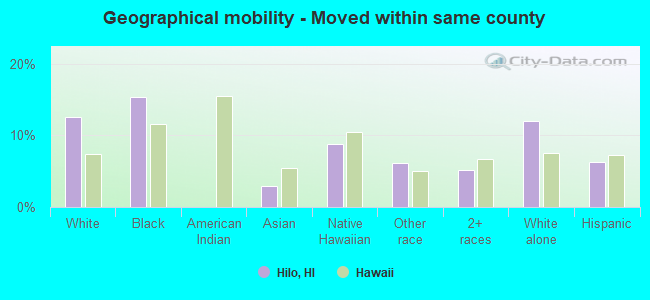
- Moved within same county
- 5837.4%White / Caucasian
- 3810.8%Black or African American
- 9262.2%American Indian / Alaska Native
- 2651.4%Asian
- 5108.0%Native Hawaiian / Pacific Islander
- 11625.8%Other race
- 1,1907.3%Two or more races
- 5377.2%White alone, not Hispanic / Latino
- 61410.8%Hispanic or Latino
-
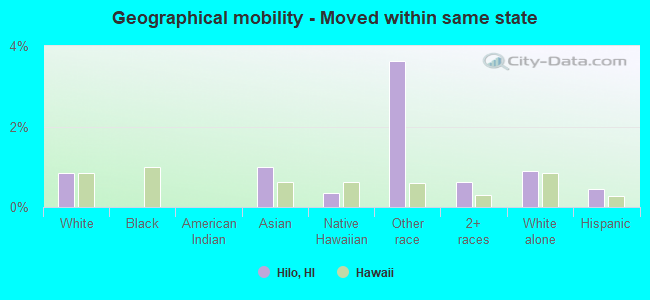
- Moved within same state
- 981.3%White / Caucasian
- 2061.1%Asian
- 260.4%Native Hawaiian / Pacific Islander
- 4332.7%Two or more races
- 981.3%White alone, not Hispanic / Latino
- 3025.3%Hispanic or Latino
-
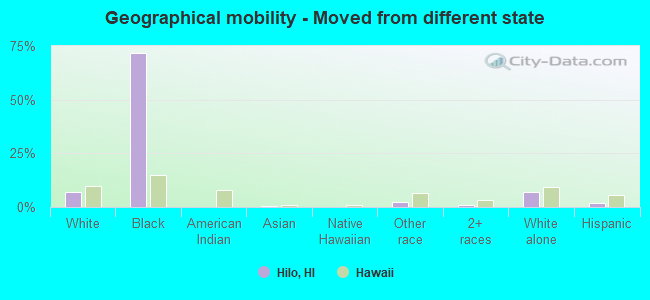
- Moved from different state
- 3664.7%White / Caucasian
- 30887.5%Black or African American
- 8034.4%Asian
- 210.3%Native Hawaiian / Pacific Islander
- 173.8%Other race
- 3732.3%Two or more races
- 3104.2%White alone, not Hispanic / Latino
- 1232.2%Hispanic or Latino
-
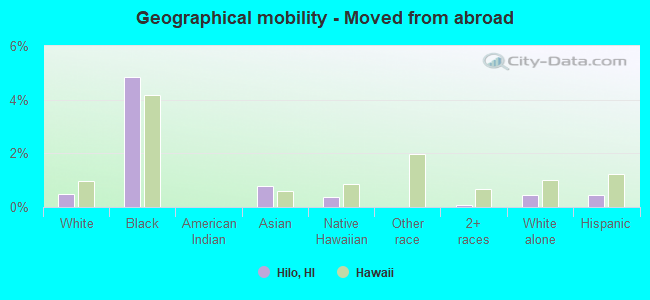
- Moved from abroad
- 470.6%White
- 5342.9%Asian
- 410.6%Native Hawaiian / Pacific Islander
- 60.0%Two or more races
- 470.6%White alone, not Hispanic / Latino
- 110.2%Hispanic or Latino
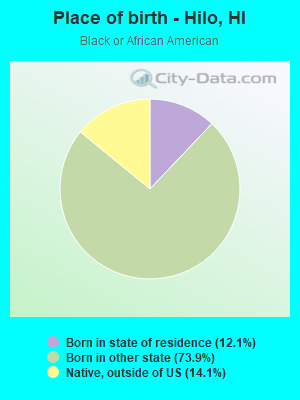
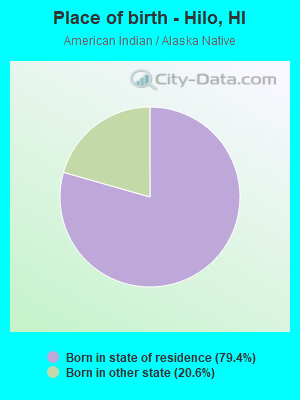
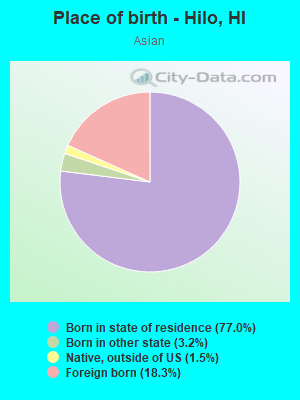
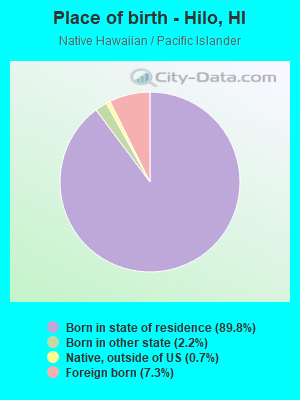
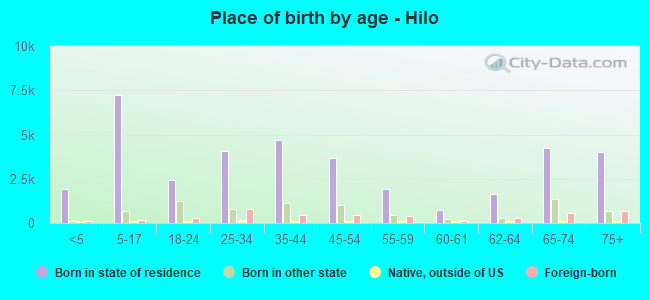
Children Nativity (place of birth) in Hilo
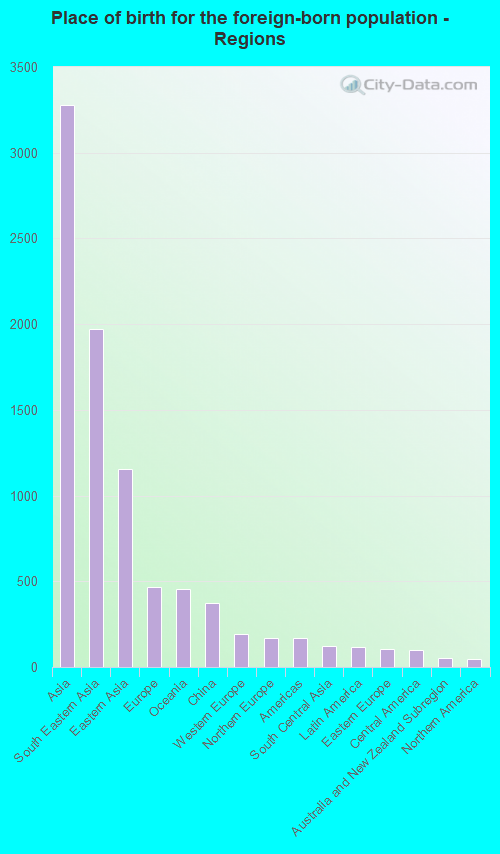
Children under 6 years - Living with two parentsBoth parents native519100.0%NativeBoth parents foreign-born31096.0%Native134.0%Foreign-bornOne native, one foreign-born parent272100.0%NativeChildren under 6 years - Living with one parentNative parent955100.0%NativeForeign-born parent7643.8%Native9856.2%Foreign-born Children 6 to 17 years - Living with two parentsBoth parents native3,060100.0%NativeBoth parents foreign-born35177.7%Native10122.3%Foreign-bornOne native, one foreign-born parent38379.6%Native9820.4%Foreign-bornChildren 6 to 17 years - Living with one parentNative parent2,706100.0%NativeForeign-born parent30960.5%Native20239.5%Foreign-born Place of birth for residents in Hilo

- 4,382Asia
- 2,336South Eastern Asia
- 1,867Eastern Asia
- 858Oceania
- 421Europe
- 397China
- 211Americas
- 179South Central Asia
- 178Western Europe
- 113Northern Europe
- 113Latin America
- 97Northern America
- 86Eastern Europe
- 67Central America
- 54Australia and New Zealand Subregion
- 45South America
- 42Southern Europe
- 15Africa
- 7Eastern Africa
- 7Northern Africa
- 1Southern Africa
-
- 1,930Philippines
- 1,241Japan
- 458Micronesia
- 349China
- 230Vietnam
- 198Marshall Islands
- 181Korea
- 176India
- 111Germany
- 101Thailand
- 97Canada
- 80United Kingdom
- 66Netherlands
- 57Mexico
- 56Indonesia
- 43New Zealand
- 40Italy
- 36Russia
- 36Chile
- 33Taiwan
- 26Poland
- 19Ukraine
- 15England
- 14Hong Kong
- 11Cambodia
- 10Australia
- 10El Salvador
- 9Denmark
- 9Colombia
- 5Croatia
- 5Malaysia
- 3Fiji
- 3Iran
- 2Spain
- 1South Africa
Grandparents responsible for own grandchildren in Hilo
Grandparents (30 to 59 years)White / Caucasian10100.0%Not responsible for grandchildrenAsian1716.2%Responsible for grandchildren8683.8%Not responsible for grandchildrenNative Hawaiian / Pacific Islander158.5%Responsible for grandchildren15591.5%Not responsible for grandchildrenTwo or more races14272.6%Responsible for grandchildren5327.4%Not responsible for grandchildrenWhite alone, not Hispanic / Latino9100.0%Not responsible for grandchildrenHispanic or Latino1145.4%Responsible for grandchildren1354.6%Not responsible for grandchildren Grandparents (60 years and over)White / Caucasian42.2%Responsible for grandchildren15497.8%Not responsible for grandchildrenAsian8216.1%Responsible for grandchildren42983.9%Not responsible for grandchildrenNative Hawaiian / Pacific Islander15153.7%Responsible for grandchildren13046.3%Not responsible for grandchildrenTwo or more races308.8%Responsible for grandchildren30991.2%Not responsible for grandchildrenWhite alone, not Hispanic / Latino42.3%Responsible for grandchildren14897.7%Not responsible for grandchildrenHispanic or Latino610.0%Responsible for grandchildren5890.0%Not responsible for grandchildren