
2025 Volume 2 introduces a new Block Editor component, code blocks and row/column pasting in the Rich Text Editor, and multiple features for the Gantt Chart.
What’s New
 What’s New in Syncfusion® Angular UI Components
Syncfusion® Angular components now fully support Angular 20, ensuring compatibility with its latest features, improved performance, and seamless integration with the newest Angular CLI tools.
The Block Editor component has been added to the Angular suite.
The Angular Block Editor is a block-based content editing solution for web applications. It provides an intuitive and flexible interface for creating rich, structured documents using interactive content blocks.
This component supports many block types and text-formatting options, enabling users to compose and manage content with precision.
/ commands to insert or transform content blocks.
The Angular AI AssistView supports attaching files directly to the prompts. This allows users to include documents (like .docx, .pdf, or images) to enhance prompt context and get more accurate AI responses.

The Angular AI AssistView supports div-based text input instead of traditional textarea, offering a more intuitive and flexible user experience for prompt entry.
The Chart component supports highlighting the last value of a series with a label and a grid line indicator. This provides a clear and immediate reference point for the series endpoint, improving data readability and user interaction. The feature is beneficial when the final data point needs to be emphasized, such as financial charts indicating the latest stock price or performance metrics highlighting the most recent data entry.

The chat UI supports indicating the user’s presence and activity states, including online, offline, busy, and away statuses.

The compact mode aligns all messages to the left regardless of the sender, creating a streamlined layout ideal for group conversations or space-constrained interfaces.

Users can perform message-level actions directly within the chat interface, including copy, reply, pin, delete, and forward actions.

The Angular Chat UI supports div-based text input instead of traditional textarea, offering a more intuitive and flexible user experience for prompt entry.
The Angular DateRangePicker now lets users type date ranges in specific formats of their choice, making it easier to fill out forms for booking trips, scheduling events, or planning projects. Users can enter dates like 10 Jan 2025 - 12 Jan 2026 or 01/01/25 - 01/02/25, and the component will recognize them correctly. This saves time, reduces mistakes, and works smoothly in your apps without extra setup.

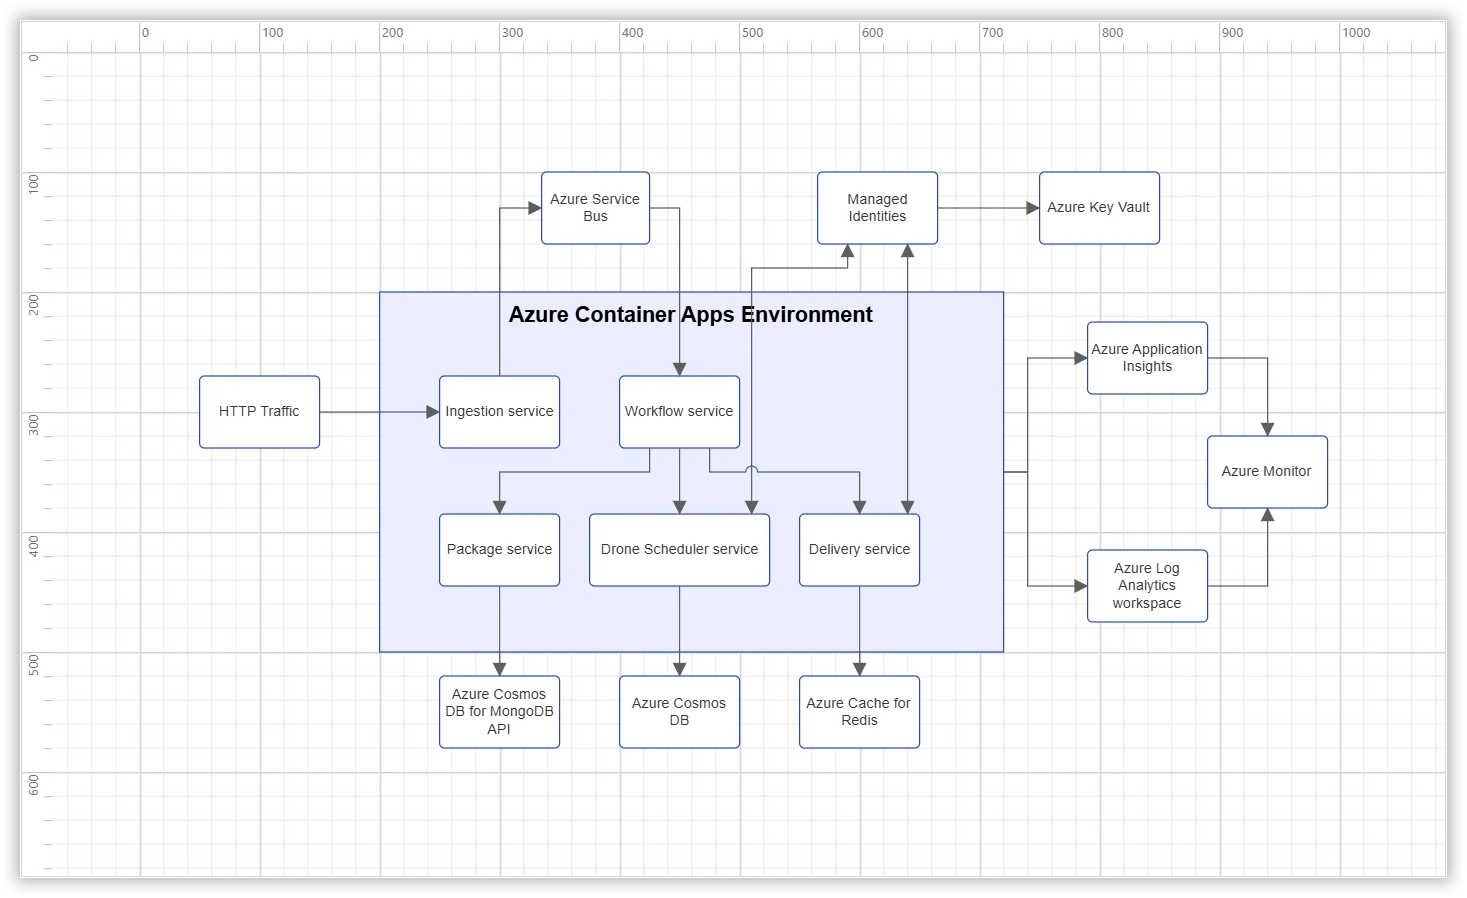
This feature allows users to group multiple nodes and connectors, providing a structured layout to manage complex diagrams. Containers support dragging, resizing, and customization for headers, text styles, and more. They help maintain an organized layout without permanently merging elements, making them ideal for workflows, BPMN diagrams, and system designs.
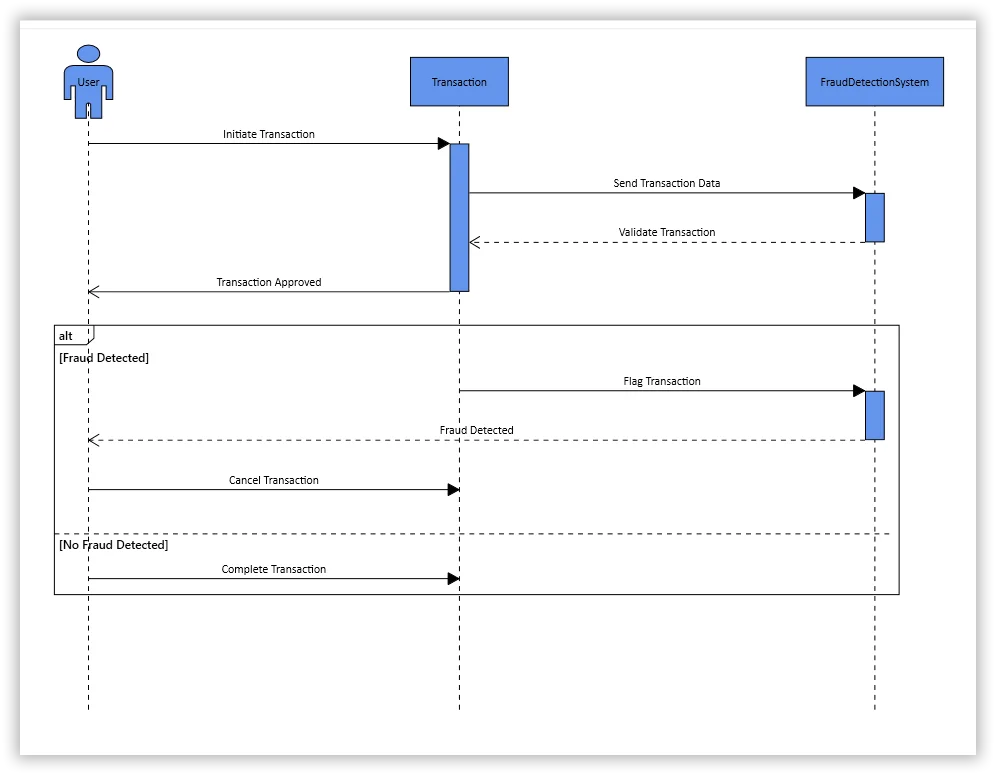
A UML sequence diagram visually represents how a set of objects interact in a process over time. With this feature, you can automatically generate these diagrams from model data, streamlining the visualization of interactions between objects in a system. It dynamically creates lifelines, messages, and activation boxes based on the provided data, reducing manual effort and ensuring accuracy.
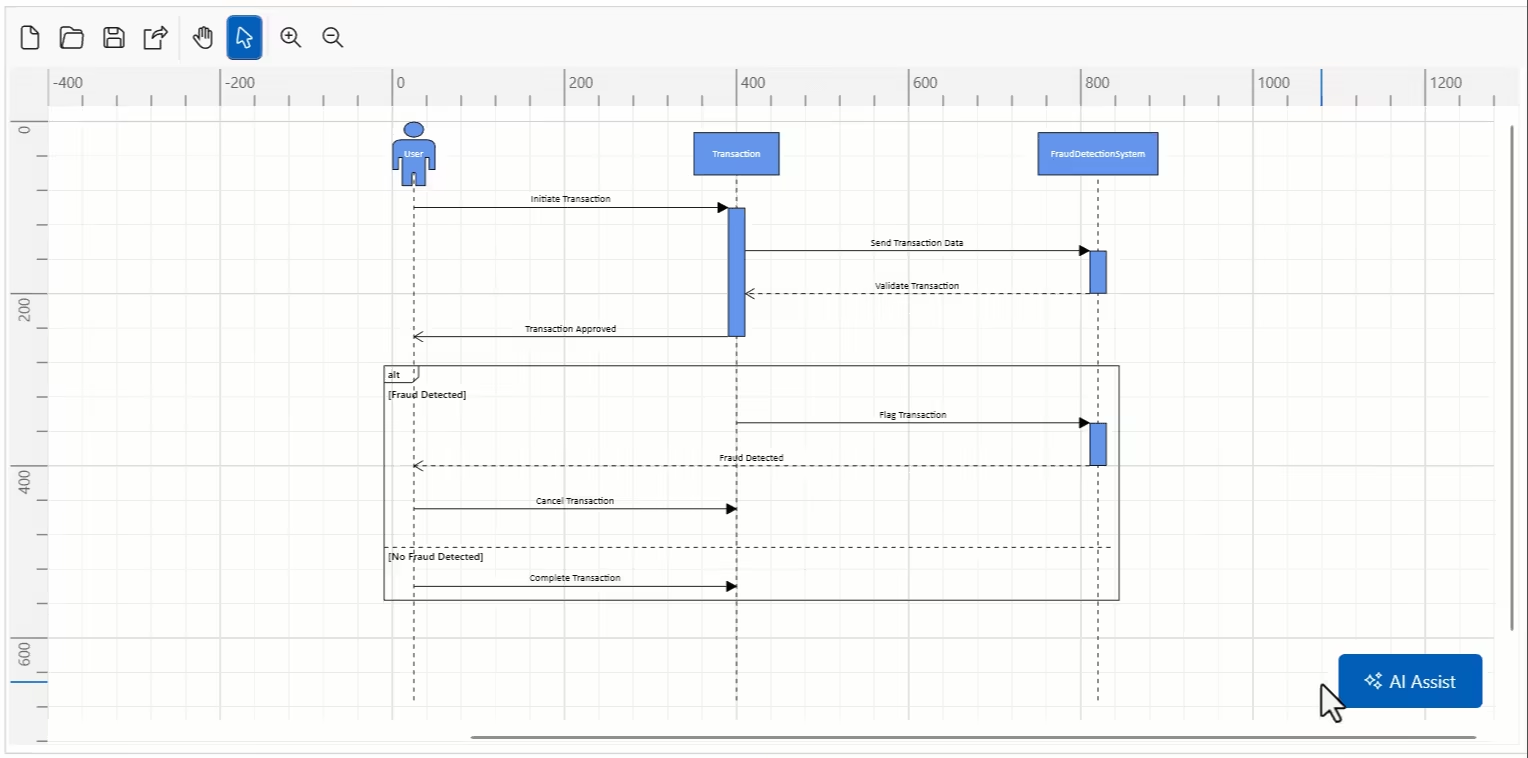
Mermaid syntax is a Markdown-inspired text-based language designed to define diagrams through simple, readable commands. This feature allows users to create UML sequence diagrams from Mermaid syntax and export them back, simplifying visualization, sharing, editing, and cross-platform use. Users can also use AI assistants to generate Mermaid syntax for these diagrams and directly import it into the Angular Diagram component.
This feature allows users to create a port dynamically by clicking and dragging the mouse over any node or connector. This behavior is turned off by default but can be activated by adding the AutomaticPortCreation enum to the Constrain property of the Diagram.

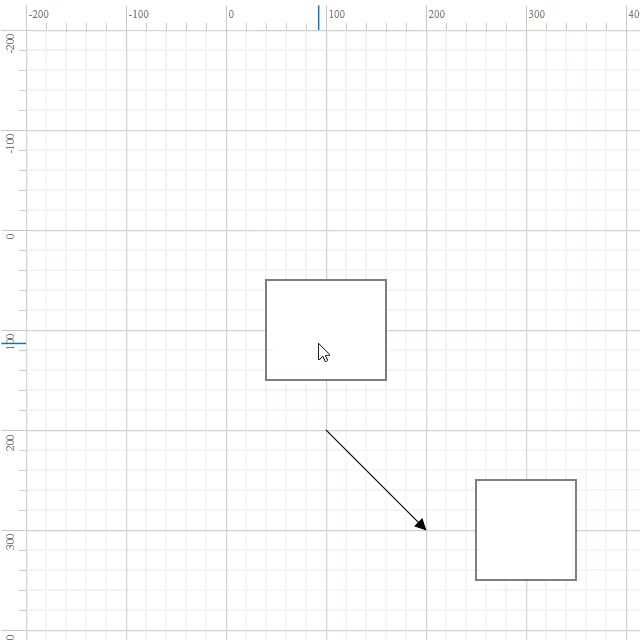
This feature allows users to restrict diagram elements from being dragged into the negative axis. This behavior is turned off by default and can be activated by adding the RestrictNegativeAxisDragDrop enum to the Constrain property of the Diagram. When RestrictNegativeAxisDragDrop is enabled, diagram elements such as nodes, connectors, connector end thumbs, groups, swim lane objects, and stencil symbols can be restricted from dragging when the drag operation enters a negative zone.
The Diagram component now renders significantly faster while initially loading with nodes that contain annotations and connectors. Basic node rendering performance in large diagrams has been improved by an outstanding 92.03% when rendering 10,000 nodes with connectors and annotations.
The Document Editor provides a Microsoft Word-like Ribbon UI that organizes tools and commands into intuitive tabs and groups, making editing faster and easier. Contextual tabs appear dynamically based on user actions, providing a streamlined experience. The ribbon is also fully customizable to suit specific application needs.

The Document Editor supports screen readers for better accessibility. When enabled, it provides the necessary information so that screen reader tools can read and interpret the content.
The new enableLayout API lets users skip the layout and rendering process when loading or editing documents programmatically, improving performance. By default, layout and rendering run as usual, but can be disabled to speed up bulk changes programmatically in the Document Editor.
The following enhancements allow users to automate the required behaviors of editing the Word document content easily.
This feature ensures that the group shape in Word documents is preserved, maintaining its integrity when a document is opened and saved using the Word Processor component.

The Angular dropdown components (Dropdown List, ComboBox, AutoComplete, and MultiSelect Dropdown) now offer a smoother typing experience when users search through lists. The component waits briefly for users to finish typing before showing results, making searches feel less jerky and distracting. It works right away in your projects, enhancing usability for large lists.

This feature allows developers to set an authorization header for image retrieval operations, helping them protect sensitive data during transfers when handling image files. Developers can now implement authorization policies that meet their application’s specific security requirements without additional complex configurations. This feature is particularly useful for applications that operate in a secure environment or need to comply with specific data protection standards.
Users can toggle the visibility of weekend cells in the timeline. This feature allows customization of the timeline view to focus solely on working days, making it easier to interpret and manage project data efficiently.

The Angular Gantt Chart introduces a WBS column to visualize the hierarchical organization of tasks. This addition helps users effectively organize, track, and analyze tasks using work breakdown levels. This feature enhances task clarity and makes project planning more structured and efficient.

Enhance your planning with the task constraints feature in the Angular Gantt Chart. This visually represents constraints such as “start no earlier than” or “finish no later than” to understand task dependencies and schedule limits directly from the chart.

The Angular Data Grid can now integrate with the Charts component, allowing users to visualize selected grid data through interactive charts. This integration combines tabular and graphical views for deeper insights. Chart types, axes, and visual elements can all be customized.

Users can now open images with specified width and height values using the imageSettings parameter in the Open method. This enhancement introduces three additional properties: width, height, and isAspectRatio. Image dimensions can be precisely controlled while preserving the aspect ratio, if needed. This provides more control over rendering images, especially when dealing with high-resolution images or fixed canvas requirements.

Underline and Strikethrough formatting options have been added to text annotations. This feature is useful for creating instructional materials, documentation screenshots, and professional image presentations.

Users can load BMP (Bitmap) image files, expanding its file format compatibility. Users can upload BMP files via the file uploader UI or programmatically using the Open method. This addresses the needs of design professionals and users working with high-resolution images.

This feature allows users to control the smoothing effect of high-resolution images. When enabled, the component applies image smoothing to images during rendering, reducing distortion and jagged edges in scaled or rotated images.

The PDF Viewer now supports squiggly annotations as part of the text markup annotation types. This feature enables users to underline text with a distinctive wavy line, usually indicating that it needs to be reviewed further.

The PDF Viewer now supports zooming in the page organizer. This enhancement provides an interactive zoom experience to help users identify the pages they are organizing.

The classic layout has been added to the server-side engine for relational data. Each field in the row axis is displayed in a separate column, providing a detailed and traditional tabular view similar to classic pivot layouts in Excel. Explore this feature in the demo.

Enables value-based sorting simultaneously on both row and column axes, independent of the value axis. This allows flexible and accurate data analysis across dimensions. Explore this feature in the demo.

Allows exporting the pivot table as a native Excel PivotTable, preserving the pivot structure in the exported file. Users can continue interacting with and customizing the pivot data directly within Excel. Explore this feature in the demo.

The code block feature allows users to insert and display formatted code snippets directly within the editor. It also includes a language switch option in the dropdown menu, enabling users to specify the programming language for each code block.

This feature provides an option to render the toolbar at the bottom of the editor. This improves accessibility and layout adaptability, especially in mobile and touch-first interfaces. It enhances user interaction by keeping toolbar actions easily reachable.

Users can copy and paste entire rows or columns within a table, streamlining the editing and formatting process. Data can be efficiently duplicated without the need to manually re-enter information, thereby enhancing productivity.

Users can insert horizontal lines to separate content sections visually. This feature improves document readability and structure, particularly in long-form content or reports, by allowing clear demarcation between different sections or topics.

The Rich Text Editor supports popup overflow mode in its toolbar. When there isn’t enough space to display all toolbar items, the overflowing items automatically move to a popup container, ensuring that all features remain accessible without cluttering the interface.

The recent color option in the font color and background color pickers allows users to quickly access and reuse recently applied colors, improving formatting efficiency and ensuring visual consistency.

Improve performance by excluding style properties when importing Excel files through the server-side library. Skipping styles reduces the JSON size and accelerates rendering, especially for large or complex Excel files.
The Stock Chart component now supports highlighting the last value of a series with both a label and a grid line indicator. This enhancement provides developers with a clear and immediate reference point for the series endpoint, improving data readability and user interaction. The feature is beneficial in scenarios where the final data point needs to be emphasized, such as in financial charts to indicate the latest stock price.

The TreeGrid now supports sticky headers, which keep column headers visible while scrolling through large datasets. By enabling the enableStickyHeader property, headers stay fixed at the top, making it easier to understand data.

Angular TreeGrid demo with a sticky header
The TreeGrid now supports loading child rows on demand with row virtualization when using remote data. This improves performance by rendering only visible rows and fetching data as needed. It provides smooth scrolling and faster load times for large datasets.
